EXHIBIT 99.1
Published on August 10, 2016
Axalta Coating Systems Ltd.
Investor Presentation
Third Quarter 2016
Exhibit 99.1
PROPRIETARYAXALTA COATING SYSTEMS 2
Forward-Looking Statements
This presentation and the oral remarks made in connection herewith may contain “forward-looking statements” within the meaning of the U.S. Private Securities Litigation Reform Act of 1995,
including those relating to 2016 financial projections, including execution on our 2016 goals as well as 2016 net sales, Adjusted EBITDA, Adjusted EBITDA margin, interest expense, income tax
rate, as adjusted, diluted shares, capital expenditures, depreciation and amortization, working capital, cost savings and related assumptions. Any forward-looking statements involve risks,
uncertainties and assumptions. These statements often include words such as “believe,” “expect,” “anticipate,” “intend,” “plan,” “estimate,” “target,” “project,” “forecast,” “seek,” “will,” “may,” “should,”
“could,” “would,” or similar expressions. These statements are based on certain assumptions that we have made in light of our experience in the industry and our perceptions of historical trends,
current conditions, expected future developments and other factors we believe are appropriate under the circumstances as of the date hereof. Although we believe that the assumptions and
analysis underlying these statements are reasonable as of the date hereof, investors are cautioned not to place undue reliance on these statements. We do not have any obligation to and do not
intend to update any forward-looking statements included herein, which speak only as of the date hereof. You should understand that these statements are not guarantees of future performance or
results. Actual results could differ materially from those described in any forward-looking statements contained herein or the oral remarks made in connection herewith as a result of a variety of
factors, including known and unknown risks and uncertainties, many of which are beyond our control.
Non-GAAP Financial Measures
The historical financial information included in this presentation includes financial information that is not presented in accordance with generally accepted accounting principles in the United States
(“GAAP”), including constant currency net sales, EBITDA, Adjusted EBITDA, Free Cash Flow, and Net Debt. Management uses these non-GAAP financial measures in the analysis of our financial
and operating performance because they assist in the evaluation of underlying trends in our business. Adjusted EBITDA consists of EBITDA adjusted for (i) non-operating income or expense, (ii)
the impact of certain non-cash or other items that are included in net income and EBITDA that we do not consider indicative of our ongoing performance and (iii) certain unusual items impacting
results in a particular period. We believe that making such adjustments provides investors meaningful information to understand our operating results and ability to analyze financial and business
trends on a period-to-period basis. Our use of the terms constant currency net sales, EBITDA, Adjusted EBITDA, Free Cash Flow, and Net Debt may differ from that of others in our industry.
Constant currency net sales, EBITDA, Adjusted EBITDA and Free Cash Flow should not be considered as alternatives to net income, operating income or any other performance measures derived
in accordance with GAAP as measures of operating performance or operating cash flows or as measures of liquidity. Constant currency net sales, EBITDA, Adjusted EBITDA, Free Cash Flow and
Net Debt have important limitations as analytical tools and should be considered in conjunction with, and not as substitutes for, our results as reported under GAAP. This presentation includes a
reconciliation of certain non-GAAP financial measures with the most directly comparable financial measures calculated in accordance with GAAP. The company does not provide a reconciliation for
non-GAAP estimates on a forward-looking basis where it is unable to provide a meaningful or accurate calculation or estimate of reconciling items and the information is not available without
reasonable effort.
Segment Financial Measures
The primary measure of segment operating performance is Adjusted EBITDA, which is a key metric that is used by management to evaluate business performance in comparison to budgets,
forecasts, and prior year financial results, providing a measure that management believes reflects the Company’s core operating performance. As we do not measure segment operating
performance based on Net Income, a reconciliation of this non-GAAP financial measure with the most directly comparable financial measure calculated in accordance with GAAP is not available.
Defined Terms
All capitalized terms contained within this presentation have been previously defined in our filings with the United States Securities and Exchange Commission.
Legal Notices
PROPRIETARYAXALTA COATING SYSTEMS
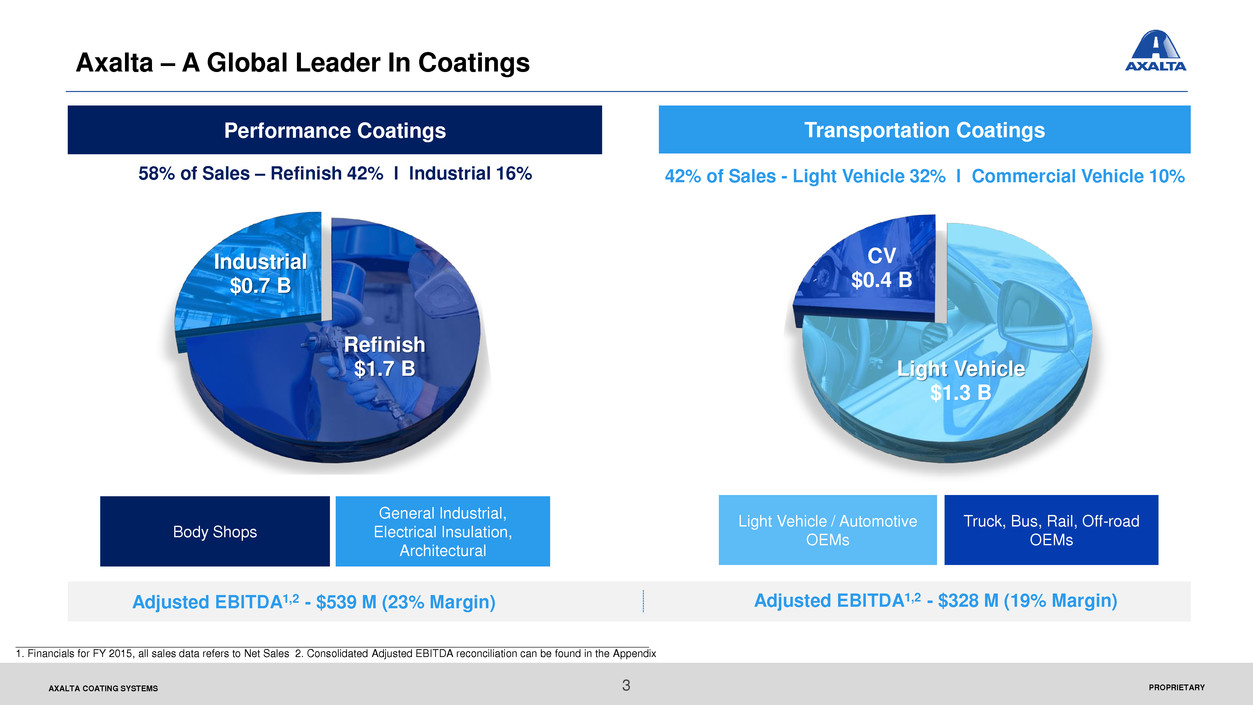
Refinish
$1.7 B
Industrial
$0.7 B
Body Shops
Light Vehicle
$1.3 B
CV
$0.4 B
Performance Coatings
General Industrial,
Electrical Insulation,
Architectural
Transportation Coatings
Adjusted EBITDA1,2 - $539 M (23% Margin) Adjusted EBITDA1,2 - $328 M (19% Margin)
Light Vehicle / Automotive
OEMs
Truck, Bus, Rail, Off-road
OEMs
58% of Sales – Refinish 42% l Industrial 16% 42% of Sales - Light Vehicle 32% l Commercial Vehicle 10%
____________________________________________________________________________________________________________
1. Financials for FY 2015, all sales data refers to Net Sales 2. Consolidated Adjusted EBITDA reconciliation can be found in the Appendix
3
Axalta – A Global Leader In Coatings
AXALTA COATING SYSTEMS
Key Goals For 2016
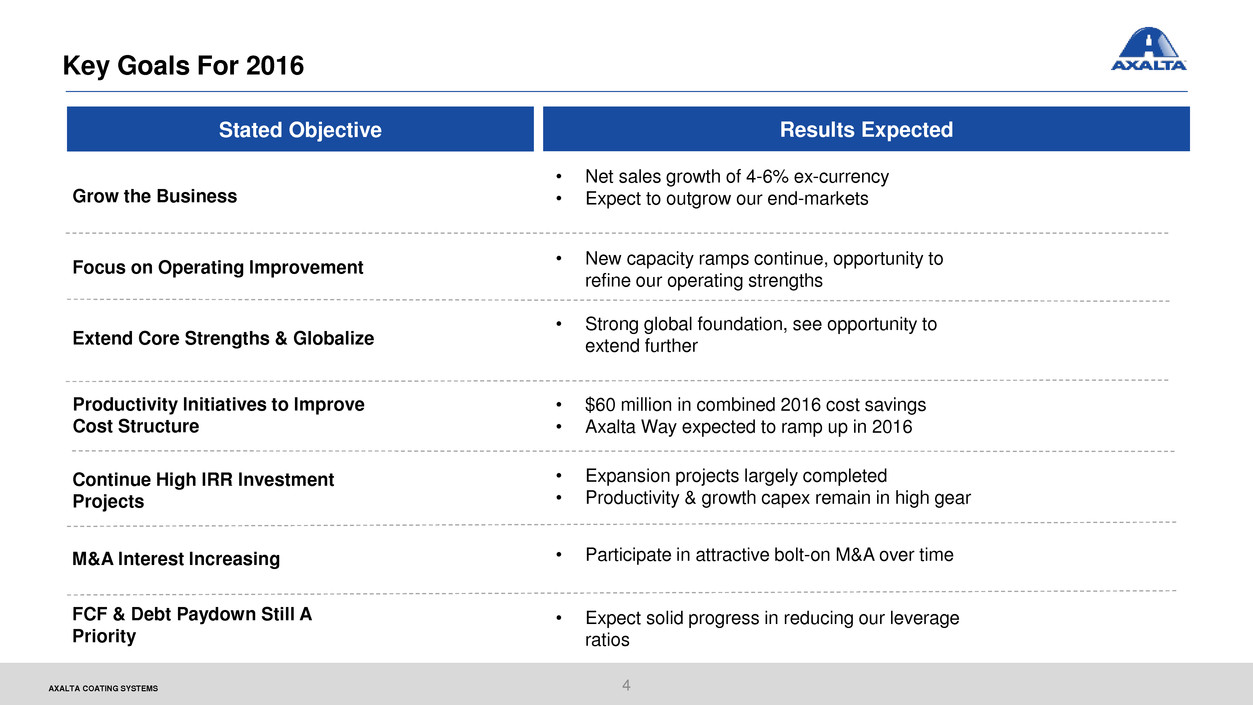
Grow the Business
Productivity Initiatives to Improve
Cost Structure
Focus on Operating Improvement
Extend Core Strengths & Globalize
• Net sales growth of 4-6% ex-currency
• Expect to outgrow our end-markets
• $60 million in combined 2016 cost savings
• Axalta Way expected to ramp up in 2016
• New capacity ramps continue, opportunity to
refine our operating strengths
• Strong global foundation, see opportunity to
extend further
Continue High IRR Investment
Projects
• Expansion projects largely completed
• Productivity & growth capex remain in high gear
4
M&A Interest Increasing • Participate in attractive bolt-on M&A over time
FCF & Debt Paydown Still A
Priority
• Expect solid progress in reducing our leverage
ratios
Stated Objective Results Expected
PROPRIETARYAXALTA COATING SYSTEMS 5
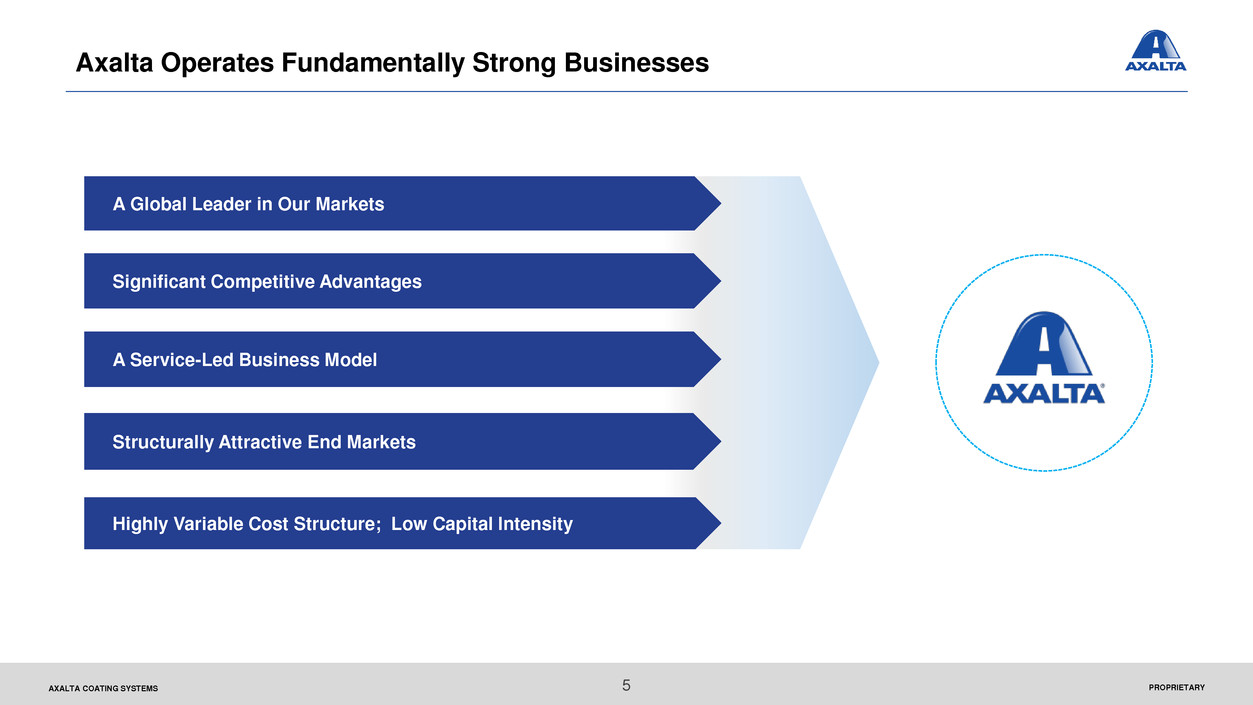
Axalta Operates Fundamentally Strong Businesses
A Global Leader in Our Markets
Significant Competitive Advantages
A Service-Led Business Model
Structurally Attractive End Markets
Highly Variable Cost Structure; Low Capital Intensity
PROPRIETARYAXALTA COATING SYSTEMS 6
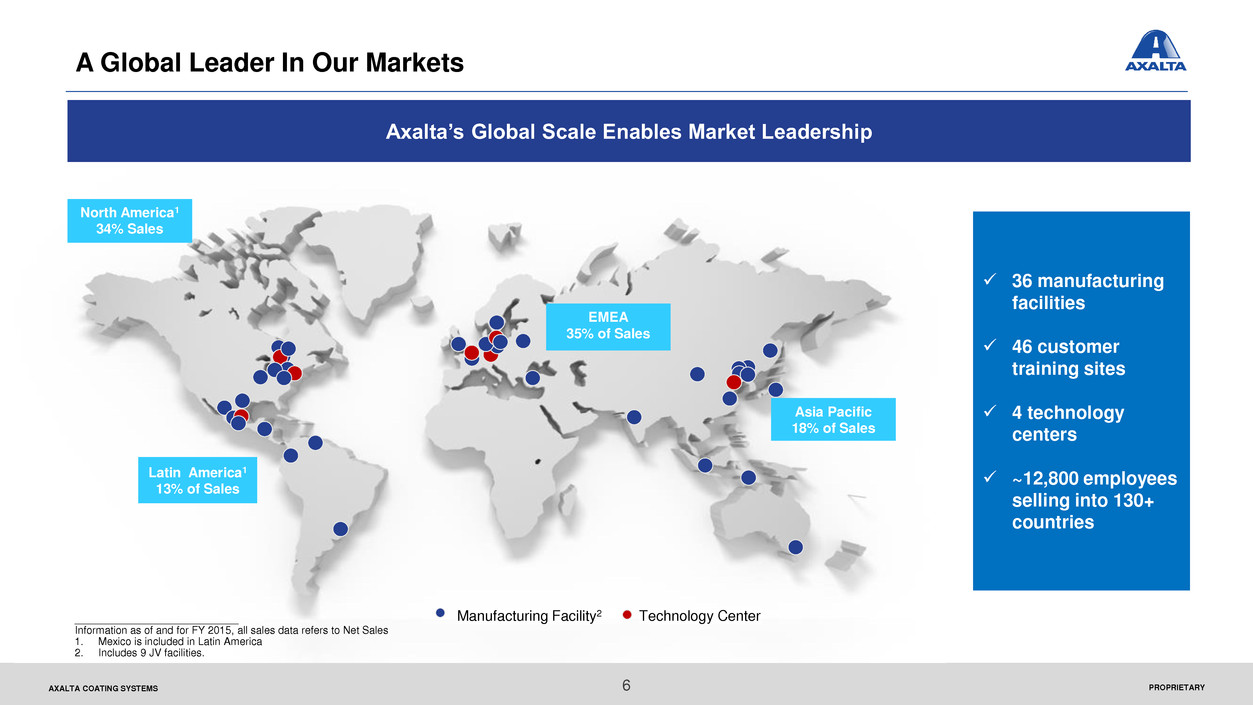
A Global Leader In Our Markets
Axalta’s Global Scale Enables Market Leadership
____________________________
Information as of and for FY 2015, all sales data refers to Net Sales
1. Mexico is included in Latin America
2. Includes 9 JV facilities.
36 manufacturing
facilities
46 customer
training sites
4 technology
centers
~12,800 employees
selling into 130+
countries
North America1
34% Sales
Latin America1
13% of Sales
Asia Pacific
18% of Sales
EMEA
35% of Sales
Manufacturing Facility2 Technology Center
PROPRIETARYAXALTA COATING SYSTEMS
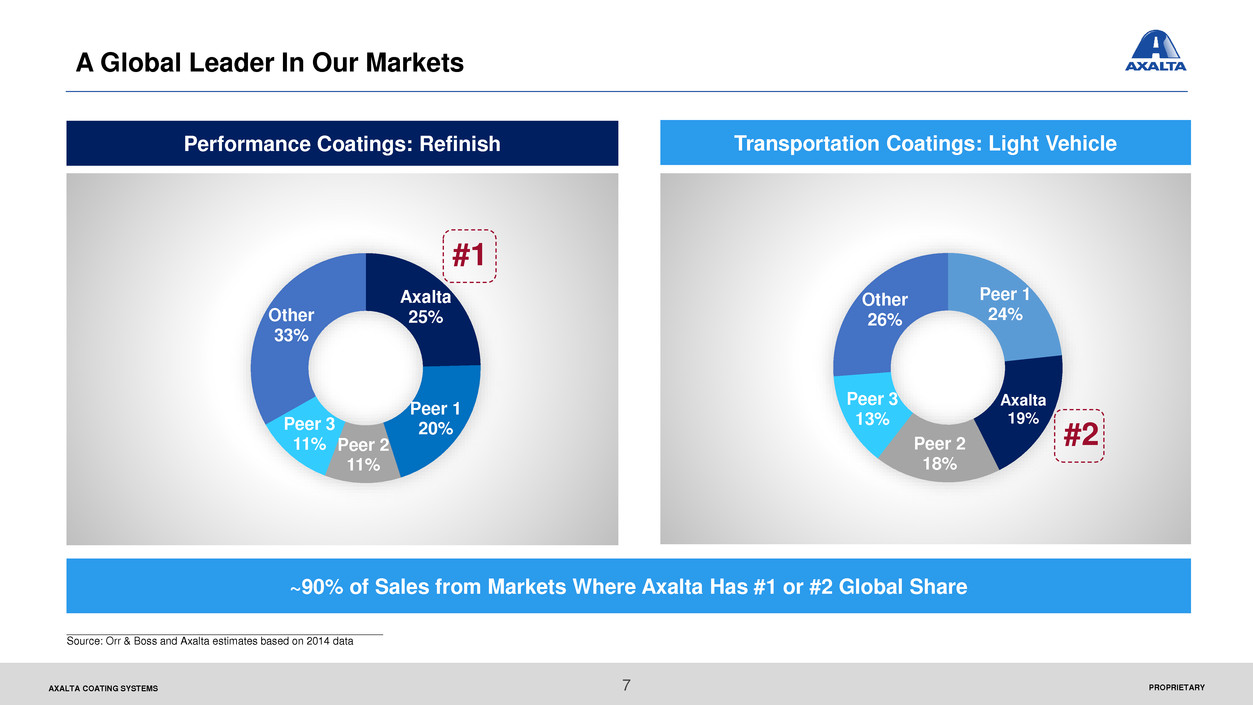
Peer 1
24%
Axalta
19%
Peer 2
18%
Peer 3
13%
Other
26%
7
A Global Leader In Our Markets
~90% of Sales from Markets Where Axalta Has #1 or #2 Global Share
Axalta
25%
Peer 1
20%
Peer 2
11%
Peer 3
11%
Other
33%
Performance Coatings: Refinish Transportation Coatings: Light Vehicle
#1
______________________________________________________
Source: Orr & Boss and Axalta estimates based on 2014 data
#2
PROPRIETARYAXALTA COATING SYSTEMS 8
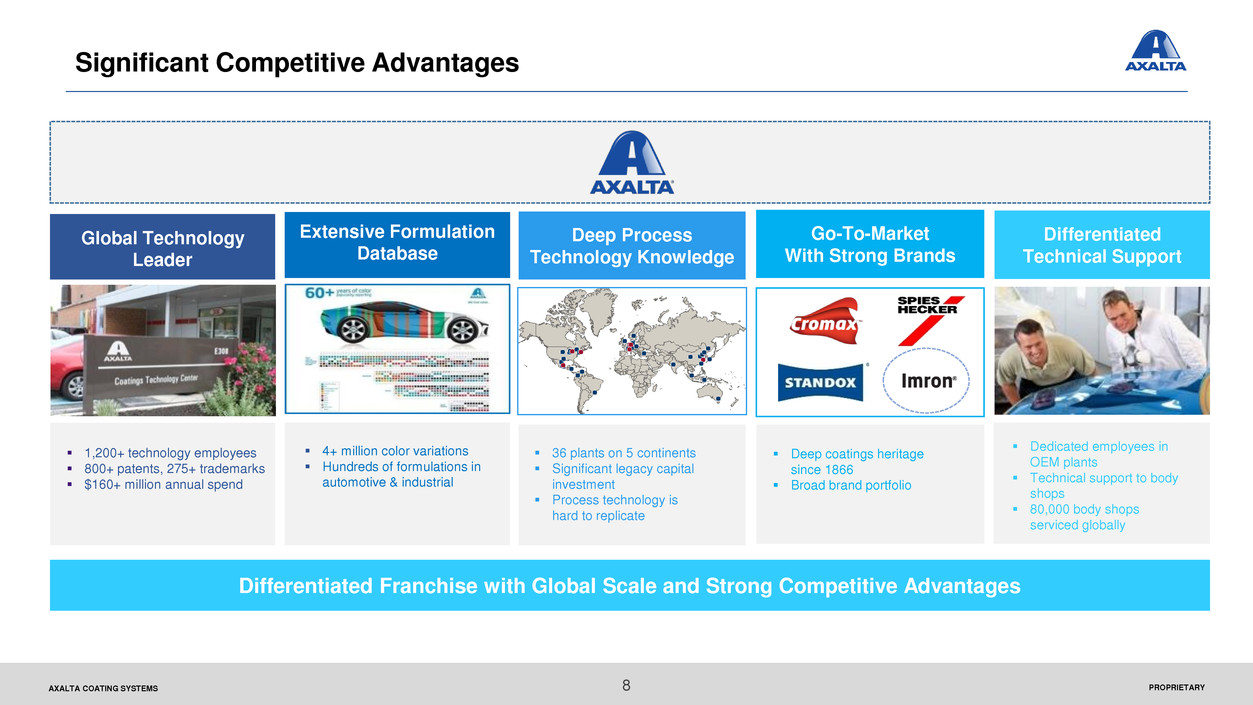
Significant Competitive Advantages
Differentiated Franchise with Global Scale and Strong Competitive Advantages
4+ million color variations
Hundreds of formulations in
automotive & industrial
Deep coatings heritage
since 1866
Broad brand portfolio
1,200+ technology employees
800+ patents, 275+ trademarks
$160+ million annual spend
36 plants on 5 continents
Significant legacy capital
investment
Process technology is
hard to replicate
Dedicated employees in
OEM plants
Technical support to body
shops
80,000 body shops
serviced globally
Global Technology
Leader
Extensive Formulation
Database
Deep Process
Technology Knowledge
Go-To-Market
With Strong Brands
Differentiated
Technical Support
PROPRIETARYAXALTA COATING SYSTEMS
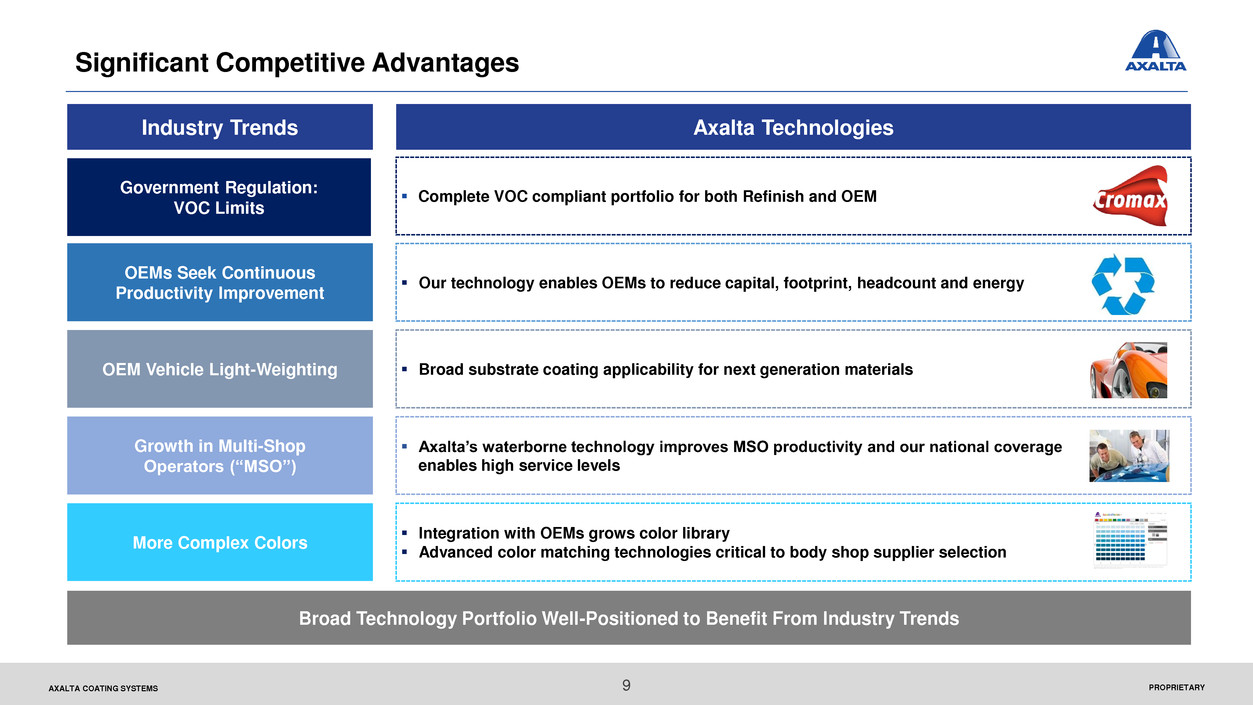
Industry Trends Axalta Technologies
OEM Vehicle Light-Weighting Broad substrate coating applicability for next generation materials
Growth in Multi-Shop
Operators (“MSO”)
Axalta’s waterborne technology improves MSO productivity and our national coverage
enables high service levels
9
Significant Competitive Advantages
More Complex Colors
Integration with OEMs grows color library
Advanced color matching technologies critical to body shop supplier selection
Our technology enables OEMs to reduce capital, footprint, headcount and energy
OEMs Seek Continuous
Productivity Improvement
Government Regulation:
VOC Limits
Complete VOC compliant portfolio for both Refinish and OEM
Broad Technology Portfolio Well-Positioned to Benefit From Industry Trends
PROPRIETARYAXALTA COATING SYSTEMS 10
Axalta Employs A Service-Led Business Model
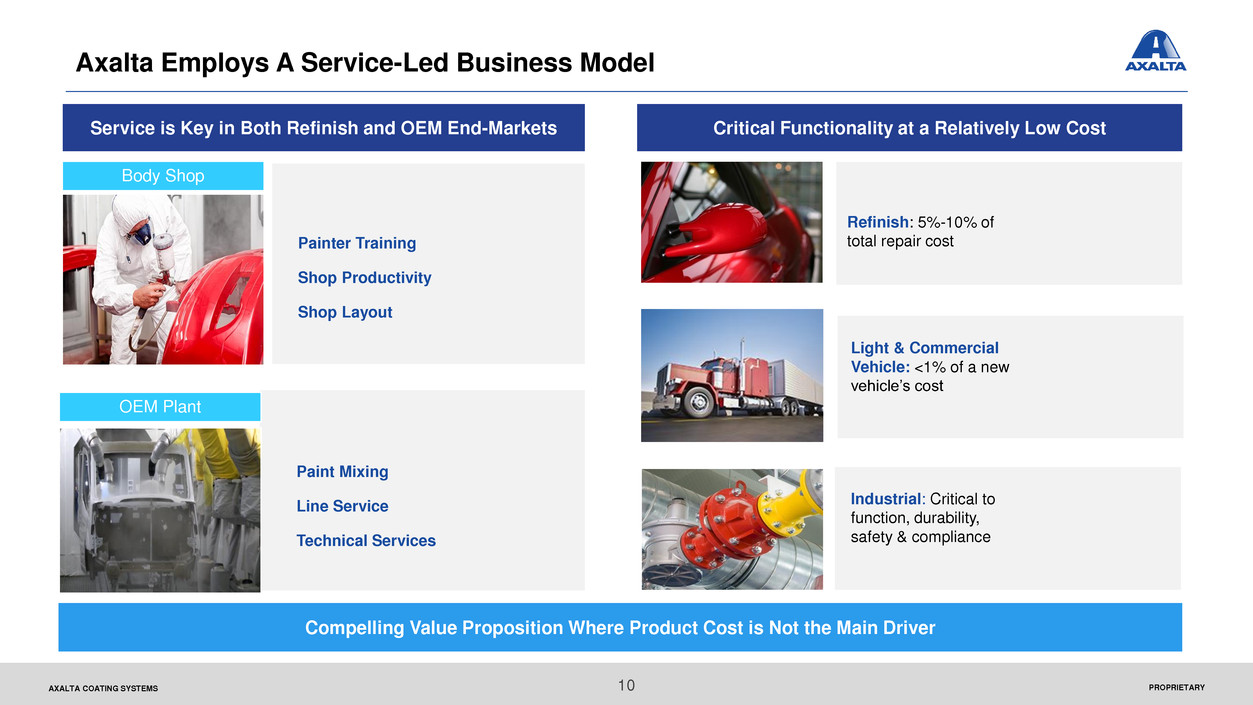
Critical Functionality at a Relatively Low Cost
1
Compelling Value Proposition Where Product Cost is Not the Main Driver
Light & Commercial
Vehicle: <1% of a new
vehicle’s cost
Industrial: Critical to
function, durability,
safety & compliance
Refinish: 5%-10% of
total repair cost
Body Shop
OEM Plant
Service is Key in Both Refinish and OEM End-Markets
Painter Training
Shop Productivity
Shop Layout
Paint Mixing
Line Service
Technical Services
PROPRIETARYAXALTA COATING SYSTEMS 11
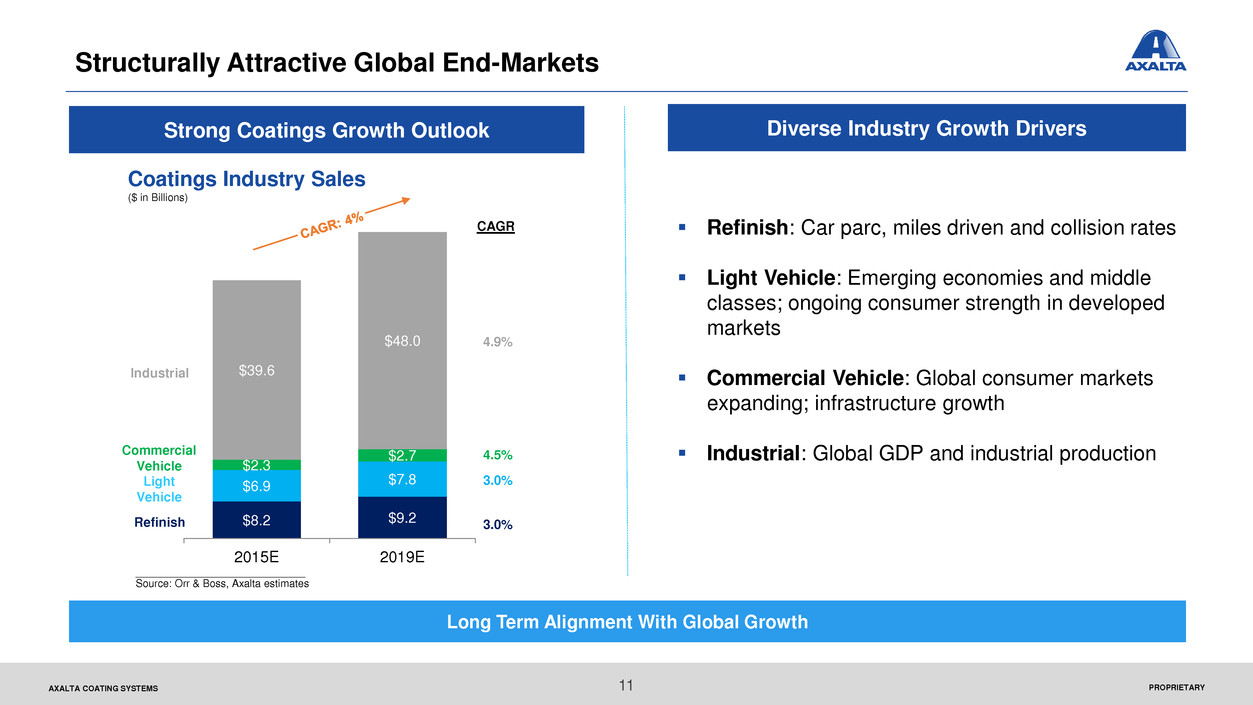
Structurally Attractive Global End-Markets
Strong Coatings Growth Outlook
Long Term Alignment With Global Growth
Refinish: Car parc, miles driven and collision rates
Light Vehicle: Emerging economies and middle
classes; ongoing consumer strength in developed
markets
Commercial Vehicle: Global consumer markets
expanding; infrastructure growth
Industrial: Global GDP and industrial production
Diverse Industry Growth Drivers
Commercial
Vehicle
Light
Vehicle
Refinish
Industrial
4.9%
4.5%
3.0%
3.0%
CAGR
Coatings Industry Sales
($ in Billions)
_____________________________
Source: Orr & Boss, Axalta estimates
$8.2 $9.2
$6.9 $7.8
$2.3
$2.7
$39.6
$48.0
2015E 2019E
PROPRIETARYAXALTA COATING SYSTEMS 12
Highly Variable Cost Structure And Low Capital Intensity
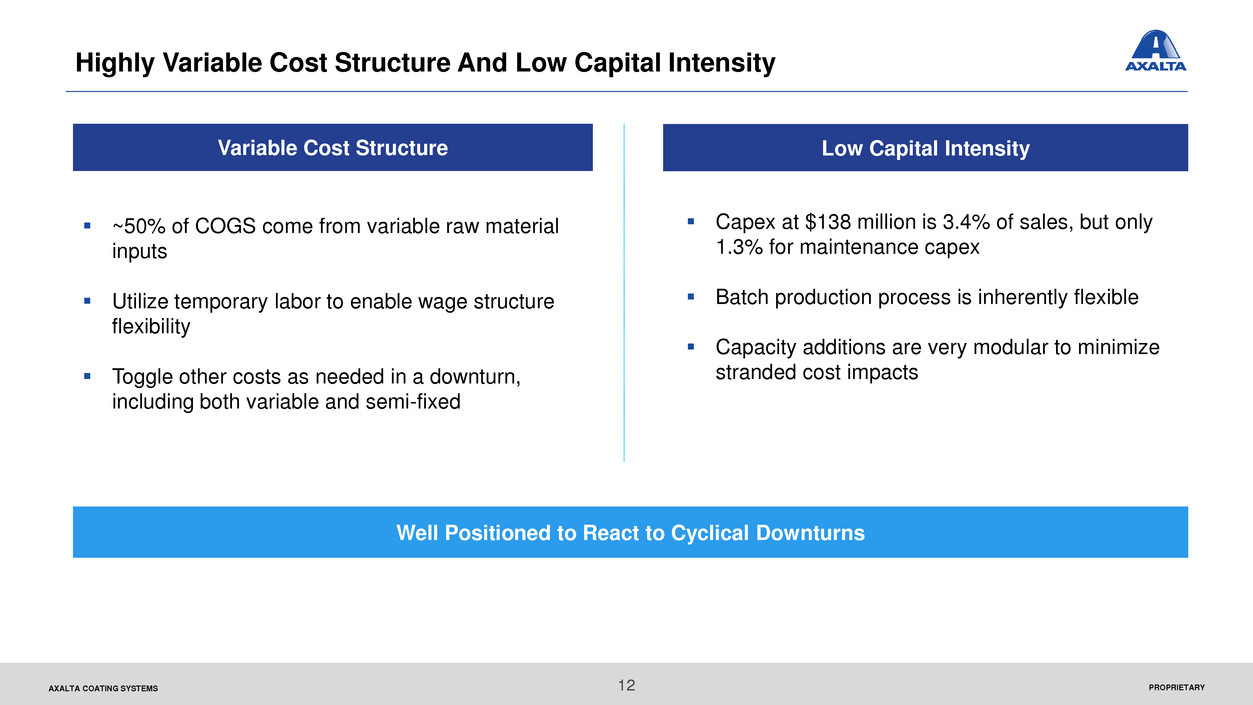
~50% of COGS come from variable raw material
inputs
Utilize temporary labor to enable wage structure
flexibility
Toggle other costs as needed in a downturn,
including both variable and semi-fixed
Low Capital Intensity
Capex at $138 million is 3.4% of sales, but only
1.3% for maintenance capex
Batch production process is inherently flexible
Capacity additions are very modular to minimize
stranded cost impacts
Variable Cost Structure
Well Positioned to React to Cyclical Downturns
PROPRIETARYAXALTA COATING SYSTEMS
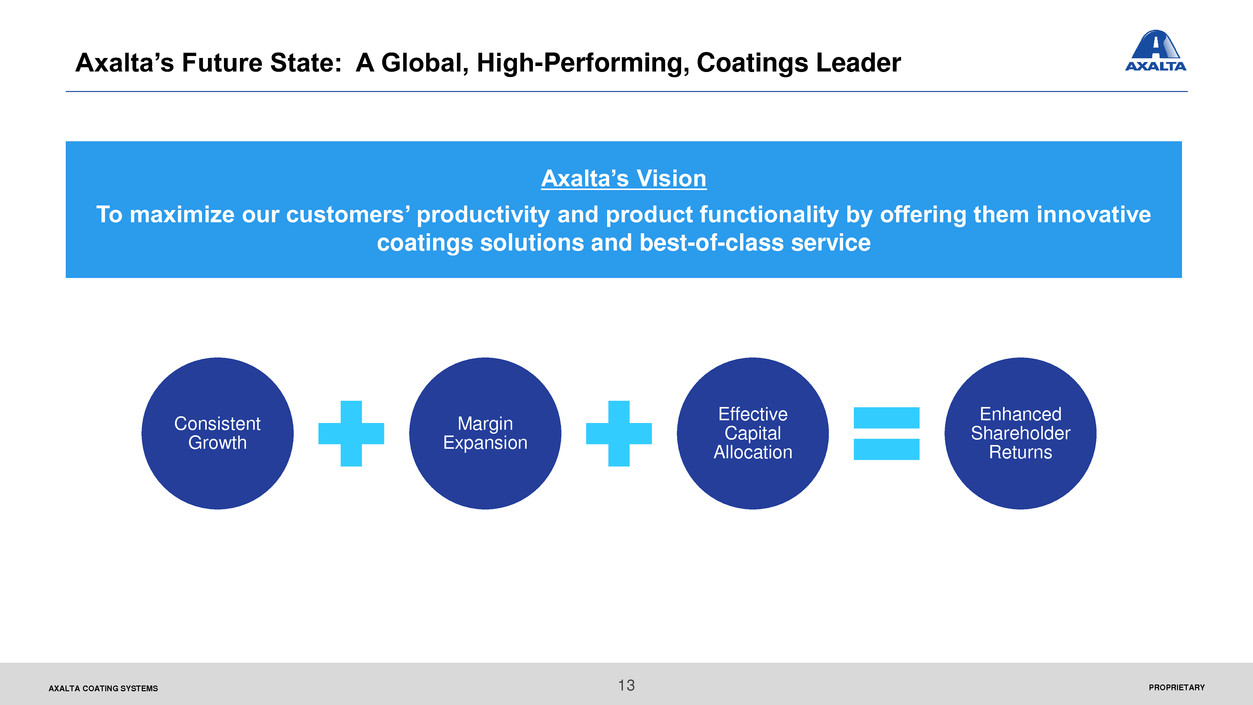
Axalta’s Future State: A Global, High-Performing, Coatings Leader
Consistent
Growth
Margin
Expansion
Effective
Capital
Allocation
Enhanced
Shareholder
Returns
Axalta’s Vision
To maximize our customers’ productivity and product functionality by offering them innovative
coatings solutions and best-of-class service
13
PROPRIETARYAXALTA COATING SYSTEMS 14
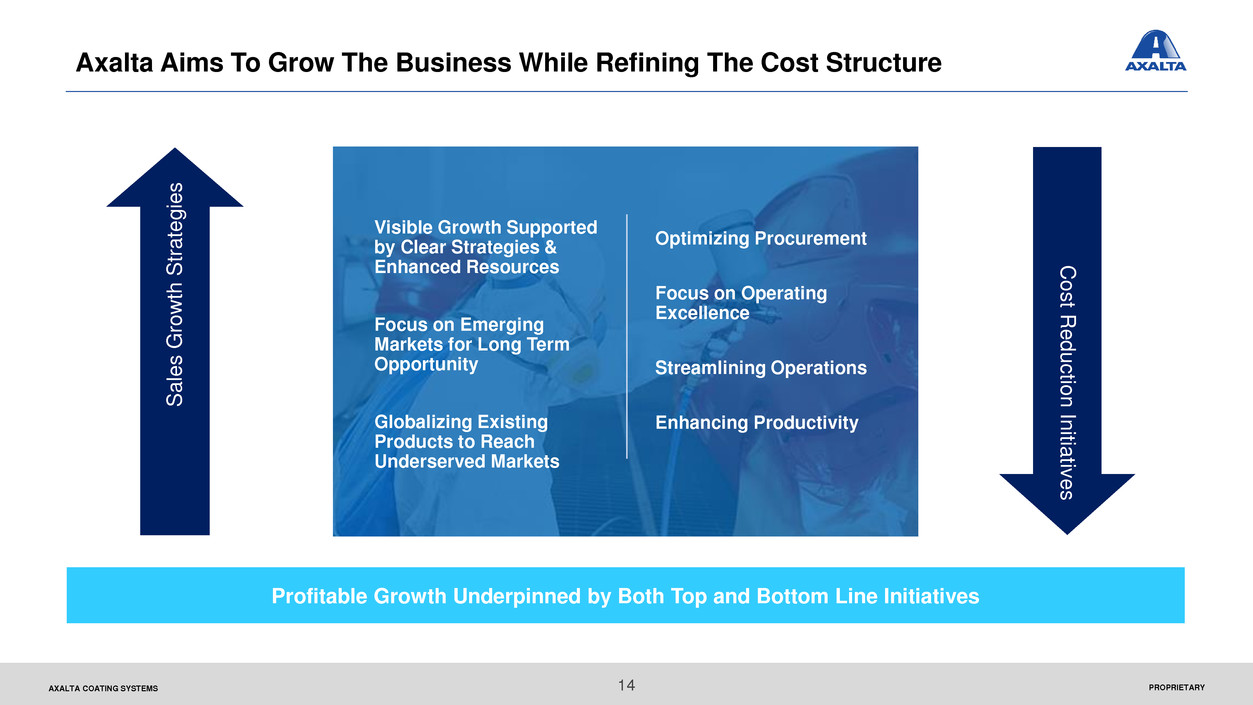
Axalta Aims To Grow The Business While Refining The Cost Structure
Visible Growth Supported
by Clear Strategies &
Enhanced Resources
Focus on Emerging
Markets for Long Term
Opportunity
Globalizing Existing
Products to Reach
Underserved Markets
Optimizing Procurement
Focus on Operating
Excellence
Streamlining Operations
Enhancing Productivity
Sa
le
s
G
ro
w
th
Strateg
ie
s
Co
s
t Redu
c
tion In
itiat
iv
e
s
Profitable Growth Underpinned by Both Top and Bottom Line Initiatives
PROPRIETARYAXALTA COATING SYSTEMS 15
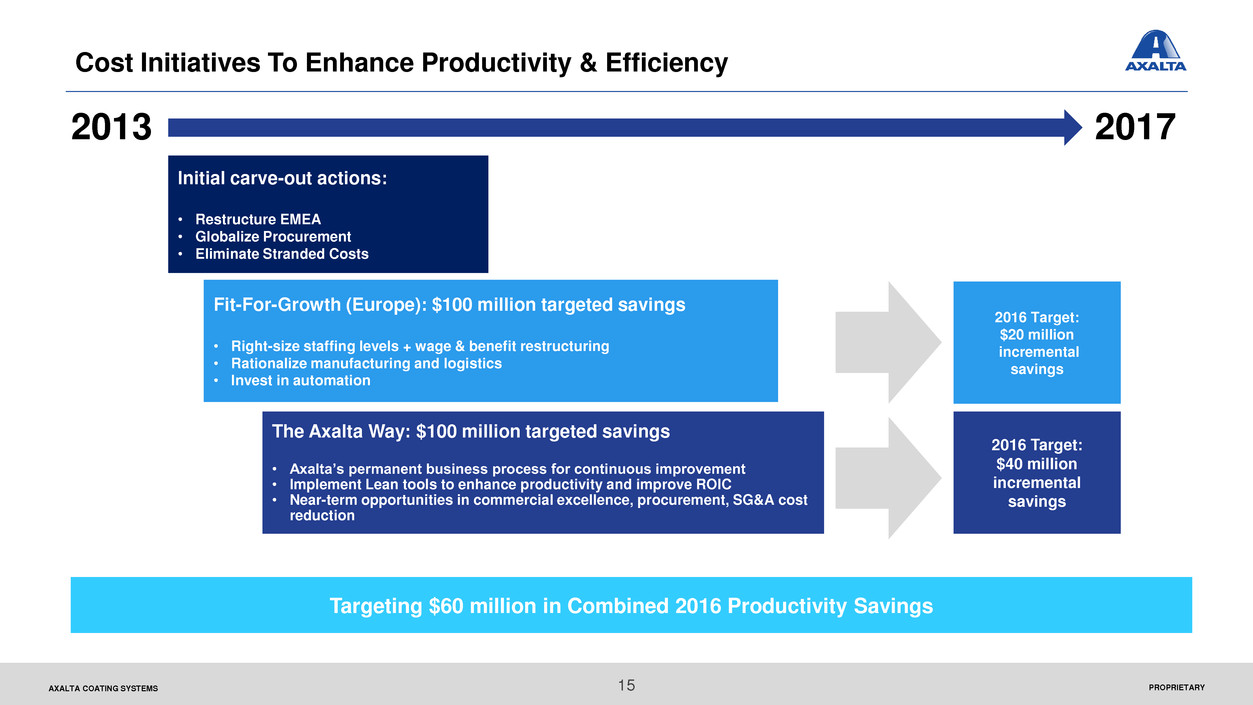
Cost Initiatives To Enhance Productivity & Efficiency
Fit-For-Growth (Europe): $100 million targeted savings
• Right-size staffing levels + wage & benefit restructuring
• Rationalize manufacturing and logistics
• Invest in automation
Initial carve-out actions:
• Restructure EMEA
• Globalize Procurement
• Eliminate Stranded Costs
The Axalta Way: $100 million targeted savings
• Axalta’s permanent business process for continuous improvement
• Implement Lean tools to enhance productivity and improve ROIC
• Near-term opportunities in commercial excellence, procurement, SG&A cost
reduction
2013 2017
2016 Target:
$40 million
incremental
savings
2016 Target:
$20 million
incremental
savings
Targeting $60 million in Combined 2016 Productivity Savings
PROPRIETARYAXALTA COATING SYSTEMS 16
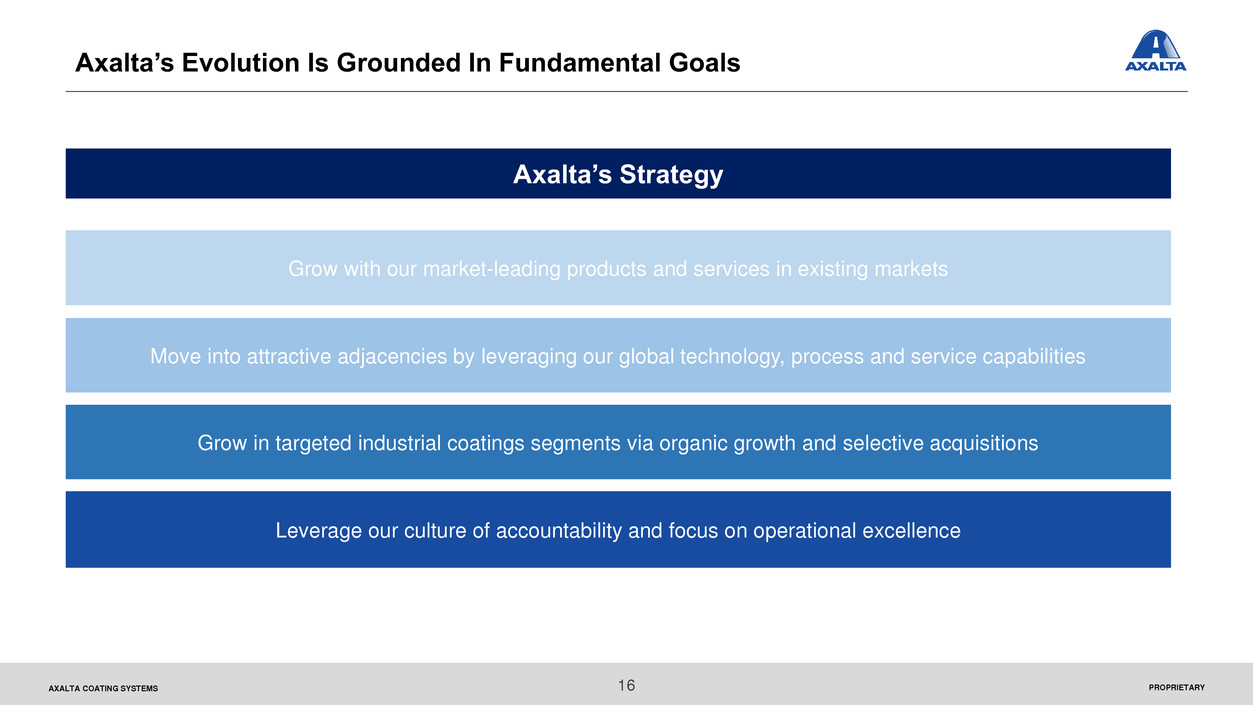
Axalta’s Evolution Is Grounded In Fundamental Goals
Leverage our culture of accountability and focus on operational excellence
Axalta’s Strategy
Grow in targeted industrial coatings segments via organic growth and selective acquisitions
Move into attractive adjacencies by leveraging our global technology, process and service capabilities
Grow with our market-leading products and services in existing markets
PROPRIETARYAXALTA COATING SYSTEMS 17
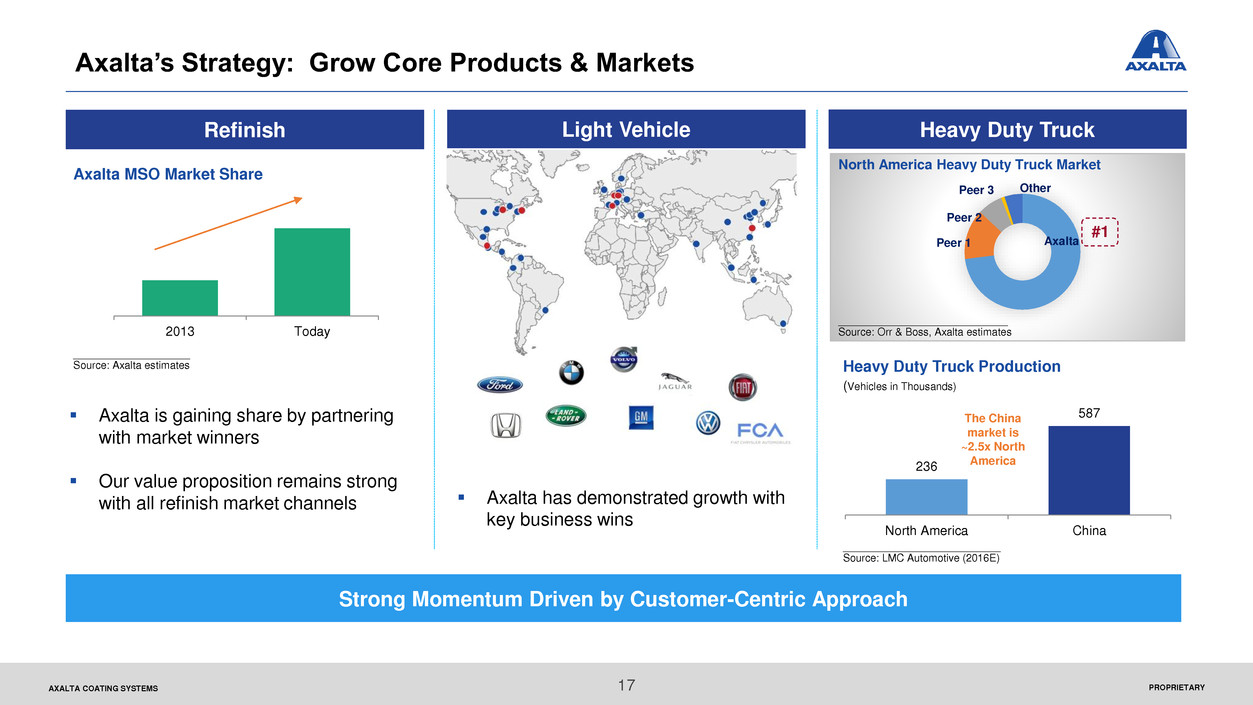
Axalta’s Strategy: Grow Core Products & Markets
Refinish
____________________
Source: Axalta estimates
Strong Momentum Driven by Customer-Centric Approach
Axalta MSO Market Share
2013 Today
Light Vehicle
Axalta is gaining share by partnering
with market winners
Our value proposition remains strong
with all refinish market channels
Heavy Duty Truck
AxaltaPeer 1
Peer 2
Peer 3 Other
#1
North America Heavy Duty Truck Market
(Vehicles in Thousands)
Heavy Duty Truck Production
236
587
North America China
The China
market is
~2.5x North
America
_____________________________
Source: Orr & Boss, Axalta estimates
___________________________
Source: LMC Automotive (2016E)
Axalta has demonstrated growth with
key business wins
PROPRIETARYAXALTA COATING SYSTEMS
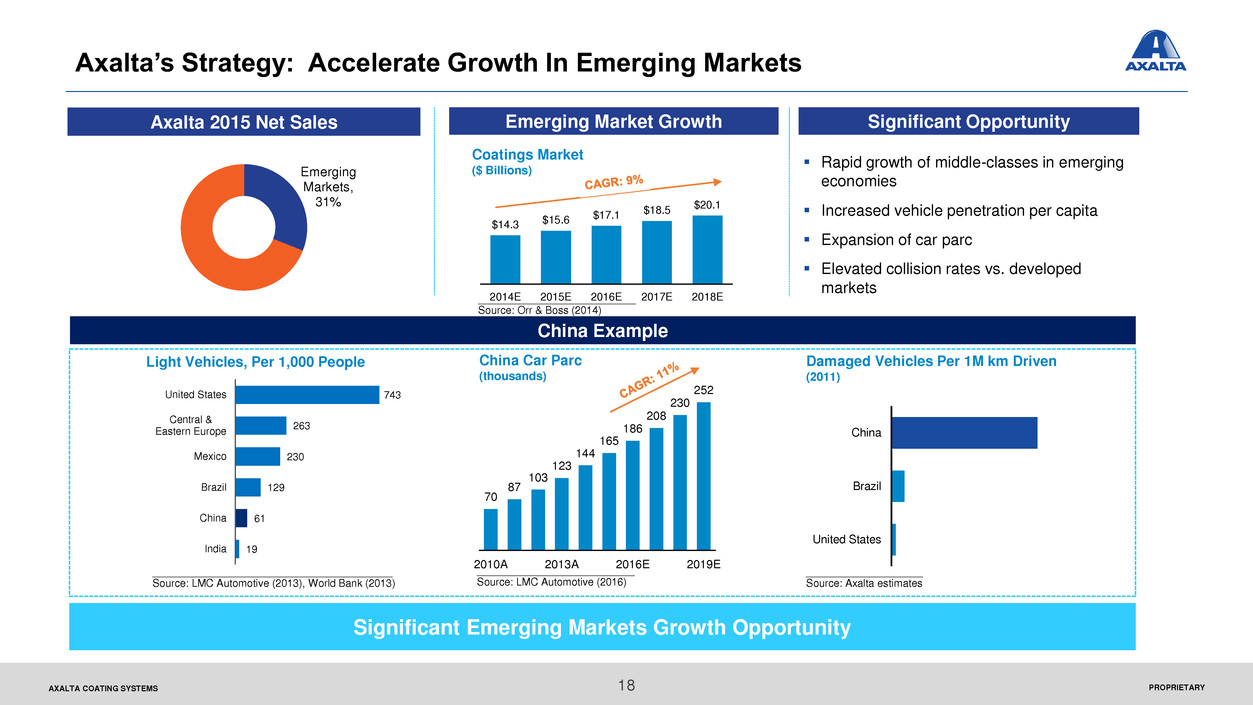
$14.3 $15.6
$17.1 $18.5
$20.1
2014E 2015E 2016E 2017E 2018E
Emerging
Markets,
31%
18
Axalta’s Strategy: Accelerate Growth In Emerging Markets
China Example
Light Vehicles, Per 1,000 People China Car Parc
(thousands)
743
263
230
129
61
19
United States
Central &
Eastern Europe
Mexico
Brazil
China
India
Damaged Vehicles Per 1M km Driven
(2011)
Axalta 2015 Net Sales Emerging Market Growth
Coatings Market
($ Billions)
Significant Emerging Markets Growth Opportunity
Significant Opportunity
Rapid growth of middle-classes in emerging
economies
Increased vehicle penetration per capita
Expansion of car parc
Elevated collision rates vs. developed
markets
United States
Brazil
China___________________________Source: Orr & Boss (2014)
_________________________________________
Source: LMC Automotive (2013), World Bank (2013)
____________________
Source: Axalta estimates
___________________________
Source: LMC Automotive (2016)
70
87
103
123
144
165
186
208
230
252
2010A 2013A 2016E 2019E
PROPRIETARYAXALTA COATING SYSTEMS
Architectural
19
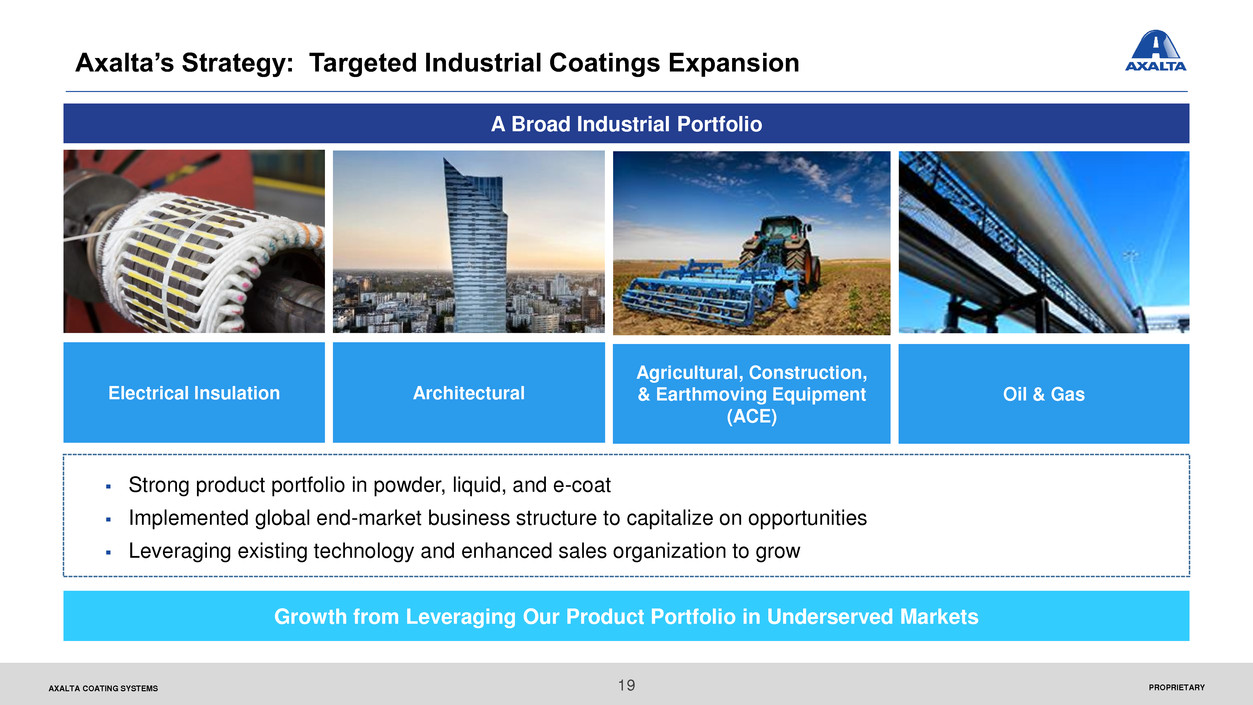
Axalta’s Strategy: Targeted Industrial Coatings Expansion
Growth from Leveraging Our Product Portfolio in Underserved Markets
Strong product portfolio in powder, liquid, and e-coat
Implemented global end-market business structure to capitalize on opportunities
Leveraging existing technology and enhanced sales organization to grow
A Broad Industrial Portfolio
Electrical Insulation
Agricultural, Construction,
& Earthmoving Equipment
(ACE)
Oil & Gas
PROPRIETARYAXALTA COATING SYSTEMS
Axalta’s Strategy: Focus On Operating Excellence
Balanced manufacturing footprint and capacity
Ongoing productivity investments
Salesforce reorganization
R&D / Technology enablers
Enhanced IT tools
Procurement roadmap
Process improvement
Leadership and Culture
The tone is set; focus on growth and profitability
Independence and accountability is freeing…and
infectious
Quality leaders in every region and end-market
Supporting and educating our people
Strive to maintain a strong core talent base
Continue to refine and add talent deeper in the
organization
Operations
Employees Feel the Effect of Our Focus and Accountability
20

Financial Overview
PROPRIETARYAXALTA COATING SYSTEMS 22
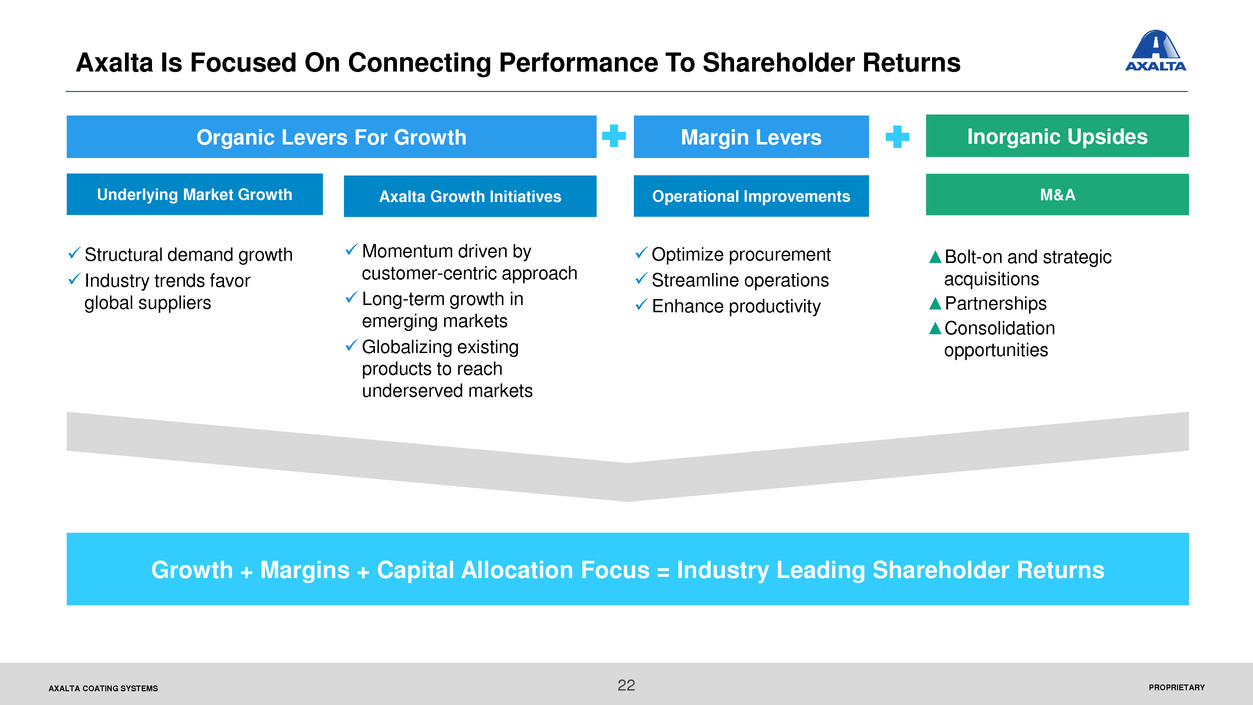
Axalta Is Focused On Connecting Performance To Shareholder Returns
Underlying Market Growth Axalta Growth Initiatives Operational Improvements M&A
Structural demand growth
Industry trends favor
global suppliers
Momentum driven by
customer-centric approach
Long-term growth in
emerging markets
Globalizing existing
products to reach
underserved markets
Optimize procurement
Streamline operations
Enhance productivity
▲Bolt-on and strategic
acquisitions
▲Partnerships
▲Consolidation
opportunities
Organic Levers For Growth Inorganic UpsidesMargin Levers
Growth + Margins + Capital Allocation Focus = Industry Leading Shareholder Returns
PROPRIETARYAXALTA COATING SYSTEMS
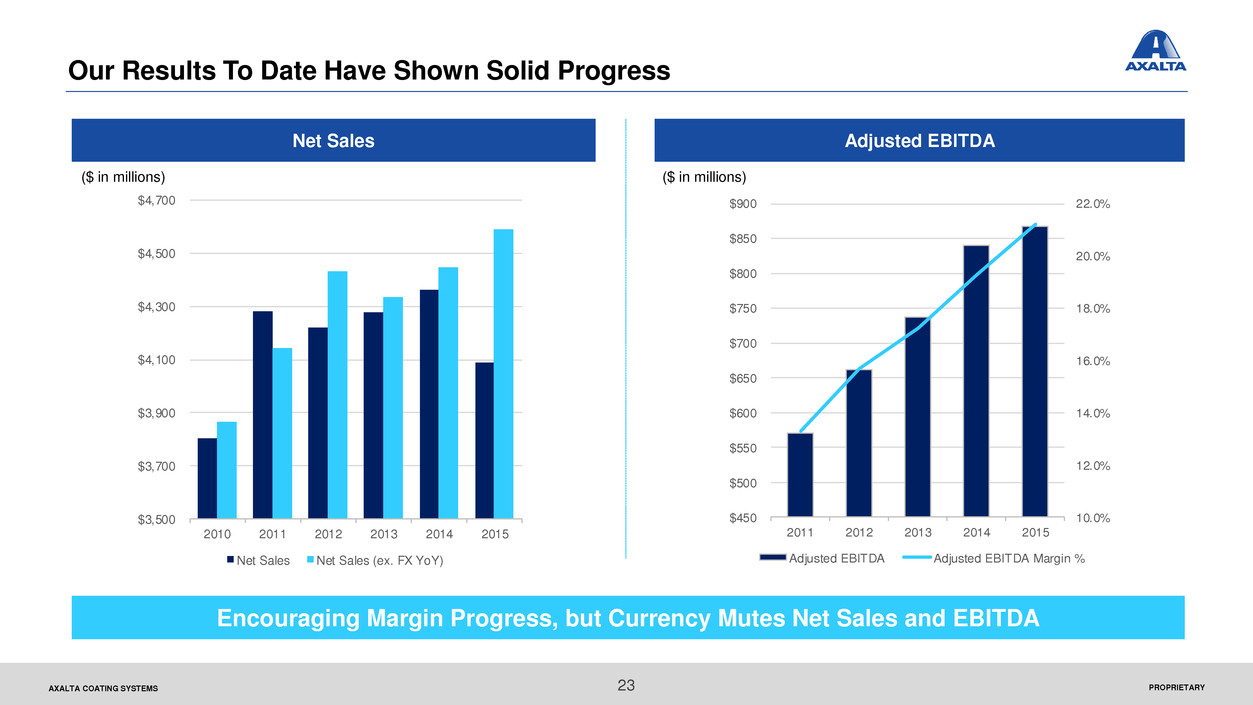
Our Results To Date Have Shown Solid Progress
Encouraging Margin Progress, but Currency Mutes Net Sales and EBITDA
Net Sales Adjusted EBITDA
($ in millions) ($ in millions)
23
$3,500
$3,700
$3,900
$4,100
$4,300
$4,500
$4,700
2010 2011 2012 2013 2014 2015
Net Sales Net Sales (ex. FX YoY)
10.0%
12.0%
14.0%
16.0%
18.0%
20.0%
22.0%
$450
$500
$550
$600
$650
$700
$750
$800
$850
$900
011 2012 2013 2014 2015
Adju ted EBITDA Adjusted EBITDA Margin %
AXALTA COATING SYSTEMS
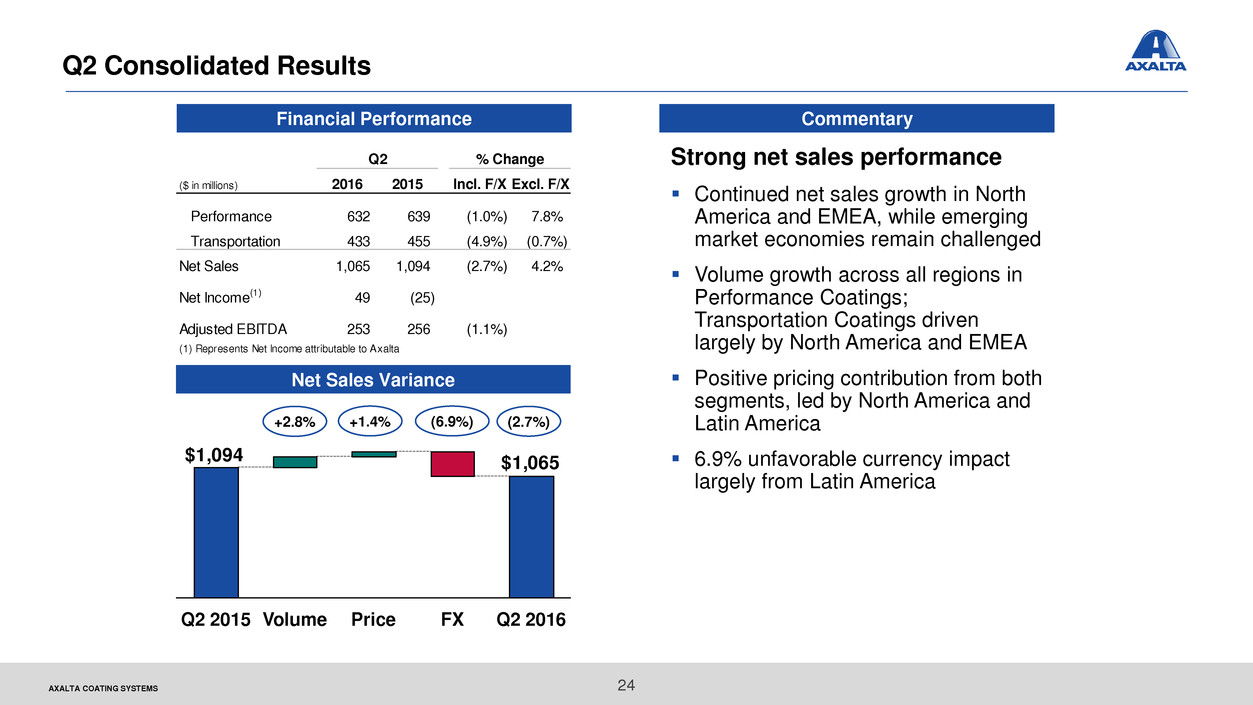
Q2 Consolidated Results
Financial Performance Commentary
24
Strong net sales performance
Continued net sales growth in North
America and EMEA, while emerging
market economies remain challenged
Volume growth across all regions in
Performance Coatings;
Transportation Coatings driven
largely by North America and EMEA
Positive pricing contribution from both
segments, led by North America and
Latin America
6.9% unfavorable currency impact
largely from Latin America
($ in millions) 2016 2015 Incl. F/X Excl. F/X
Performance 632 639 (1.0%) 7.8%
Transportation 433 455 (4.9%) (0.7%)
Net Sales 1,065 1,094 (2.7%) 4.2%
Net Income(1) 49 (25)
Adjusted EBITDA 253 256 (1.1%)
(1) Represents Net Income attributable to xalta
Q2 % Change
+2.8% +1.4% (6.9%) (2.7%)
$1,065 $1,094
Q2 2016FXVolume PriceQ2 2015
Net Sales Variance
PROPRIETARYAXALTA COATING SYSTEMS
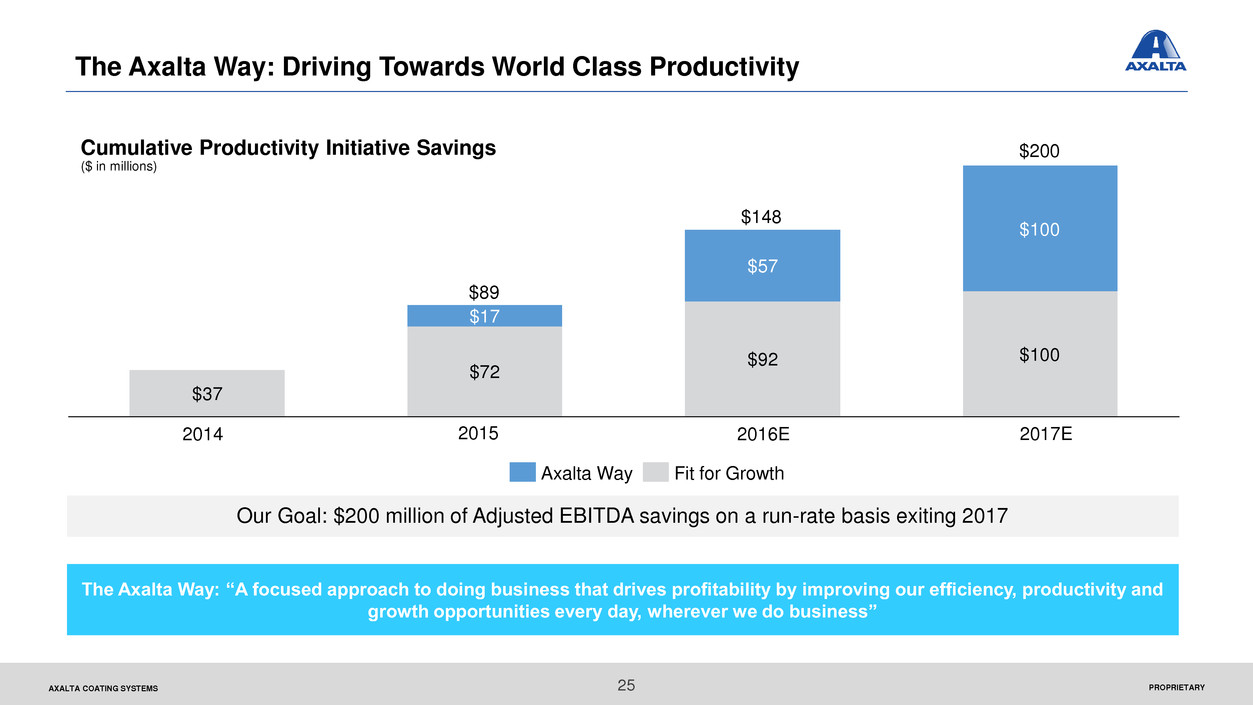
The Axalta Way: Driving Towards World Class Productivity
Our Goal: $200 million of Adjusted EBITDA savings on a run-rate basis exiting 2017
Cumulative Productivity Initiative Savings
($ in millions)
The Axalta Way: “A focused approach to doing business that drives profitability by improving our efficiency, productivity and
growth opportunities every day, wherever we do business”
25
2017E2015 2016E2014
Fit for GrowthAxalta Way
$37
$72
$92 $100
$57
$100
$17
$89
$200
$148
PROPRIETARYAXALTA COATING SYSTEMS 26
Our Financial Guiding Principles
Managing the Capital:
Capex Prioritization
Metrics-Based
Management: Driving the
Business with Data
Capital Allocation:
Improved ROIC
Financial Optimization
PROPRIETARYAXALTA COATING SYSTEMS
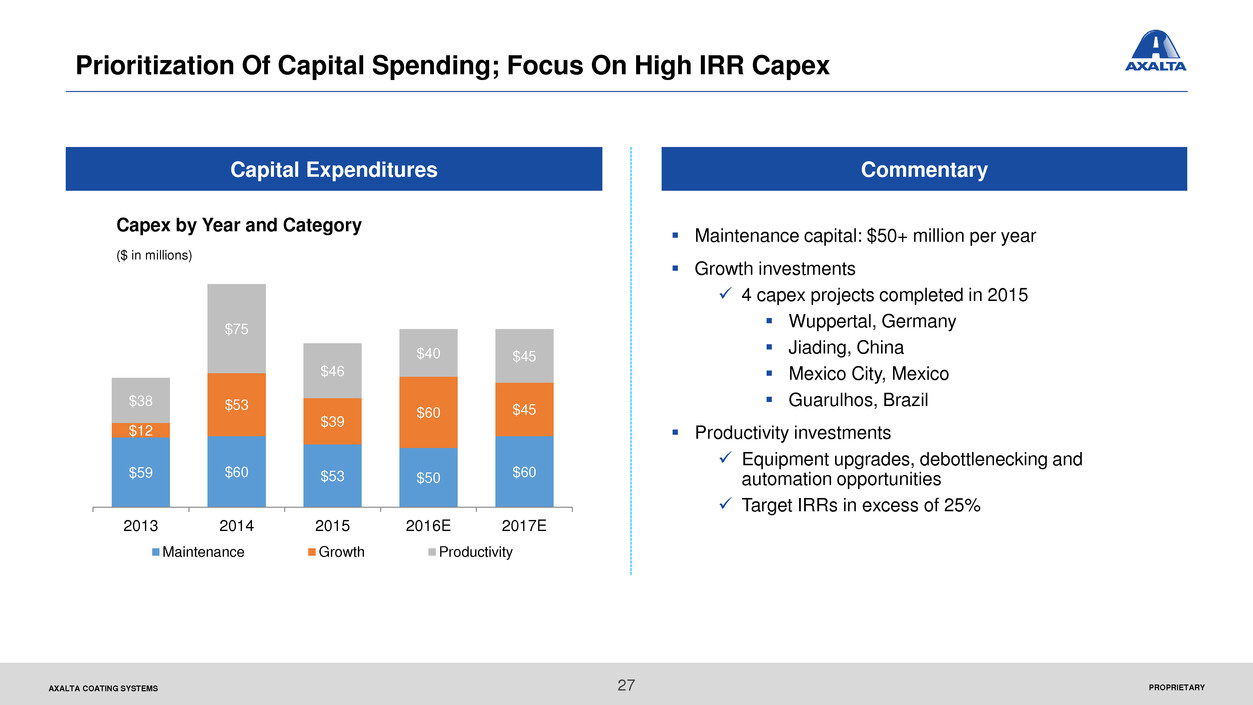
Prioritization Of Capital Spending; Focus On High IRR Capex
Maintenance capital: $50+ million per year
Growth investments
4 capex projects completed in 2015
Wuppertal, Germany
Jiading, China
Mexico City, Mexico
Guarulhos, Brazil
Productivity investments
Equipment upgrades, debottlenecking and
automation opportunities
Target IRRs in excess of 25%
Capital Expenditures
Capex by Year and Category
($ in millions)
Commentary
27
$59 $60 $53 $50 $60
$12
$53
$39
$60 $45
$38
$75
$46
$40 $45
2013 2014 2015 2016E 2017E
Maintenance Growth Productivity
PROPRIETARYAXALTA COATING SYSTEMS
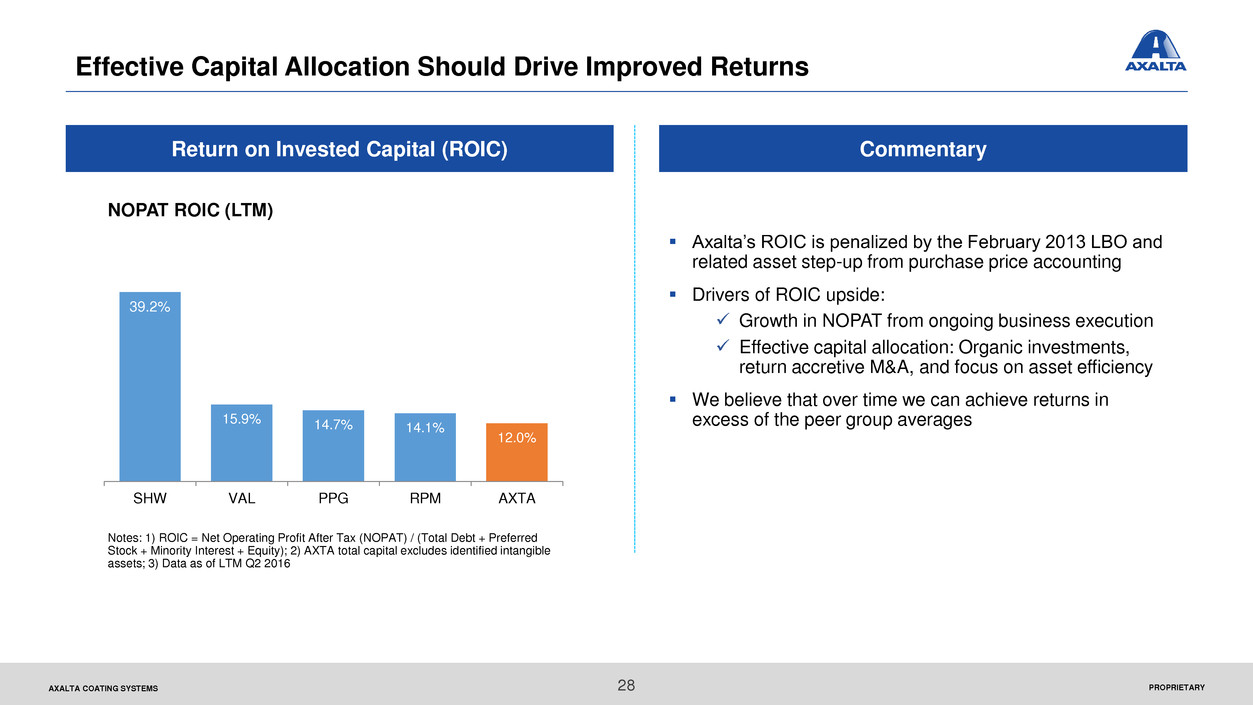
Effective Capital Allocation Should Drive Improved Returns
Notes: 1) ROIC = Net Operating Profit After Tax (NOPAT) / (Total Debt + Preferred
Stock + Minority Interest + Equity); 2) AXTA total capital excludes identified intangible
assets; 3) Data as of LTM Q2 2016
Axalta’s ROIC is penalized by the February 2013 LBO and
related asset step-up from purchase price accounting
Drivers of ROIC upside:
Growth in NOPAT from ongoing business execution
Effective capital allocation: Organic investments,
return accretive M&A, and focus on asset efficiency
We believe that over time we can achieve returns in
excess of the peer group averages
Return on Invested Capital (ROIC) Commentary
NOPAT ROIC (LTM)
28
39.2%
15.9% 14.7% 14.1%
12.0%
SHW VAL PPG RPM AXTA
PROPRIETARYAXALTA COATING SYSTEMS
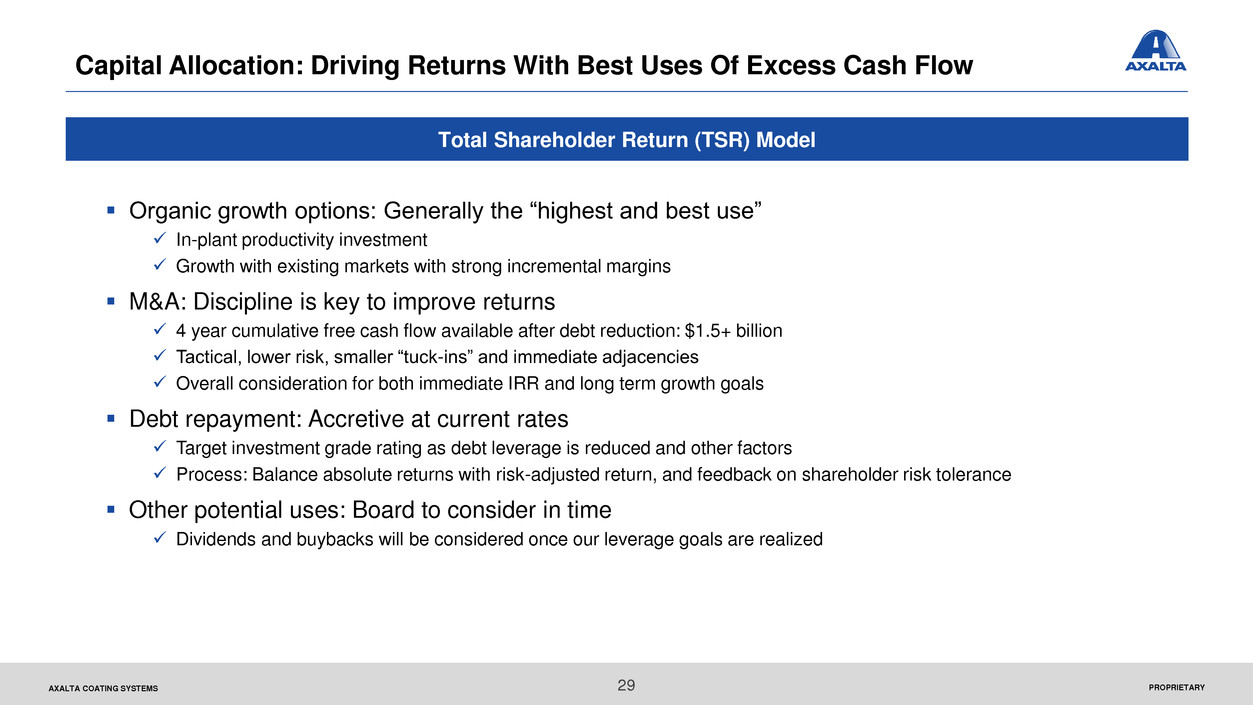
Capital Allocation: Driving Returns With Best Uses Of Excess Cash Flow
Organic growth options: Generally the “highest and best use”
In-plant productivity investment
Growth with existing markets with strong incremental margins
M&A: Discipline is key to improve returns
4 year cumulative free cash flow available after debt reduction: $1.5+ billion
Tactical, lower risk, smaller “tuck-ins” and immediate adjacencies
Overall consideration for both immediate IRR and long term growth goals
Debt repayment: Accretive at current rates
Target investment grade rating as debt leverage is reduced and other factors
Process: Balance absolute returns with risk-adjusted return, and feedback on shareholder risk tolerance
Other potential uses: Board to consider in time
Dividends and buybacks will be considered once our leverage goals are realized
Total Shareholder Return (TSR) Model
29
PROPRIETARYAXALTA COATING SYSTEMS
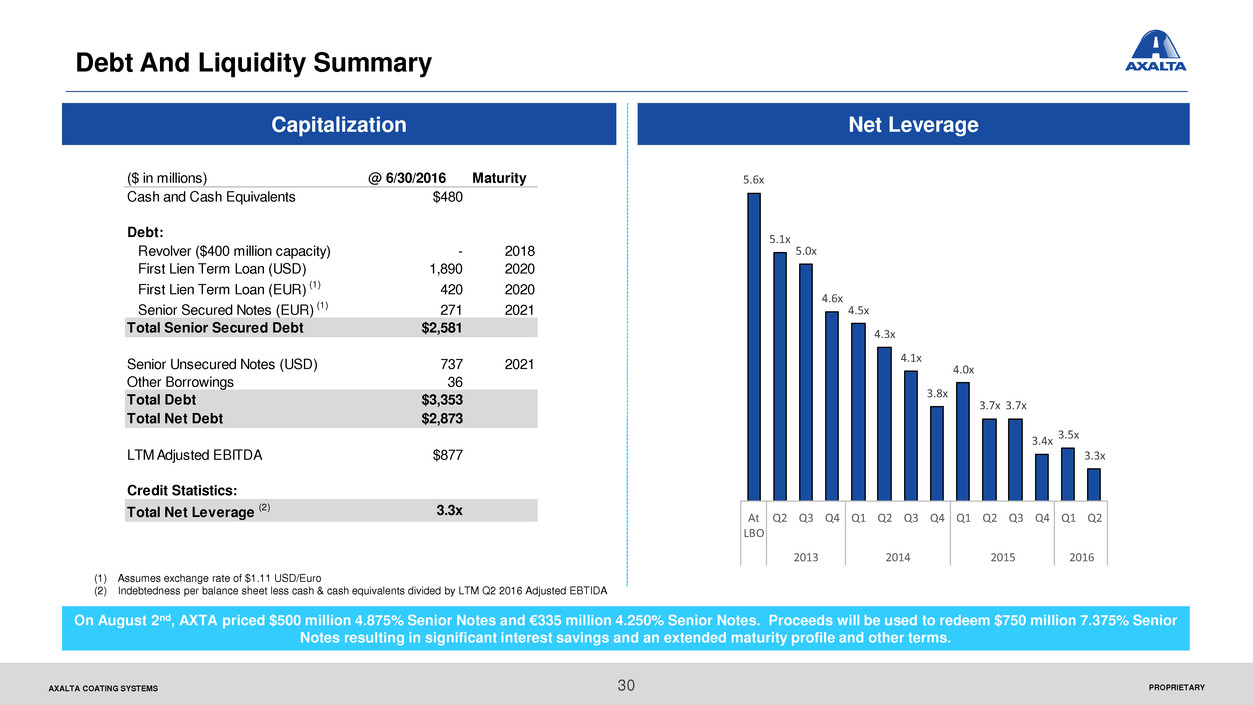
Capitalization
30
Debt And Liquidity Summary
Net Leverage
(1) Assumes exchange rate of $1.11 USD/Euro
(2) Indebtedness per balance sheet less cash & cash equivalents divided by LTM Q2 2016 Adjusted EBTIDA
($ in millions) @ 6/30/2016 Maturity
Cash and Cash Equivalents $480
Debt:
Revolver ($400 million capacity) - 2018
First Lien Term Loan (USD) 1,890 2020
First Lien Term Loan (EUR) (1) 420 2020
Senior Secured Notes (EUR) (1) 271 2021
Total Senior Secured Debt $2,581
Senior Unsecured Notes (USD) 737 2021
Other Borrowings 36
Total Debt $3,353
Total Net Debt $2,873
LTM Adjusted EBITDA $877
Credit Statistics:
Total Net Leverage (2) 3.3x
5.6x
5.1x
5.0x
4.6x
4.5x
4.3x
4.1x
3.8x
4.0x
3.7x 3.7x
3.4x
3.5x
3.3x
At
LBO
Q2 Q3 Q4 Q1 Q2 Q3 Q4 Q1 Q2 Q3 Q4 Q1 Q2
2013 2014 2015 2016
On August 2nd, AXTA priced $500 million 4.875% Senior Notes and €335 million 4.250% Senior Notes. Proceeds will be used to redeem $750 million 7.375% Senior
Notes resulting in significant interest savings and an extended maturity profile and other terms.
AXALTA COATING SYSTEMS
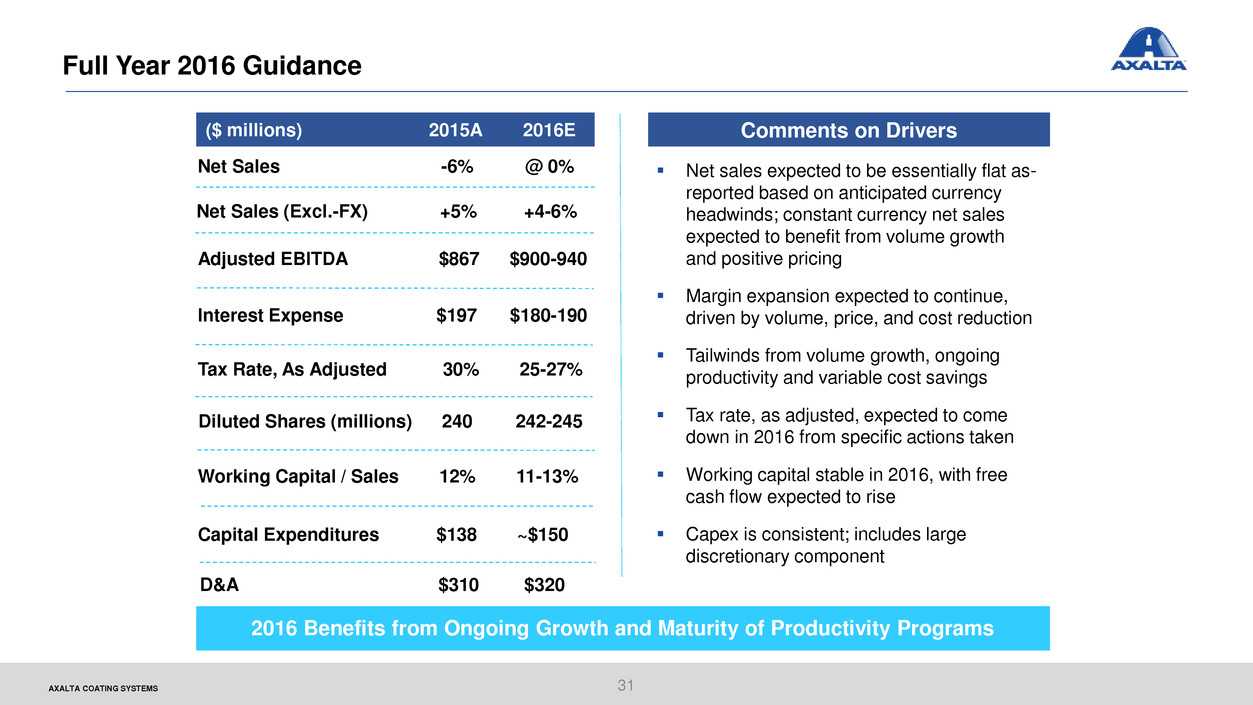
Full Year 2016 Guidance
31
2016 Benefits from Ongoing Growth and Maturity of Productivity Programs
Net sales expected to be essentially flat as-
reported based on anticipated currency
headwinds; constant currency net sales
expected to benefit from volume growth
and positive pricing
Margin expansion expected to continue,
driven by volume, price, and cost reduction
Tailwinds from volume growth, ongoing
productivity and variable cost savings
Tax rate, as adjusted, expected to come
down in 2016 from specific actions taken
Working capital stable in 2016, with free
cash flow expected to rise
Capex is consistent; includes large
discretionary component
($ millions) 2015A 2016E Comments on Drivers
Net Sales (Excl.-FX) +5% +4-6%
Working Capital / Sales 12% 11-13%
Tax Rate, As Adjusted 30% 25-27%
Diluted Shares (millions) 240 242-245
Capital Expenditures $138 ~$150
Interest Expense $197 $180-190
Adjusted EBITDA $867 $900-940
D&A $310 $320
Net Sales -6% @ 0%
Performance Coatings: Refinish
PROPRIETARYAXALTA COATING SYSTEMS
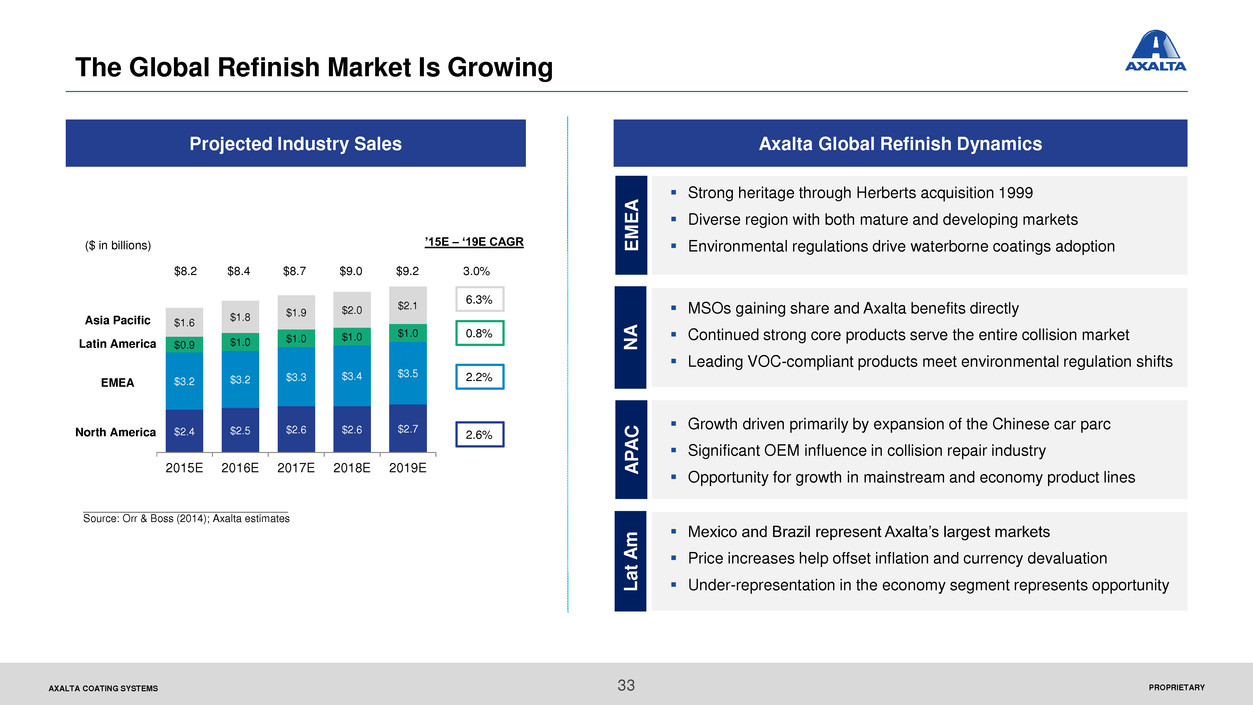
The Global Refinish Market Is Growing
Projected Industry Sales
($ in billions)
Asia Pacific
EMEA
North America
6.3%
0.8%
2.2%
2.6%$2.4 $2.5 $2.6 $2.6
$2.7
$3.2 $3.2 $3.3
$3.4 $3.5
$0.9 $1.0
$1.0 $1.0
$1.0
$1.6
$1.8 $1.9
$2.0 $2.1
2015E 2016E 2017E 2018E 2019E
’15E – ‘19E CAGR
___________________________________
Source: Orr & Boss (2014); Axalta estimates
Latin America
$8.2 $8.4 $8.7 $9.0 $9.2 3.0%
Axalta Global Refinish Dynamics
Strong heritage through Herberts acquisition 1999
Diverse region with both mature and developing markets
Environmental regulations drive waterborne coatings adoption
MSOs gaining share and Axalta benefits directly
Continued strong core products serve the entire collision market
Leading VOC-compliant products meet environmental regulation shifts
Growth driven primarily by expansion of the Chinese car parc
Significant OEM influence in collision repair industry
Opportunity for growth in mainstream and economy product lines
Mexico and Brazil represent Axalta’s largest markets
Price increases help offset inflation and currency devaluation
Under-representation in the economy segment represents opportunity
E
M
E
A
N
A
A
P
A
C
La
t
A
m
33
PROPRIETARYAXALTA COATING SYSTEMS
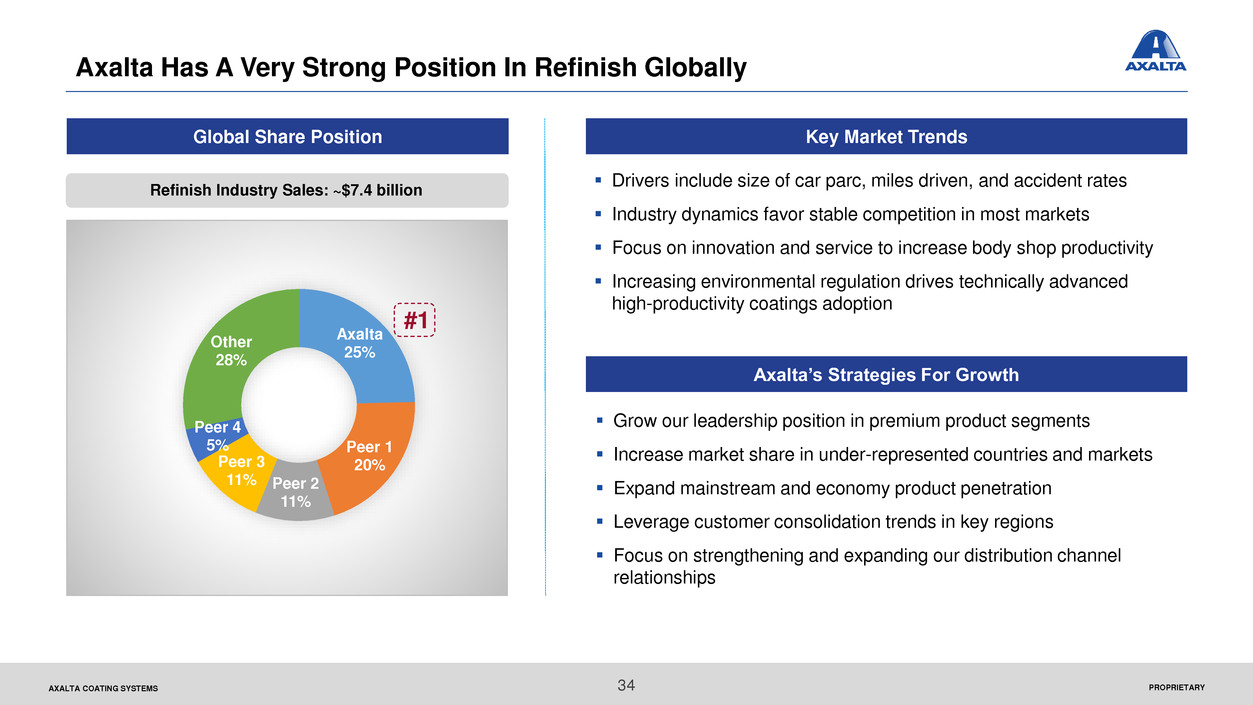
Axalta Has A Very Strong Position In Refinish Globally
Global Share Position Key Market Trends
Axalta
25%
Peer 1
20%
Peer 2
11%
Peer 3
11%
Peer 4
5%
Other
28%
Refinish Industry Sales: ~$7.4 billion
#1
Drivers include size of car parc, miles driven, and accident rates
Industry dynamics favor stable competition in most markets
Focus on innovation and service to increase body shop productivity
Increasing environmental regulation drives technically advanced
high-productivity coatings adoption
Grow our leadership position in premium product segments
Increase market share in under-represented countries and markets
Expand mainstream and economy product penetration
Leverage customer consolidation trends in key regions
Focus on strengthening and expanding our distribution channel
relationships
Axalta’s Strategies For Growth
34
PROPRIETARYAXALTA COATING SYSTEMS 35
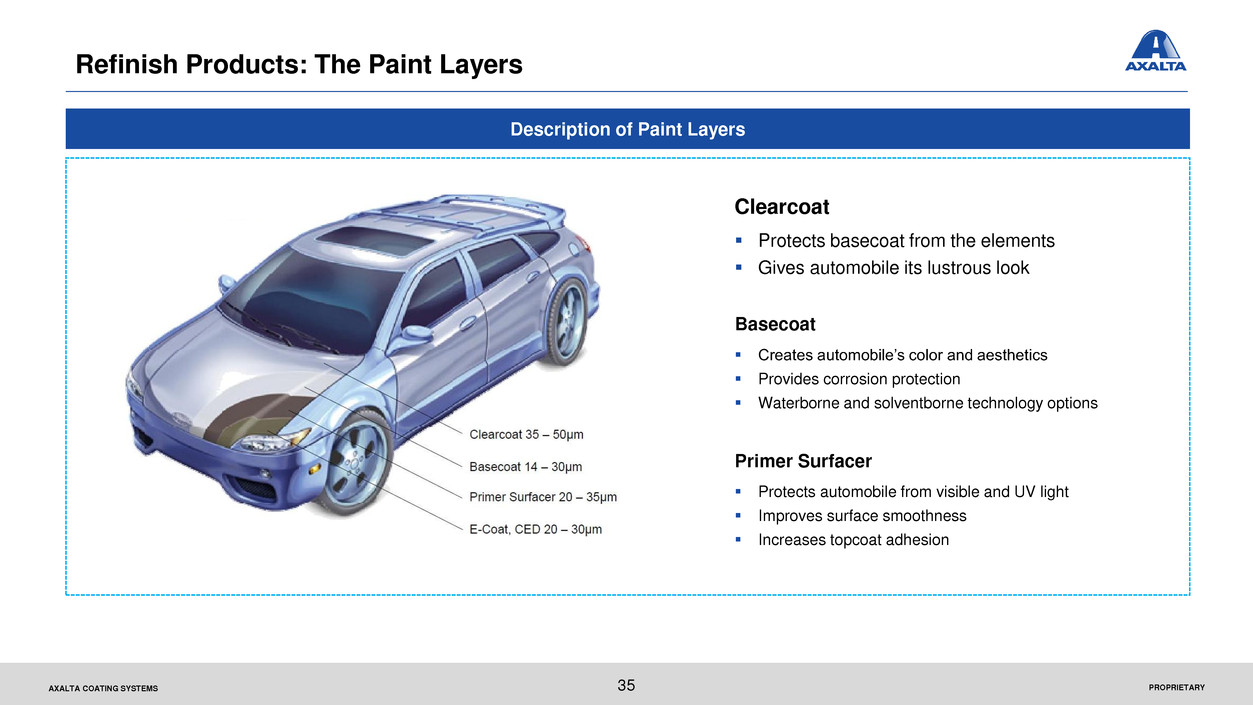
Refinish Products: The Paint Layers
Clearcoat
Protects basecoat from the elements
Gives automobile its lustrous look
Basecoat
Creates automobile’s color and aesthetics
Provides corrosion protection
Waterborne and solventborne technology options
Primer Surfacer
Protects automobile from visible and UV light
Improves surface smoothness
Increases topcoat adhesion
Description of Paint Layers
Performance Coatings: Industrial Coatings
PROPRIETARYAXALTA COATING SYSTEMS
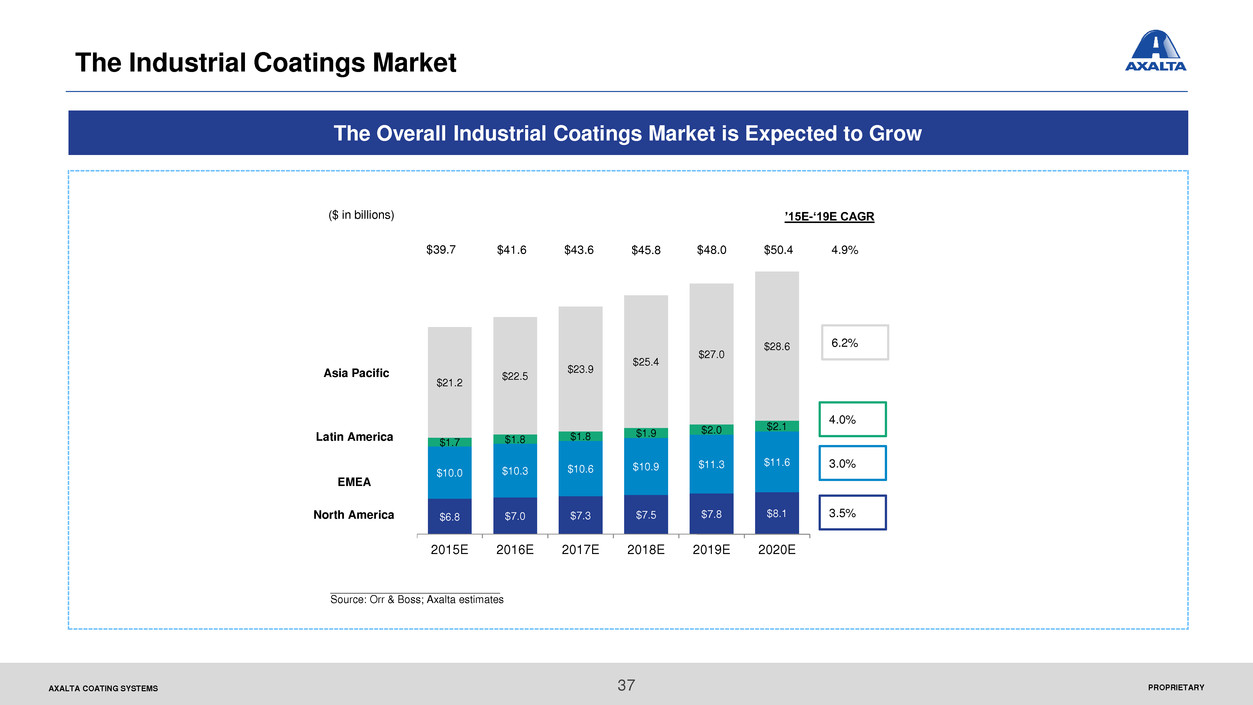
’15E-‘19E CAGR($ in billions)
Asia Pacific
EMEA
North America
6.2%
4.0%
3.0%
3.5%
4.9%
$6.8 $7.0 $7.3 $7.5 $7.8 $8.1
$10.0 $10.3 $10.6
$10.9 $11.3 $11.6
$1.7 $1.8
$1.8 $1.9
$2.0 $2.1
$21.2
$22.5
$23.9
$25.4
$27.0
$28.6
2015E 2016E 2017E 2018E 2019E 2020E
$50.4
_____________________________
Source: Orr & Boss; Axalta estimates
Latin America
$48.0$45.8$43.6$39.7 $41.6
The Overall Industrial Coatings Market is Expected to Grow
The Industrial Coatings Market
37
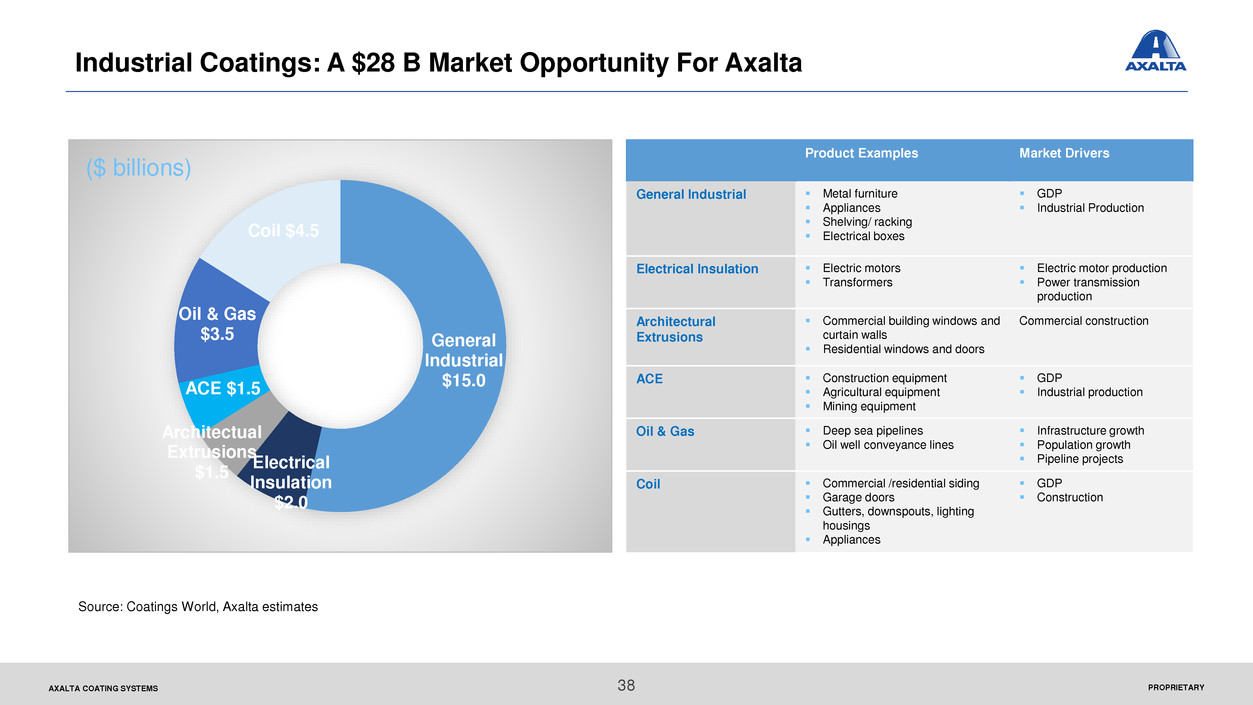
PROPRIETARYAXALTA COATING SYSTEMS
General
Industrial
$15.0
Electrical
Insulation
$2.0
Architectual
Extrusions
$1.5
ACE $1.5
Oil & Gas
$3.5
Coil $4.5
Industrial Coatings: A $28 B Market Opportunity For Axalta
Product Examples Market Drivers
General Industrial Metal furniture
Appliances
Shelving/ racking
Electrical boxes
GDP
Industrial Production
Electrical Insulation Electric motors
Transformers
Electric motor production
Power transmission
production
Architectural
Extrusions
Commercial building windows and
curtain walls
Residential windows and doors
Commercial construction
ACE Construction equipment
Agricultural equipment
Mining equipment
GDP
Industrial production
Oil & Gas Deep sea pipelines
Oil well conveyance lines
Infrastructure growth
Population growth
Pipeline projects
Coil Commercial /residential siding
Garage doors
Gutters, downspouts, lighting
housings
Appliances
GDP
Construction
Source: Coatings World, Axalta estimates
($ billions)
38
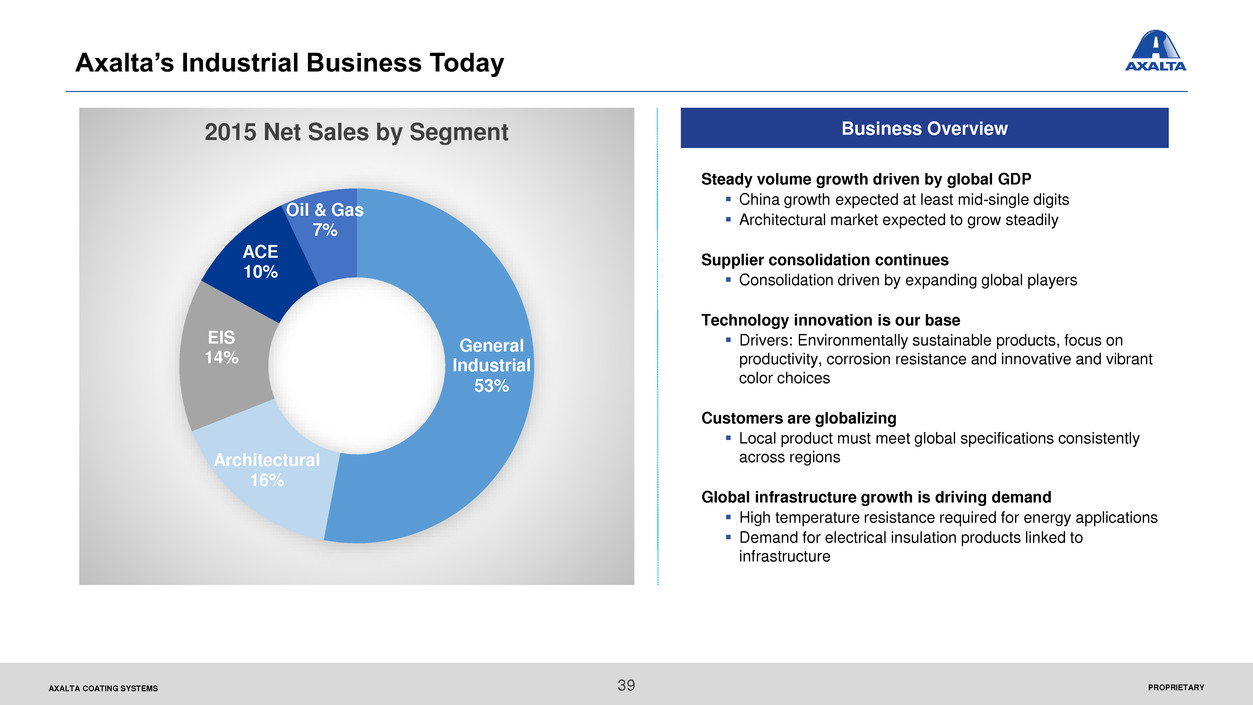
PROPRIETARYAXALTA COATING SYSTEMS
General
Industrial
53%
Architectural
16%
EIS
14%
ACE
10%
Oil & Gas
7%
2015 Net Sales by Segment Business Overview
Steady volume growth driven by global GDP
China growth expected at least mid-single digits
Architectural market expected to grow steadily
Supplier consolidation continues
Consolidation driven by expanding global players
Technology innovation is our base
Drivers: Environmentally sustainable products, focus on
productivity, corrosion resistance and innovative and vibrant
color choices
Customers are globalizing
Local product must meet global specifications consistently
across regions
Global infrastructure growth is driving demand
High temperature resistance required for energy applications
Demand for electrical insulation products linked to
infrastructure
Axalta’s Industrial Business Today
39
PROPRIETARYAXALTA COATING SYSTEMS
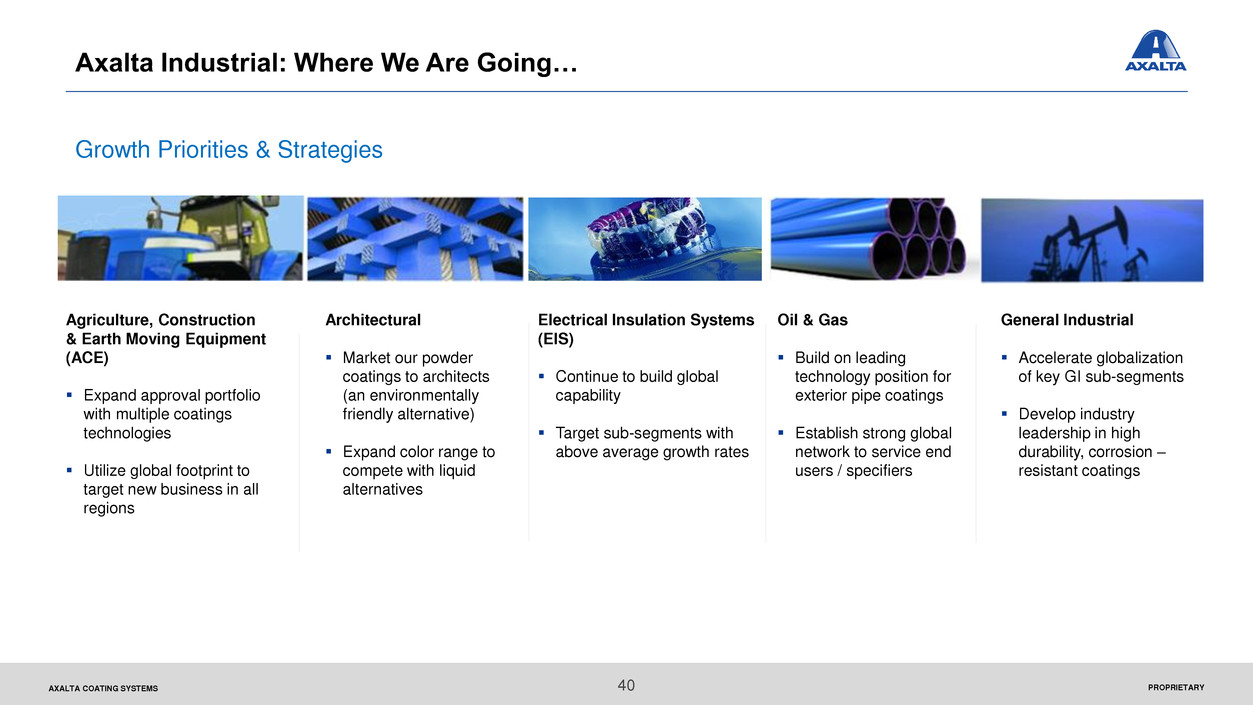
Growth Priorities & Strategies
Axalta Industrial: Where We Are Going…
Agriculture, Construction
& Earth Moving Equipment
(ACE)
Expand approval portfolio
with multiple coatings
technologies
Utilize global footprint to
target new business in all
regions
Architectural
Market our powder
coatings to architects
(an environmentally
friendly alternative)
Expand color range to
compete with liquid
alternatives
Electrical Insulation Systems
(EIS)
Continue to build global
capability
Target sub-segments with
above average growth rates
Oil & Gas
Build on leading
technology position for
exterior pipe coatings
Establish strong global
network to service end
users / specifiers
General Industrial
Accelerate globalization
of key GI sub-segments
Develop industry
leadership in high
durability, corrosion –
resistant coatings
40

Transportation Coatings Overview
PROPRIETARYAXALTA COATING SYSTEMS
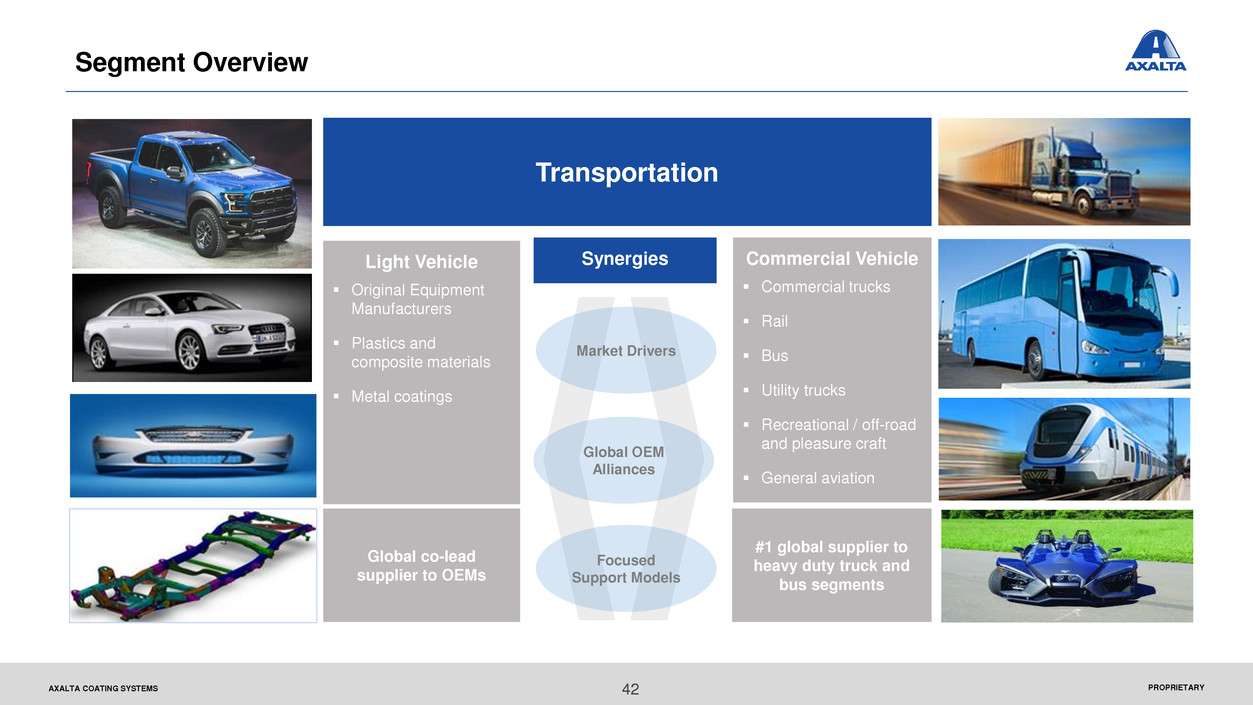
Segment Overview
Global co-lead
supplier to OEMs
Transportation
Light Vehicle
Original Equipment
Manufacturers
Plastics and
composite materials
Metal coatings
#1 global supplier to
heavy duty truck and
bus segments
Commercial Vehicle
Commercial trucks
Rail
Bus
Utility trucks
Recreational / off-road
and pleasure craft
General aviation
42
Synergies
Global OEM
Alliances
Focused
Support Models
Market Drivers
PROPRIETARYAXALTA COATING SYSTEMS
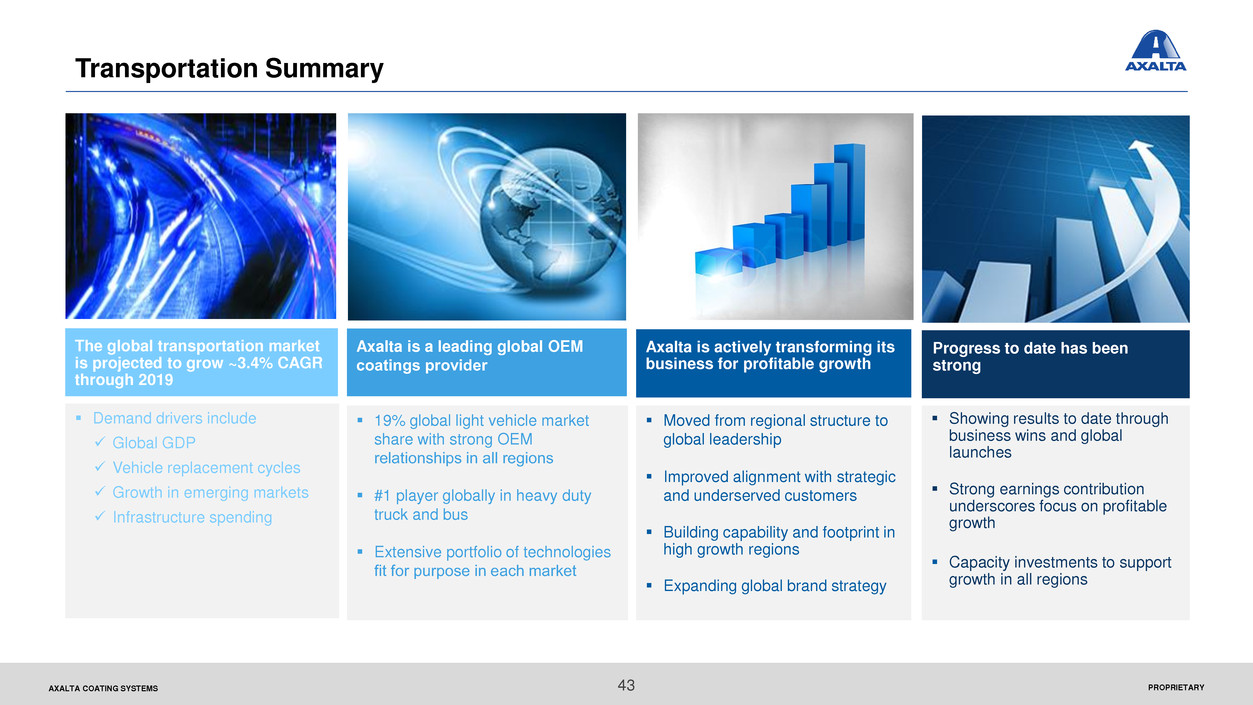
19% global light vehicle market
share with strong OEM
relationships in all regions
#1 player globally in heavy duty
truck and bus
Extensive portfolio of technologies
fit for purpose in each market
Showing results to date through
business wins and global
launches
Strong earnings contribution
underscores focus on profitable
growth
Capacity investments to support
growth in all regions
Moved from regional structure to
global leadership
Improved alignment with strategic
and underserved customers
Building capability and footprint in
high growth regions
Expanding global brand strategy
Demand drivers include
Global GDP
Vehicle replacement cycles
Growth in emerging markets
Infrastructure spending
43
Transportation Summary
The global transportation market
is projected to grow ~3.4% CAGR
through 2019
Axalta is actively transforming its
business for profitable growth
Axalta is a leading global OEM
coatings provider
Progress to date has been
strong
PROPRIETARYAXALTA COATING SYSTEMS
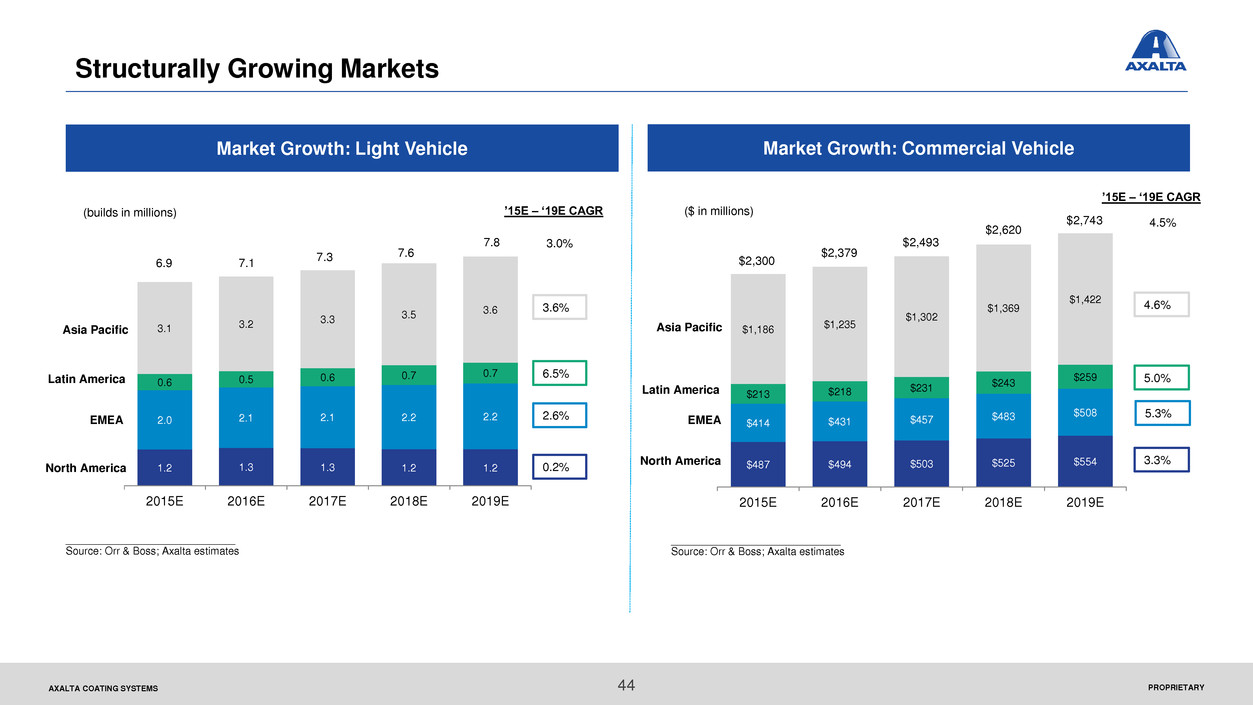
Structurally Growing Markets
44
Market Growth: Light Vehicle Market Growth: Commercial Vehicle
_____________________________
Source: Orr & Boss; Axalta estimates
Asia Pacific
Latin America
EMEA
North America
3.6%
6.5%
2.6%
0.2%
3.0%
1.2 1.3 1.3 1.2 1.2
2.0 2.1 2.1 2.2 2.2
0.6 0.5 0.6
0.7 0.7
3.1 3.2
3.3 3.5
3.6
2015E 2016E 2017E 2018E 2019E
(builds in millions)
7.8
’15E – ‘19E CAGR
7.67.3
7.16.9
($ in millions)
Asia Pacific
EMEA
North America
4.6%
5.0%
5.3%
3.3%
4.5%
$487 $494 $503 $525 $554
$414 $431 $457
$483 $508
$213 $218
$231 $243
$259
$1,186 $1,235
$1,302
$1,369
$1,422
2015E 2016E 2017E 2018E 2019E
’15E – ‘19E CAGR
$2,743
_____________________________
Source: Orr & Boss; Axalta estimates
Latin America
$2,620
$2,493
$2,379
$2,300
PROPRIETARYAXALTA COATING SYSTEMS 45
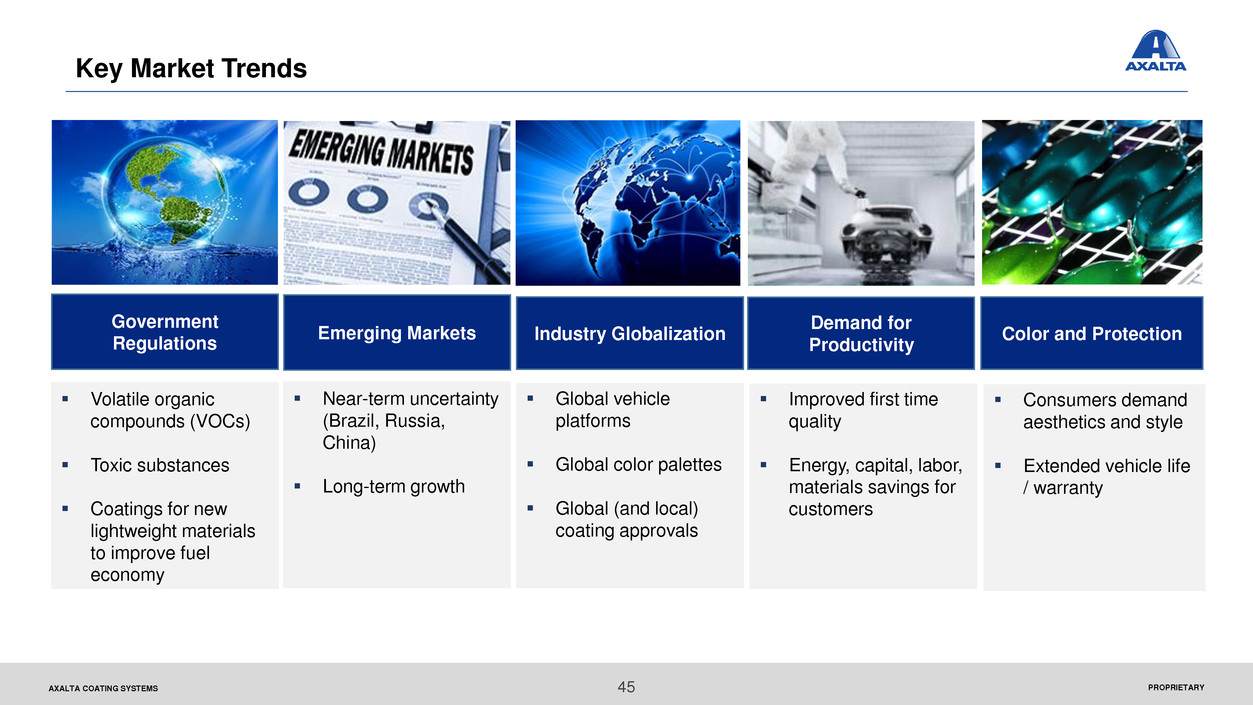
Key Market Trends
Volatile organic
compounds (VOCs)
Toxic substances
Coatings for new
lightweight materials
to improve fuel
economy
Government
Regulations
Emerging Markets Industry Globalization
Demand for
Productivity
Color and Protection
Near-term uncertainty
(Brazil, Russia,
China)
Long-term growth
Global vehicle
platforms
Global color palettes
Global (and local)
coating approvals
Improved first time
quality
Energy, capital, labor,
materials savings for
customers
Consumers demand
aesthetics and style
Extended vehicle life
/ warranty
PROPRIETARYAXALTA COATING SYSTEMS
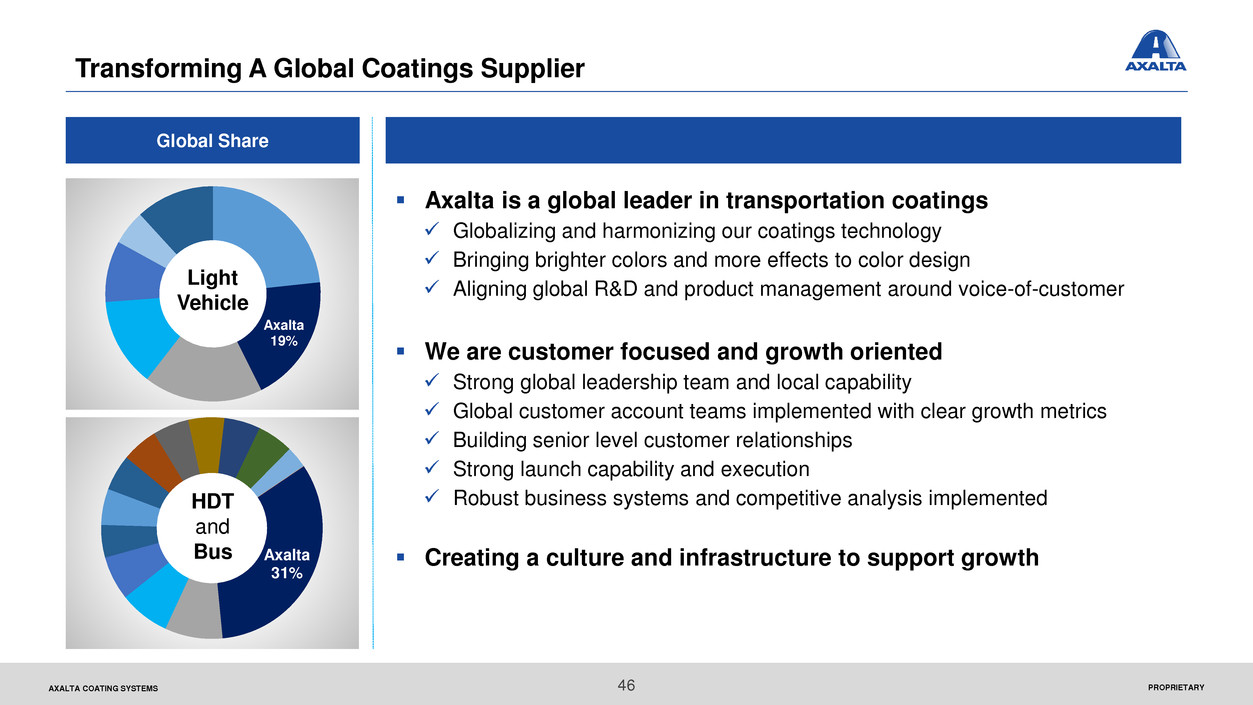
Axalta
19%
Transforming A Global Coatings Supplier
Global Share
46
Axalta
31%
Axalta is a global leader in transportation coatings
Globalizing and harmonizing our coatings technology
Bringing brighter colors and more effects to color design
Aligning global R&D and product management around voice-of-customer
We are customer focused and growth oriented
Strong global leadership team and local capability
Global customer account teams implemented with clear growth metrics
Building senior level customer relationships
Strong launch capability and execution
Robust business systems and competitive analysis implemented
Creating a culture and infrastructure to support growth
HDT
and
Bus
Light
Vehicle
PROPRIETARYAXALTA COATING SYSTEMS
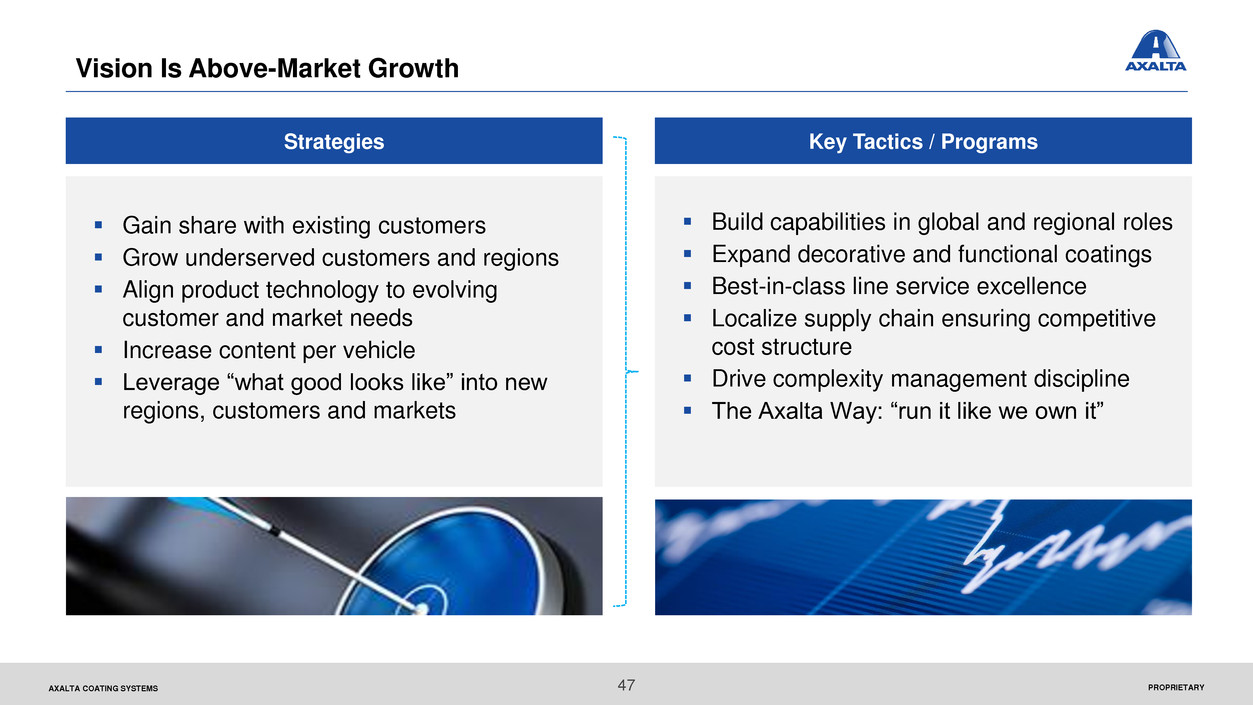
Vision Is Above-Market Growth
Gain share with existing customers
Grow underserved customers and regions
Align product technology to evolving
customer and market needs
Increase content per vehicle
Leverage “what good looks like” into new
regions, customers and markets
Strategies Key Tactics / Programs
Build capabilities in global and regional roles
Expand decorative and functional coatings
Best-in-class line service excellence
Localize supply chain ensuring competitive
cost structure
Drive complexity management discipline
The Axalta Way: “run it like we own it”
47
PROPRIETARYAXALTA COATING SYSTEMS
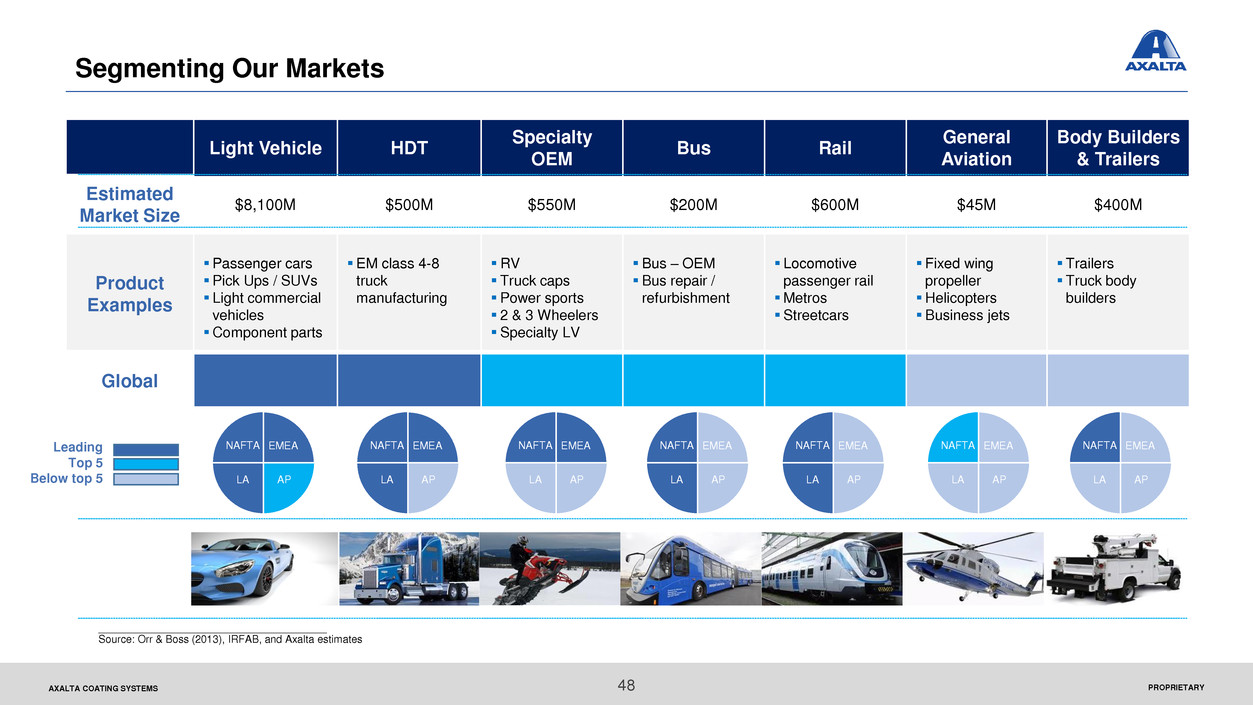
Segmenting Our Markets
Light Vehicle HDT
Specialty
OEM
Bus Rail
General
Aviation
Body Builders
& Trailers
Estimated
Market Size
$8,100M $500M $550M $200M $600M $45M $400M
Product
Examples
Passenger cars
Pick Ups / SUVs
Light commercial
vehicles
Component parts
EM class 4-8
truck
manufacturing
RV
Truck caps
Power sports
2 & 3 Wheelers
Specialty LV
Bus – OEM
Bus repair /
refurbishment
Locomotive
passenger rail
Metros
Streetcars
Fixed wing
propeller
Helicopters
Business jets
Trailers
Truck body
builders
Global
EMEA
APLA
NAFTA EMEA
APLA
NAFTA EMEA
APLA
NAFTAEMEA
APLA
NAFTA
_______________________________________
Source: Orr & Boss (2013), IRFAB, and Axalta estimates
Leading
Top 5
Below top 5
EMEA
APLA
NAFTA EMEA
APLA
NAFTA EMEA
APLA
NAFTA
48
PROPRIETARYAXALTA COATING SYSTEMS 49
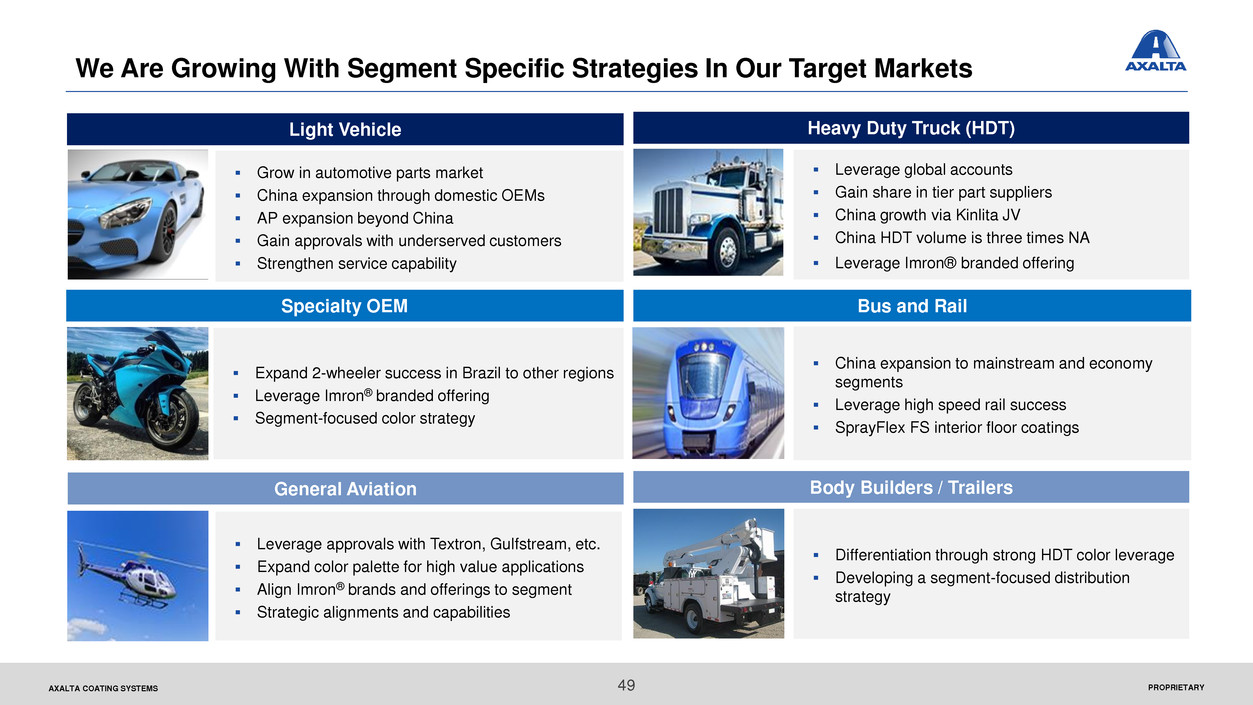
We Are Growing With Segment Specific Strategies In Our Target Markets
China expansion to mainstream and economy
segments
Leverage high speed rail success
SprayFlex FS interior floor coatings
Leverage global accounts
Gain share in tier part suppliers
China growth via Kinlita JV
China HDT volume is three times NA
Leverage Imron® branded offering
Differentiation through strong HDT color leverage
Developing a segment-focused distribution
strategy
Grow in automotive parts market
China expansion through domestic OEMs
AP expansion beyond China
Gain approvals with underserved customers
Strengthen service capability
Expand 2-wheeler success in Brazil to other regions
Leverage Imron® branded offering
Segment-focused color strategy
Light Vehicle
Specialty OEM
General Aviation
Heavy Duty Truck (HDT)
Bus and Rail
Body Builders / Trailers
Leverage approvals with Textron, Gulfstream, etc.
Expand color palette for high value applications
Align Imron® brands and offerings to segment
Strategic alignments and capabilities
APPENDIX
AXALTA COATING SYSTEMS
Q2 Performance Coatings Results
Financial Performance Commentary
Net Sales Variance
51
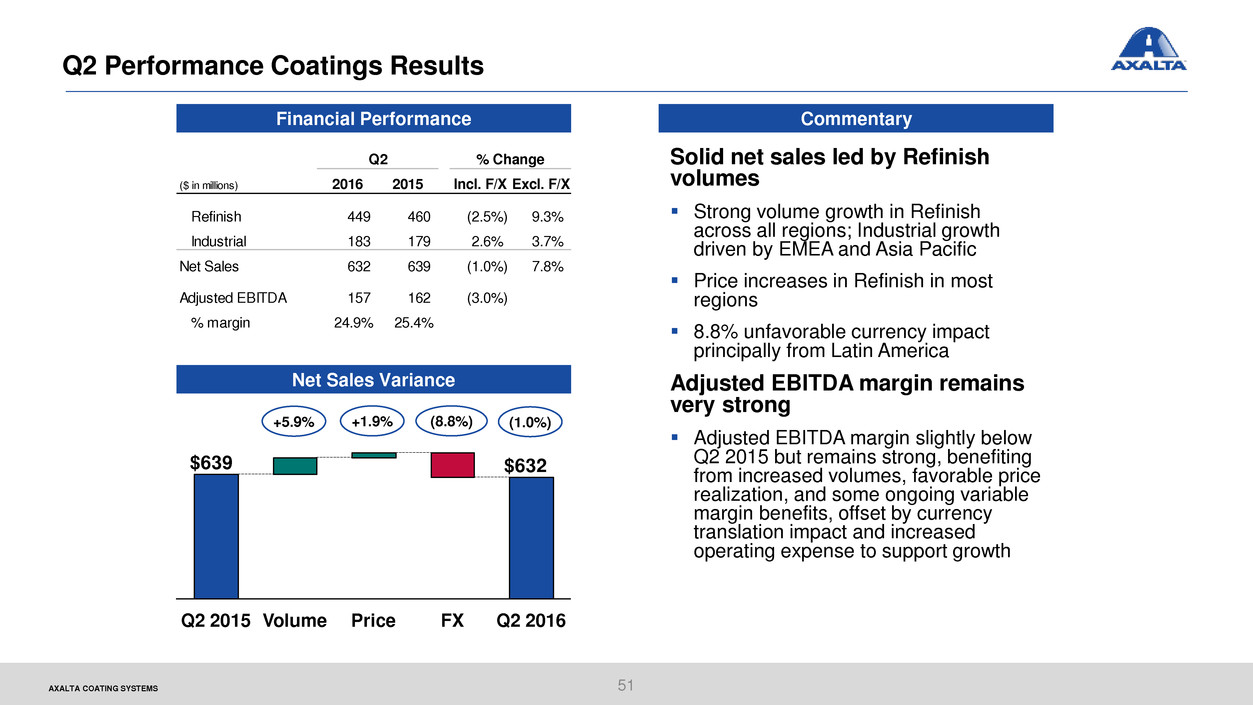
Solid net sales led by Refinish
volumes
Strong volume growth in Refinish
across all regions; Industrial growth
driven by EMEA and Asia Pacific
Price increases in Refinish in most
regions
8.8% unfavorable currency impact
principally from Latin America
Adjusted EBITDA margin remains
very strong
Adjusted EBITDA margin slightly below
Q2 2015 but remains strong, benefiting
from increased volumes, favorable price
realization, and some ongoing variable
margin benefits, offset by currency
translation impact and increased
operating expense to support growth
Q2
($ in millions) 2016 2015 Incl. F/X Excl. F/X
Refinish 449 460 (2.5%) 9.3%
Industrial 183 179 2.6% 3.7%
Net Sales 632 639 (1.0%) 7.8%
Adjusted EBITDA 157 162 (3.0%)
% margin 24.9% 25.4%
% Change
+5.9% +1.9% (8.8%) (1.0%)
$632 $639
Price Q2 2016FXQ2 2015 Volume
AXALTA COATING SYSTEMS
Q2 Transportation Coatings Results
Financial Performance
Net Sales Variance
52
Commentary
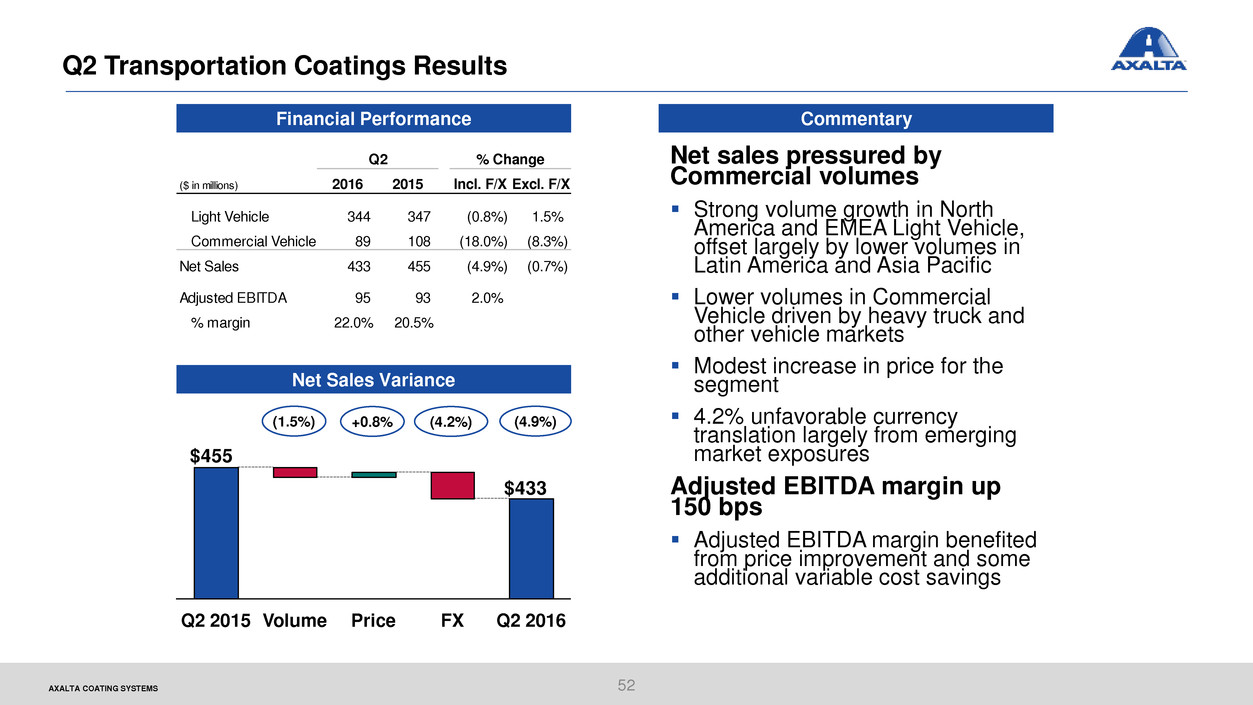
Net sales pressured by
Commercial volumes
Strong volume growth in North
America and EMEA Light Vehicle,
offset largely by lower volumes in
Latin America and Asia Pacific
Lower volumes in Commercial
Vehicle driven by heavy truck and
other vehicle markets
Modest increase in price for the
segment
4.2% unfavorable currency
translation largely from emerging
market exposures
Adjusted EBITDA margin up
150 bps
Adjusted EBITDA margin benefited
from price improvement and some
additional variable cost savings
($ in millions) 2016 2015 Incl. F/X Excl. F/X
Light Vehicle 344 347 (0.8%) 1.5%
Commercial Vehicl 89 108 (18.0%) (8.3%)
Net Sales 433 455 (4.9%) (0.7%)
Adjusted EBITDA 95 93 2.0%
% margin 22.0% 20.5%
Q2 % Change
(1.5%) +0.8% (4.9%)
$433
$455
Q2 2015 Q2 2016Price FXVolume
(4.2%)
PROPRIETARYAXALTA COATING SYSTEMS
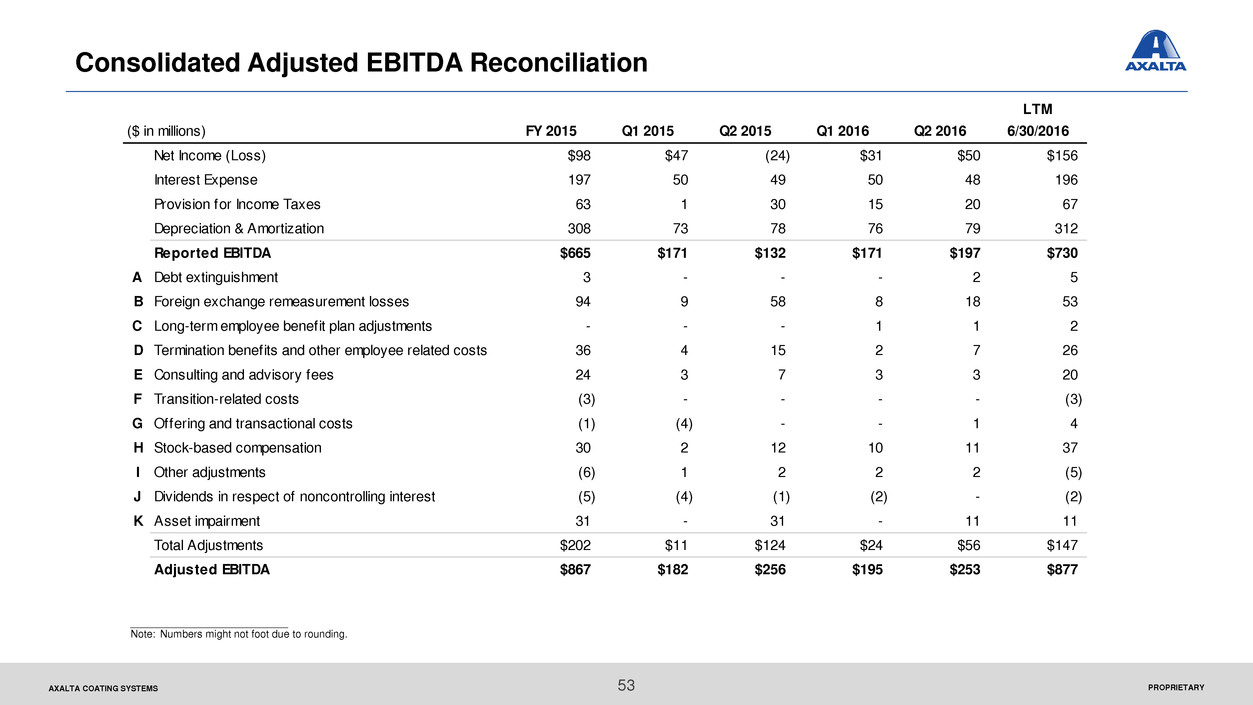
Consolidated Adjusted EBITDA Reconciliation
53
___________________________
Note: Numbers might not foot due to rounding.
LTM
($ in millions) FY 2015 Q1 2015 Q2 2015 Q1 2016 Q2 2016 6/30/2016
Net Income (Loss) $98 $47 (24) $31 $50 $156
Interest Expense 197 50 49 50 48 196
Provision for Income Taxes 63 1 30 15 20 67
Depreciation & Amortization 308 73 78 76 79 312
Reported EBITDA $665 $171 $132 $171 $197 $730
A Debt extinguishment 3 - - - 2 5
B Foreign exchange remeasurement losses 94 9 58 8 18 53
C Long-term employee benefit plan adjustments - - - 1 1 2
D Termination benefits and other employee related costs 36 4 15 2 7 26
E Consulting and advisory fees 24 3 7 3 3 20
F Transition-related costs (3) - - - - (3)
G Offering and transactional costs (1) (4) - - 1 4
H Stock-based compensation 30 2 12 10 11 37
I Other adjustments (6) 1 2 2 2 (5)
J Dividends in respect of noncontrolling interest (5) (4) (1) (2) - (2)
K Asset impairment 31 - 31 - 11 11
Total Adjustments $202 $11 $124 $24 $56 $147
Adjusted EBITDA $867 $182 $256 $195 $253 $877
PROPRIETARYAXALTA COATING SYSTEMS 54
Consolidated Adjusted EBITDA Reconciliation (cont’d)
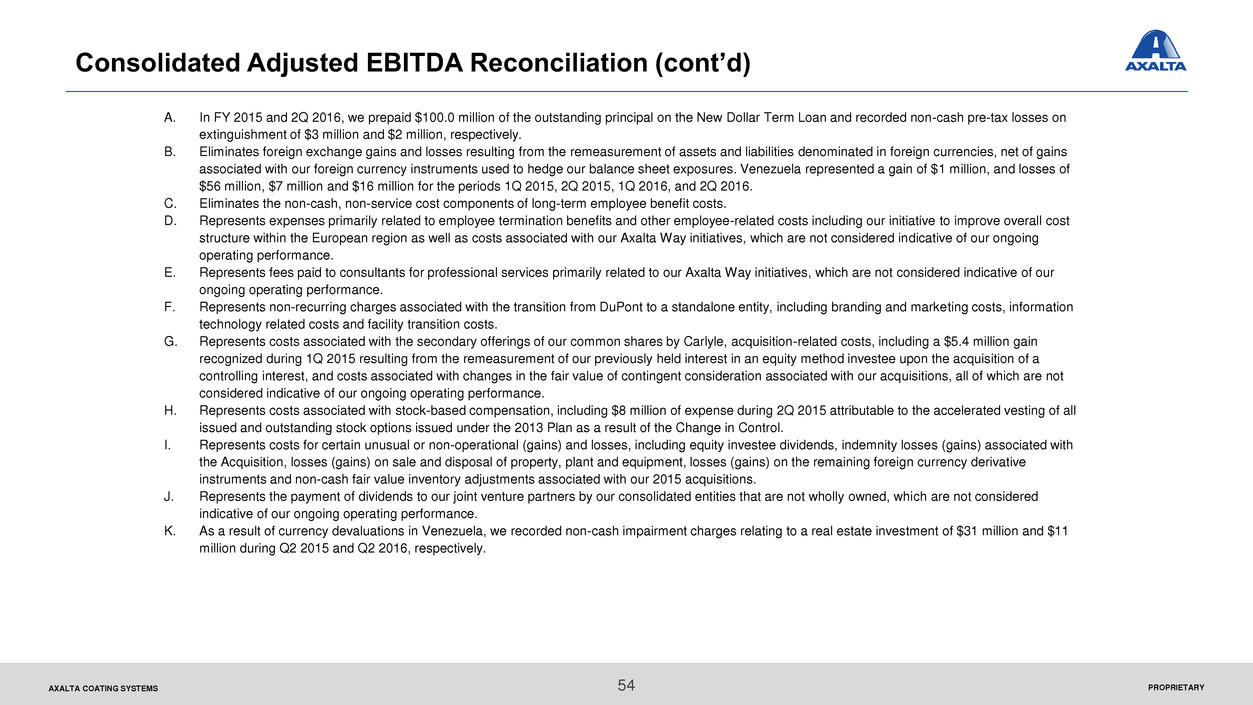
A. In FY 2015 and 2Q 2016, we prepaid $100.0 million of the outstanding principal on the New Dollar Term Loan and recorded non-cash pre-tax losses on
extinguishment of $3 million and $2 million, respectively.
B. Eliminates foreign exchange gains and losses resulting from the remeasurement of assets and liabilities denominated in foreign currencies, net of gains
associated with our foreign currency instruments used to hedge our balance sheet exposures. Venezuela represented a gain of $1 million, and losses of
$56 million, $7 million and $16 million for the periods 1Q 2015, 2Q 2015, 1Q 2016, and 2Q 2016.
C. Eliminates the non-cash, non-service cost components of long-term employee benefit costs.
D. Represents expenses primarily related to employee termination benefits and other employee-related costs including our initiative to improve overall cost
structure within the European region as well as costs associated with our Axalta Way initiatives, which are not considered indicative of our ongoing
operating performance.
E. Represents fees paid to consultants for professional services primarily related to our Axalta Way initiatives, which are not considered indicative of our
ongoing operating performance.
F. Represents non-recurring charges associated with the transition from DuPont to a standalone entity, including branding and marketing costs, information
technology related costs and facility transition costs.
G. Represents costs associated with the secondary offerings of our common shares by Carlyle, acquisition-related costs, including a $5.4 million gain
recognized during 1Q 2015 resulting from the remeasurement of our previously held interest in an equity method investee upon the acquisition of a
controlling interest, and costs associated with changes in the fair value of contingent consideration associated with our acquisitions, all of which are not
considered indicative of our ongoing operating performance.
H. Represents costs associated with stock-based compensation, including $8 million of expense during 2Q 2015 attributable to the accelerated vesting of all
issued and outstanding stock options issued under the 2013 Plan as a result of the Change in Control.
I. Represents costs for certain unusual or non-operational (gains) and losses, including equity investee dividends, indemnity losses (gains) associated with
the Acquisition, losses (gains) on sale and disposal of property, plant and equipment, losses (gains) on the remaining foreign currency derivative
instruments and non-cash fair value inventory adjustments associated with our 2015 acquisitions.
J. Represents the payment of dividends to our joint venture partners by our consolidated entities that are not wholly owned, which are not considered
indicative of our ongoing operating performance.
K. As a result of currency devaluations in Venezuela, we recorded non-cash impairment charges relating to a real estate investment of $31 million and $11
million during Q2 2015 and Q2 2016, respectively.

Thank you!
Investor Contact:
Chris Mecray, VP IR
Christopher.Mecray@axaltacs.com
215-255-7970