EXHIBIT 99.2
Published on August 3, 2017
Axalta Coating Systems
Q2 2017 FINANCIAL RESULTS
August 3, 2017
Exhibit 99.2
AXALTA COATING SYSTEMS
Forward-Looking Statements
This presentation and the oral remarks made in connection herewith may contain “forward-looking statements” within the meaning of the U.S. Private Securities Litigation Reform
Act of 1995, including those relating to 2017 financial projections, including execution on our 2017 goals as well as 2017 net sales, net sales excluding FX, Adjusted EBITDA,
interest expense, tax rate, as adjusted, free cash flow, capital expenditures, depreciation and amortization, diluted shares outstanding, cost savings, contributions from
acquisitions, raw material cost increases, and related assumptions. Any forward-looking statements involve risks, uncertainties and assumptions. These statements often include
words such as “believe,” “expect,” “anticipate,” “intend,” “plan,” “estimate,” “target,” “project,” “forecast,” “seek,” “will,” “may,” “should,” “could,” “would,” or similar expressions.
These statements are based on certain assumptions that we have made in light of our experience in the industry and our perceptions of historical trends, current conditions,
expected future developments and other factors we believe are appropriate under the circumstances as of the date hereof. Although we believe that the assumptions and
analysis underlying these statements are reasonable as of the date hereof, investors are cautioned not to place undue reliance on these statements. We do not have any
obligation to and do not intend to update any forward-looking statements included herein, which speak only as of the date hereof. You should understand that these statements
are not guarantees of future performance or results. Actual results could differ materially from those described in any forward-looking statements contained herein or the oral
remarks made in connection herewith as a result of a variety of factors, including known and unknown risks and uncertainties, many of which are beyond our control including,
but not limited to, the risks and uncertainties described in "Non-GAAP Financial Measures," and "Forward-Looking Statements" as well as "Risk Factors" in our Annual Report on
Form 10-K for the year ended December 31, 2016 and our Quarterly Report on Form 10-Q for the quarter ended March 31, 2017.
Non-GAAP Financial Measures
The historical financial information included in this presentation includes financial information that is not presented in accordance with generally accepted accounting principles in
the United States (“GAAP”), including net sales excluding FX, Adjusted Net Income, EBITDA, Adjusted EBITDA, Free Cash Flow, tax rate, as adjusted, and Net Debt.
Management uses these non-GAAP financial measures in the analysis of our financial and operating performance because they assist in the evaluation of underlying trends in
our business. Adjusted EBITDA consists of EBITDA adjusted for (i) non-operating income or expense, (ii) the impact of certain non-cash, nonrecurring or other items that are
included in net income and EBITDA that we do not consider indicative of our ongoing performance and (iii) certain unusual or nonrecurring items impacting results in a particular
period. We believe that making such adjustments provides investors meaningful information to understand our operating results and ability to analyze financial and business
trends on a period-to-period basis. Adjusted Net Income shows the adjusted value of Net Income attributable to controlling interests after removing the items that are determined
by management to be unusual or nonrecurring in nature or items that we do not consider indicative of our ongoing operating performance. Our use of the terms net sales
excluding FX, Adjusted Net Income, EBITDA, Adjusted EBITDA, Free Cash Flow, tax rate, as adjusted, and Net Debt may differ from that of others in our industry. Net sales
excluding FX, Adjusted Net Income, EBITDA, Adjusted EBITDA and Free Cash Flow should not be considered as alternatives to net sales, net income, operating income or any
other performance measures derived in accordance with GAAP as measures of operating performance or operating cash flows or as measures of liquidity. Net sales excluding
FX, Adjusted Net Income, EBITDA, Adjusted EBITDA, Free Cash Flow, tax rate, as adjusted, and Net Debt have important limitations as analytical tools and should be
considered in conjunction with, and not as substitutes for, our results as reported under GAAP. This presentation includes a reconciliation of certain non-GAAP financial
measures with the most directly comparable financial measures calculated in accordance with GAAP. Axalta does not provide a reconciliation for non-GAAP estimates for net
sales excluding FX, Adjusted Net Income, EBITDA, Adjusted EBITDA, Free Cash Flow or tax rate, as adjusted, as-reported on a forward-looking basis because the information
necessary to calculate a meaningful or accurate estimation of reconciling items is not available without unreasonable effort. For example, such reconciling items include the
impact of foreign currency exchange gains or losses, gains or losses that are unusual or nonrecurring in nature, as well as discrete taxable events. We cannot estimate or project
those items and they may have a substantial and unpredictable impact on our US GAAP results.
Segment Financial Measures
The primary measure of segment operating performance is Adjusted EBITDA, which is a key metric that is used by management to evaluate business performance in comparison
to budgets, forecasts and prior year financial results, providing a measure that management believes reflects Axalta’s core operating performance. As we do not measure
segment operating performance based on Net Income, a reconciliation of this non-GAAP financial measure with the most directly comparable financial measure calculated in
accordance with GAAP is not available.
Defined Terms
All capitalized terms contained within this presentation have been previously defined in our filings with the United States Securities and Exchange Commission.
2
Legal Notices
AXALTA COATING SYSTEMS
Q2 2017 Highlights
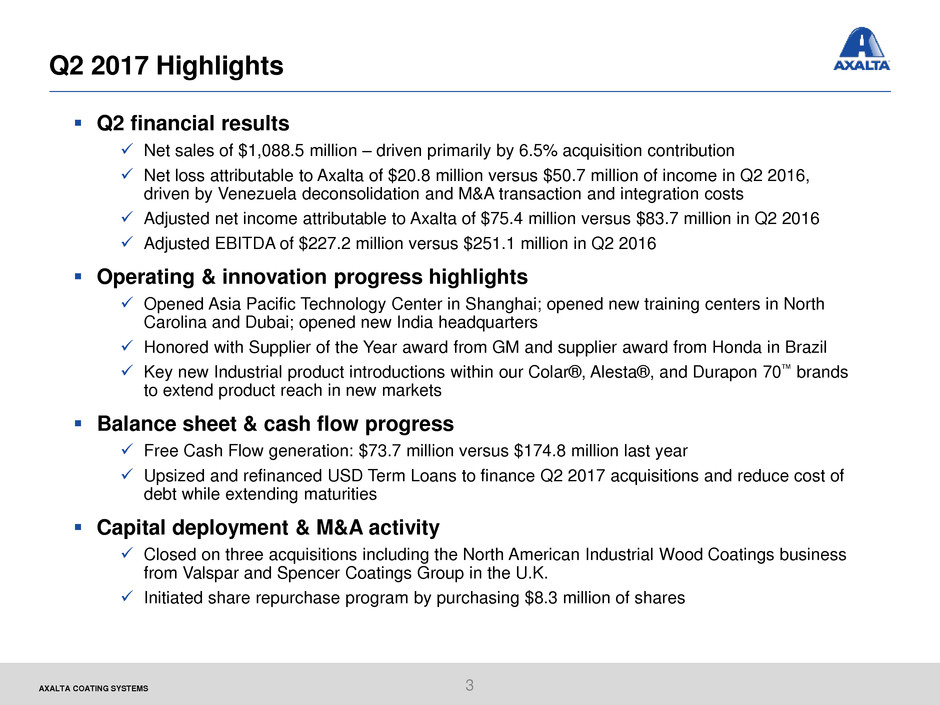
Q2 financial results
Net sales of $1,088.5 million – driven primarily by 6.5% acquisition contribution
Net loss attributable to Axalta of $20.8 million versus $50.7 million of income in Q2 2016,
driven by Venezuela deconsolidation and M&A transaction and integration costs
Adjusted net income attributable to Axalta of $75.4 million versus $83.7 million in Q2 2016
Adjusted EBITDA of $227.2 million versus $251.1 million in Q2 2016
Operating & innovation progress highlights
Opened Asia Pacific Technology Center in Shanghai; opened new training centers in North
Carolina and Dubai; opened new India headquarters
Honored with Supplier of the Year award from GM and supplier award from Honda in Brazil
Key new Industrial product introductions within our Colar®, Alesta®, and Durapon 70™ brands
to extend product reach in new markets
Balance sheet & cash flow progress
Free Cash Flow generation: $73.7 million versus $174.8 million last year
Upsized and refinanced USD Term Loans to finance Q2 2017 acquisitions and reduce cost of
debt while extending maturities
Capital deployment & M&A activity
Closed on three acquisitions including the North American Industrial Wood Coatings business
from Valspar and Spencer Coatings Group in the U.K.
Initiated share repurchase program by purchasing $8.3 million of shares
3
AXALTA COATING SYSTEMS 4
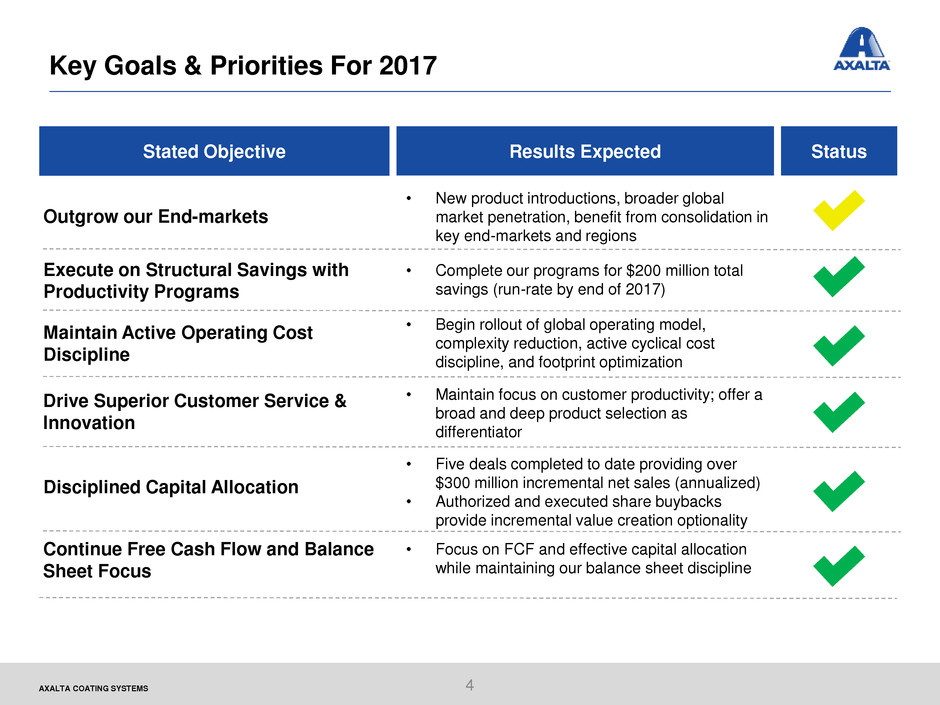
Key Goals & Priorities For 2017
Outgrow our End-markets
Drive Superior Customer Service &
Innovation
Maintain Active Operating Cost
Discipline
Execute on Structural Savings with
Productivity Programs
• New product introductions, broader global
market penetration, benefit from consolidation in
key end-markets and regions
• Begin rollout of global operating model,
complexity reduction, active cyclical cost
discipline, and footprint optimization
• Complete our programs for $200 million total
savings (run-rate by end of 2017)
Disciplined Capital Allocation
• Five deals completed to date providing over
$300 million incremental net sales (annualized)
• Authorized and executed share buybacks
provide incremental value creation optionality
Continue Free Cash Flow and Balance
Sheet Focus
• Focus on FCF and effective capital allocation
while maintaining our balance sheet discipline
Stated Objective Results Expected
• Maintain focus on customer productivity; offer a
broad and deep product selection as
differentiator
Status
AXALTA COATING SYSTEMS
Q2 Consolidated Results
Financial Performance Commentary
Net Sales Variance
$1,064
Price Acq. Q2 2017
$1,089
FXQ2 2016 Volume
5
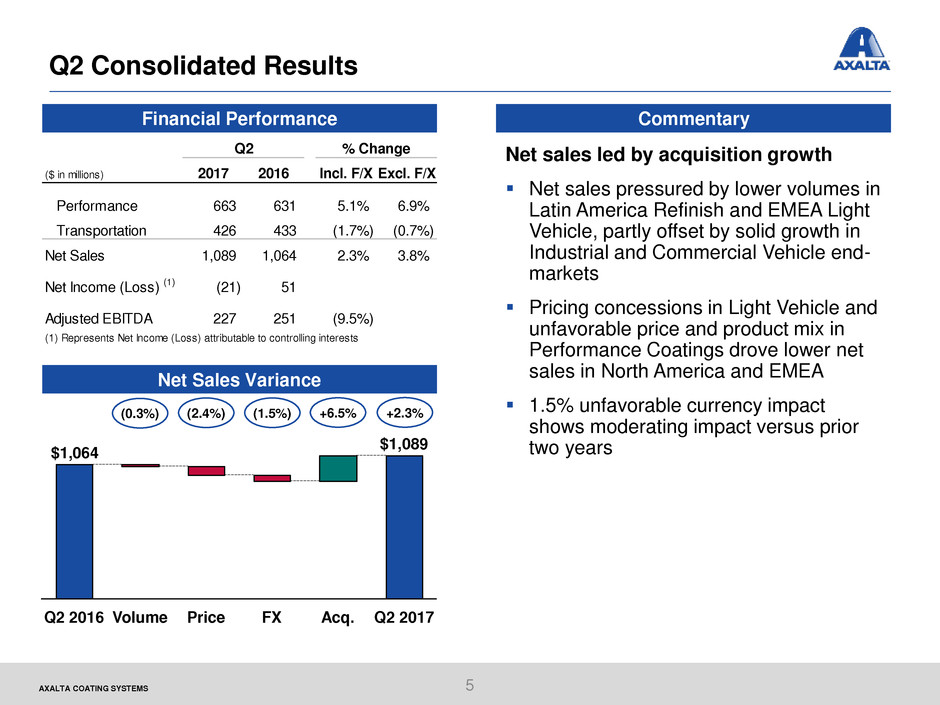
Net sales led by acquisition growth
Net sales pressured by lower volumes in
Latin America Refinish and EMEA Light
Vehicle, partly offset by solid growth in
Industrial and Commercial Vehicle end-
markets
Pricing concessions in Light Vehicle and
unfavorable price and product mix in
Performance Coatings drove lower net
sales in North America and EMEA
1.5% unfavorable currency impact
shows moderating impact versus prior
two years
(0.3%) (2.4%) (1.5%) +6.5% +2.3%
($ in millions) 2017 2016 Incl. F/X Excl. F/X
Performance 663 631 5.1% 6.9%
Transportation 426 433 (1.7%) (0.7%)
Net Sales 1,089 1,064 2.3% 3.8%
Net Income (Loss) (1) (21) 51
Adjusted EBITDA 227 251 (9.5%)
(1) Represents Net Income (Loss) attributable to controlling interests
Q2 % Change
AXALTA COATING SYSTEMS
Q2 Performance Coatings Results
Financial Performance Commentary
Net Sales Variance
6
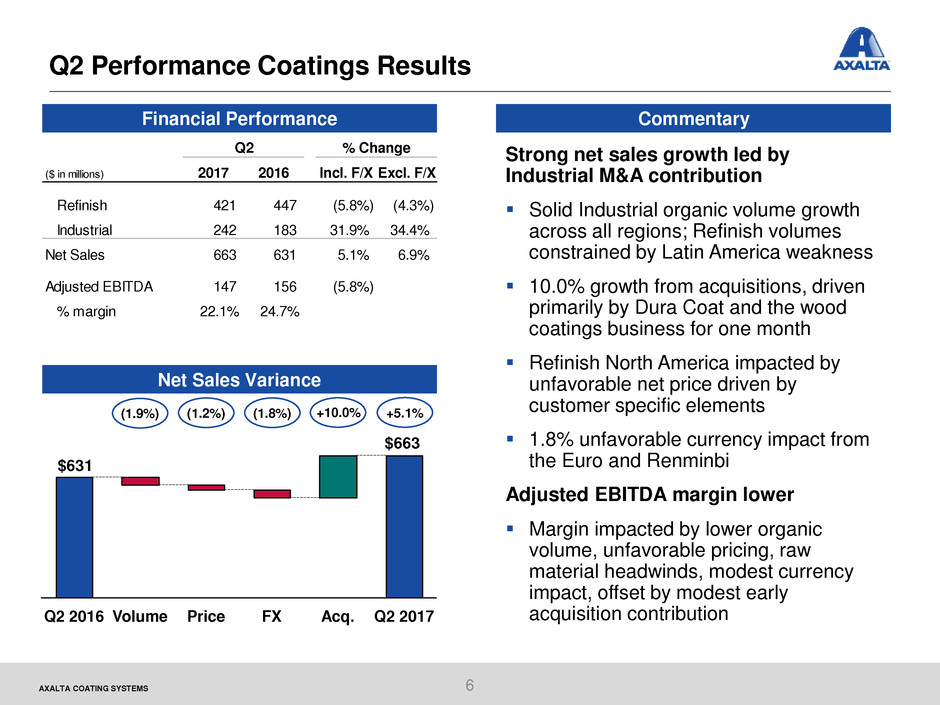
Strong net sales growth led by
Industrial M&A contribution
Solid Industrial organic volume growth
across all regions; Refinish volumes
constrained by Latin America weakness
10.0% growth from acquisitions, driven
primarily by Dura Coat and the wood
coatings business for one month
Refinish North America impacted by
unfavorable net price driven by
customer specific elements
1.8% unfavorable currency impact from
the Euro and Renminbi
Adjusted EBITDA margin lower
Margin impacted by lower organic
volume, unfavorable pricing, raw
material headwinds, modest currency
impact, offset by modest early
acquisition contribution
$663
$631
Q2 2017Acq.PriceVolume FXQ2 2016
(1.9%) (1.2%) (1.8%) +5.1%+10.0%
Q2
($ in millions) 2017 2016 Incl. F/X Excl. F/X
Refinish 421 447 (5.8%) (4.3%)
Industrial 242 183 31.9% 34.4%
Net Sales 663 631 5.1% 6.9%
Adjusted EBITDA 147 156 (5.8%)
% margin 22.1% 24.7%
% Change
AXALTA COATING SYSTEMS
Q2 Transportation Coatings Results
Financial Performance Commentary
Net Sales Variance
7
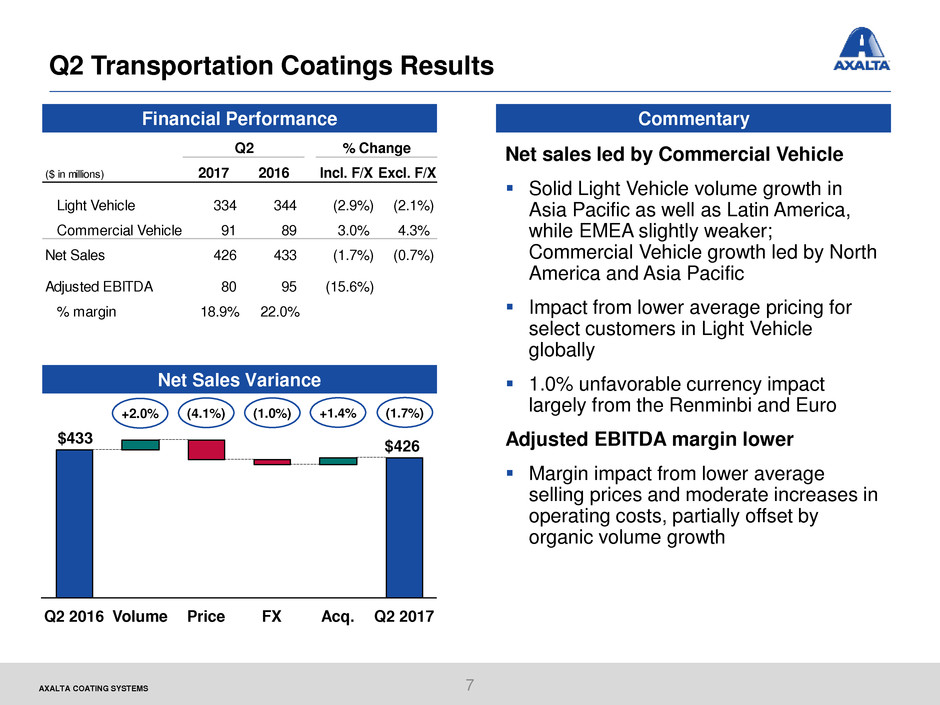
Net sales led by Commercial Vehicle
Solid Light Vehicle volume growth in
Asia Pacific as well as Latin America,
while EMEA slightly weaker;
Commercial Vehicle growth led by North
America and Asia Pacific
Impact from lower average pricing for
select customers in Light Vehicle
globally
1.0% unfavorable currency impact
largely from the Renminbi and Euro
Adjusted EBITDA margin lower
Margin impact from lower average
selling prices and moderate increases in
operating costs, partially offset by
organic volume growth
$426
$433
Q2 2016 Q2 2017FX Acq.PriceVolume
+2.0% (4.1%) (1.0%) +1.4% (1.7%)
($ in millions) 2017 2016 Incl. F/X Excl. F/X
Light Vehicle 334 344 (2.9%) (2.1%)
Commercial Vehicle 91 89 3.0% 4.3%
Net Sales 426 433 (1.7%) (0.7%)
Adjusted EBITDA 80 95 (15.6%)
% margin 18.9% 22.0%
Q2 % Change
AXALTA COATING SYSTEMS
Debt and Liquidity Summary
Capitalization
8
Comments
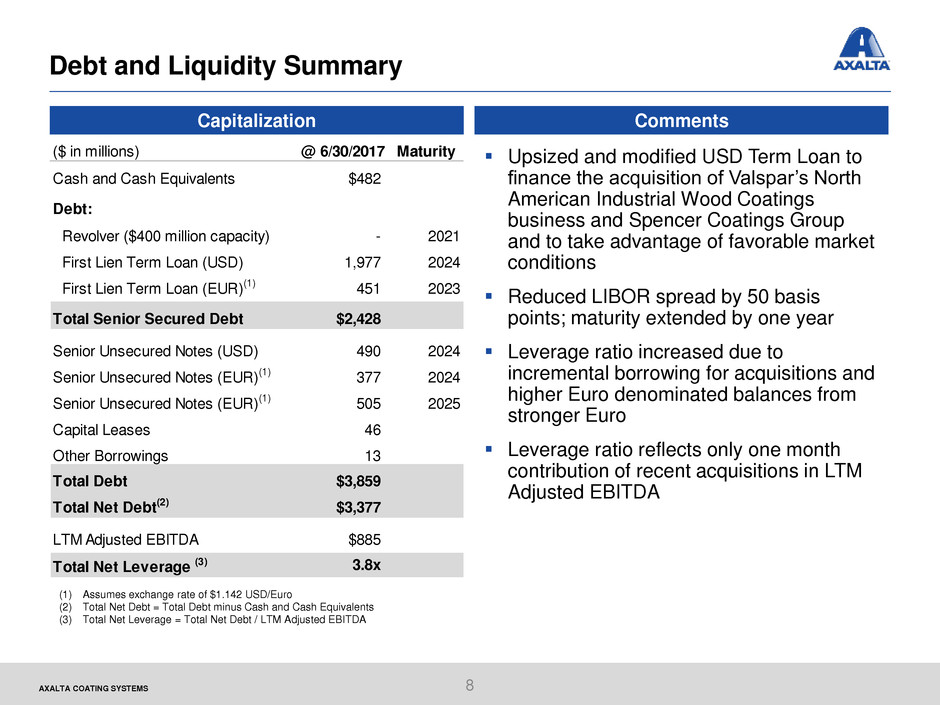
Upsized and modified USD Term Loan to
finance the acquisition of Valspar’s North
American Industrial Wood Coatings
business and Spencer Coatings Group
and to take advantage of favorable market
conditions
Reduced LIBOR spread by 50 basis
points; maturity extended by one year
Leverage ratio increased due to
incremental borrowing for acquisitions and
higher Euro denominated balances from
stronger Euro
Leverage ratio reflects only one month
contribution of recent acquisitions in LTM
Adjusted EBITDA
(1) Assumes exchange rate of $1.142 USD/Euro
(2) Total Net Debt = Total Debt minus Cash and Cash Equivalents
(3) Total Net Leverage = Total Net Debt / LTM Adjusted EBITDA
($ in millions) @ 6/30/2017 Maturity
Cash and Cash Equivalents $482
Debt:
Revolver ($400 million capacity) - 2021
First Lien Term Loan (USD) 1,977 2024
First Lien Term Loan (EUR)(1) 451 2023
Total Senior Secured Debt $2,428
Senior Unsecured Notes (USD) 490 2024
Senior Unsecured Notes (EUR)(1) 377 2024
Senior Unsecured Notes (EUR)(1) 505 2025
Capital Leases 46
Other Borrowings 13
Total Debt $3,859
Total Net Debt(2) $3,377
LTM Adjusted EBITDA $885
Total Net Leverage (3) 3.8x
AXALTA COATING SYSTEMS
Full Year 2017 Guidance
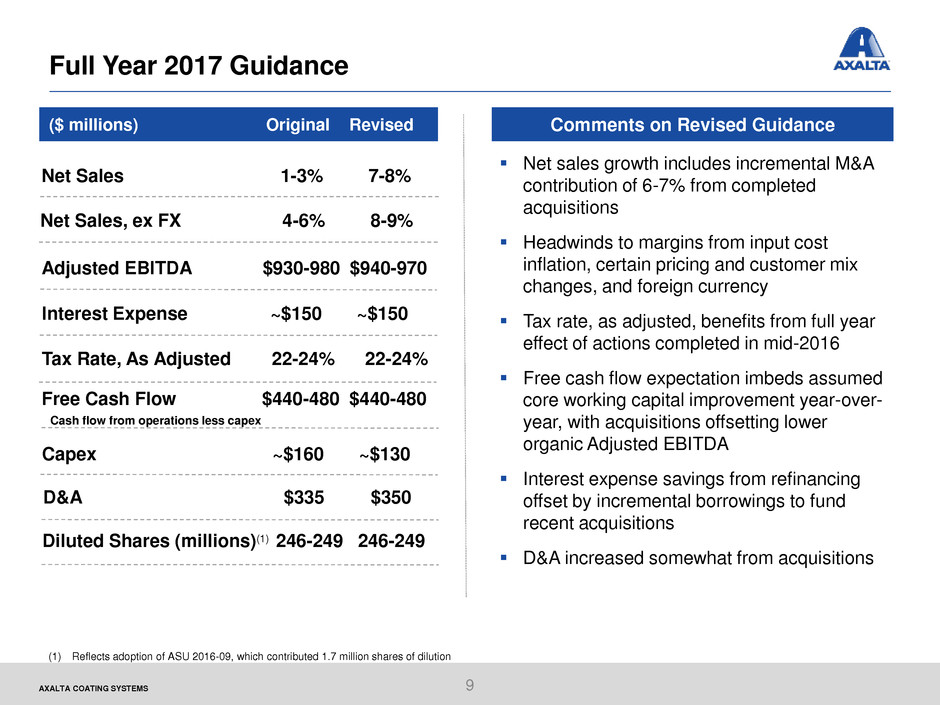
Net sales growth includes incremental M&A
contribution of 6-7% from completed
acquisitions
Headwinds to margins from input cost
inflation, certain pricing and customer mix
changes, and foreign currency
Tax rate, as adjusted, benefits from full year
effect of actions completed in mid-2016
Free cash flow expectation imbeds assumed
core working capital improvement year-over-
year, with acquisitions offsetting lower
organic Adjusted EBITDA
Interest expense savings from refinancing
offset by incremental borrowings to fund
recent acquisitions
D&A increased somewhat from acquisitions
($ millions) Original Revised
Net Sales, ex FX 4-6% 8-9%
Tax Rate, As Adjusted 22-24% 22-24%
Free Cash Flow $440-480 $440-480
Cash flow from operations less capex
Comments on Revised Guidance
Interest Expense ~$150 ~$150
Adjusted EBITDA $930-980 $940-970
Net Sales 1-3% 7-8%
Capex ~$160 ~$130
9
Diluted Shares (millions)(1) 246-249 246-249
D&A $335 $350
(1) Reflects adoption of ASU 2016-09, which contributed 1.7 million shares of dilution
Appendix
AXALTA COATING SYSTEMS
Full Year 2017 Assumptions
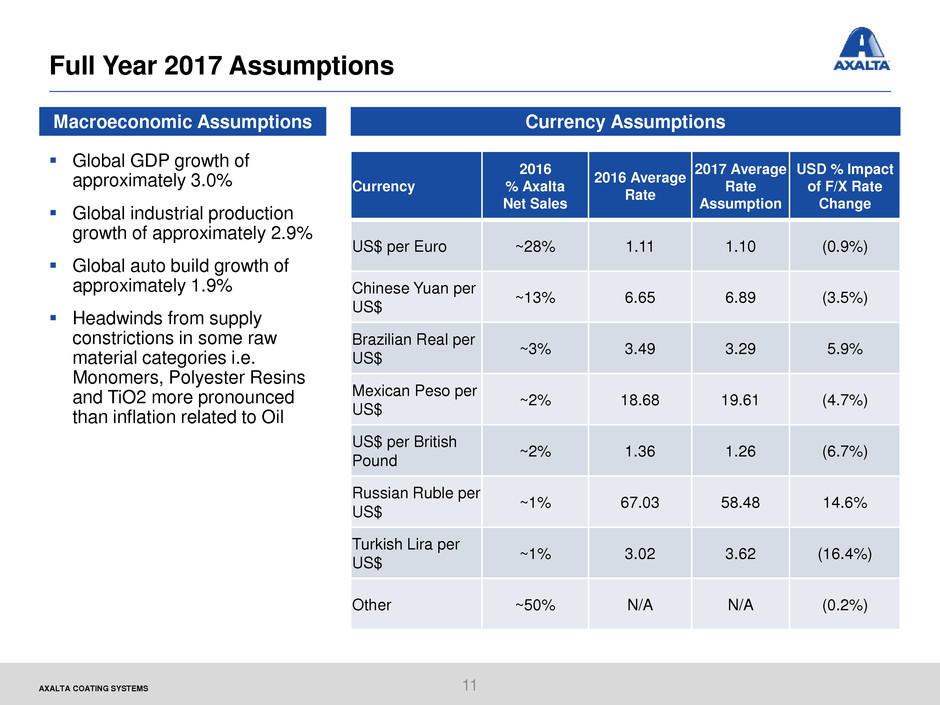
Global GDP growth of
approximately 3.0%
Global industrial production
growth of approximately 2.9%
Global auto build growth of
approximately 1.9%
Headwinds from supply
constrictions in some raw
material categories i.e.
Monomers, Polyester Resins
and TiO2 more pronounced
than inflation related to Oil
Currency
2016
% Axalta
Net Sales
2016 Average
Rate
2017 Average
Rate
Assumption
USD % Impact
of F/X Rate
Change
US$ per Euro ~28% 1.11 1.10 (0.9%)
Chinese Yuan per
US$
~13% 6.65 6.89 (3.5%)
Brazilian Real per
US$
~3% 3.49 3.29 5.9%
Mexican Peso per
US$
~2% 18.68 19.61 (4.7%)
US$ per British
Pound
~2% 1.36 1.26 (6.7%)
Russian Ruble per
US$
~1% 67.03 58.48 14.6%
Turkish Lira per
US$
~1% 3.02 3.62 (16.4%)
Other ~50% N/A N/A (0.2%)
Currency AssumptionsMacroeconomic Assumptions
11
AXALTA COATING SYSTEMS
Adjusted EBITDA Reconciliation
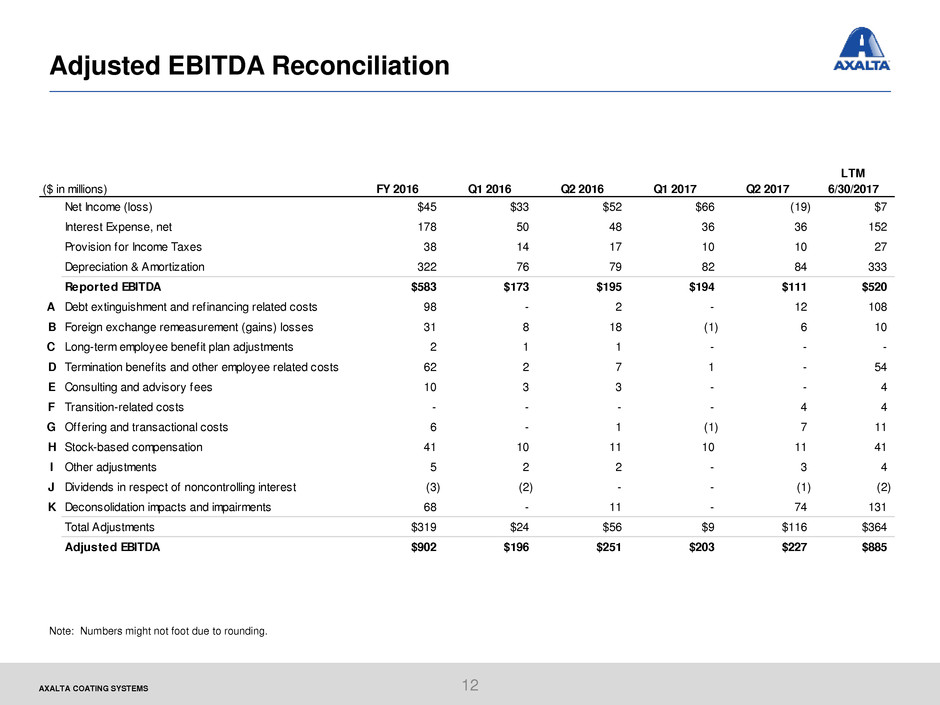
Note: Numbers might not foot due to rounding.
12
($ in millions) FY 2016 Q1 2016 Q2 2016 Q1 2017 Q2 2017
LTM
6/30/2017
Net Income (loss) $45 $33 $52 $66 (19) $7
Interest Expense, net 178 50 48 36 36 152
Provision for Income Taxes 38 14 17 10 10 27
Depreciation & Amortization 322 76 79 82 84 333
Reported EBITDA $583 $173 $195 $194 $111 $520
A Debt extinguishment and refinancing related costs 98 - 2 - 12 108
B Foreign exchange remeasurement (gains) losses 31 8 18 (1) 6 10
C Long-term employee benefit plan adjustments 2 1 1 - - -
D Termination benefits and other employee related costs 62 2 7 1 - 54
E Consulting and advisory fees 10 3 3 - - 4
F Transition-related costs - - - - 4 4
G Offering and transactional costs 6 - 1 (1) 7 11
H Stock-based compensation 41 10 11 10 11 41
I Other adjustments 5 2 2 - 3 4
J Dividends in respect of noncontrolling interest (3) (2) - - (1) (2)
K Deconsolidation impacts and impairments 68 - 11 - 74 131
Total Adjustments $319 $24 $56 $9 $116 $364
Adjusted EBITDA $902 $196 $251 $203 $227 $885
AXALTA COATING SYSTEMS
Adjusted EBITDA Reconciliation (cont’d)
13
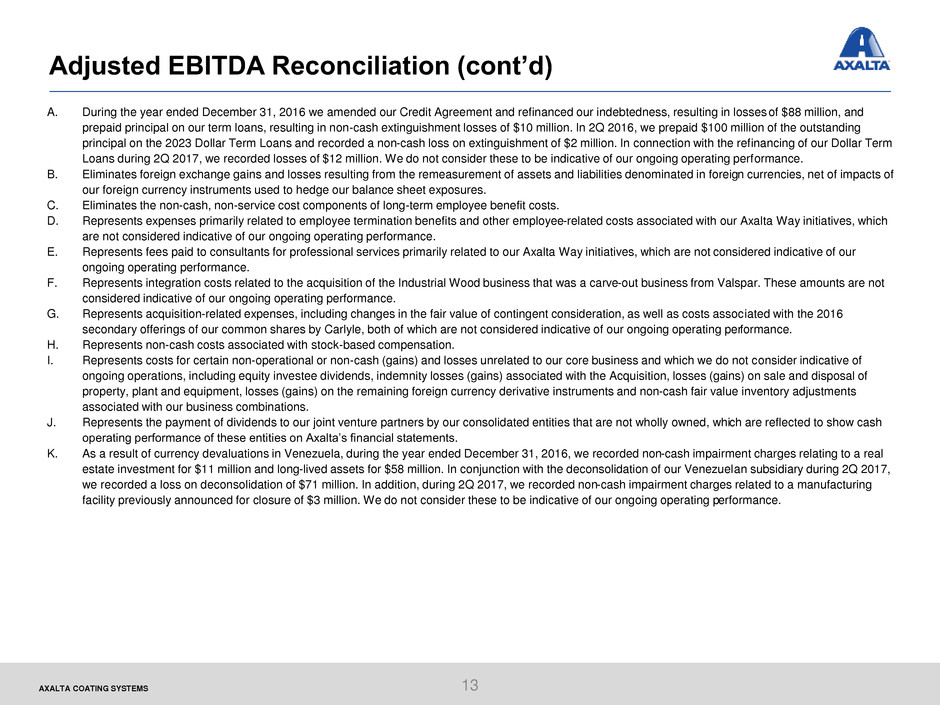
A. During the year ended December 31, 2016 we amended our Credit Agreement and refinanced our indebtedness, resulting in losses of $88 million, and
prepaid principal on our term loans, resulting in non-cash extinguishment losses of $10 million. In 2Q 2016, we prepaid $100 million of the outstanding
principal on the 2023 Dollar Term Loans and recorded a non-cash loss on extinguishment of $2 million. In connection with the refinancing of our Dollar Term
Loans during 2Q 2017, we recorded losses of $12 million. We do not consider these to be indicative of our ongoing operating performance.
B. Eliminates foreign exchange gains and losses resulting from the remeasurement of assets and liabilities denominated in foreign currencies, net of impacts of
our foreign currency instruments used to hedge our balance sheet exposures.
C. Eliminates the non-cash, non-service cost components of long-term employee benefit costs.
D. Represents expenses primarily related to employee termination benefits and other employee-related costs associated with our Axalta Way initiatives, which
are not considered indicative of our ongoing operating performance.
E. Represents fees paid to consultants for professional services primarily related to our Axalta Way initiatives, which are not considered indicative of our
ongoing operating performance.
F. Represents integration costs related to the acquisition of the Industrial Wood business that was a carve-out business from Valspar. These amounts are not
considered indicative of our ongoing operating performance.
G. Represents acquisition-related expenses, including changes in the fair value of contingent consideration, as well as costs associated with the 2016
secondary offerings of our common shares by Carlyle, both of which are not considered indicative of our ongoing operating performance.
H. Represents non-cash costs associated with stock-based compensation.
I. Represents costs for certain non-operational or non-cash (gains) and losses unrelated to our core business and which we do not consider indicative of
ongoing operations, including equity investee dividends, indemnity losses (gains) associated with the Acquisition, losses (gains) on sale and disposal of
property, plant and equipment, losses (gains) on the remaining foreign currency derivative instruments and non-cash fair value inventory adjustments
associated with our business combinations.
J. Represents the payment of dividends to our joint venture partners by our consolidated entities that are not wholly owned, which are reflected to show cash
operating performance of these entities on Axalta’s financial statements.
K. As a result of currency devaluations in Venezuela, during the year ended December 31, 2016, we recorded non-cash impairment charges relating to a real
estate investment for $11 million and long-lived assets for $58 million. In conjunction with the deconsolidation of our Venezuelan subsidiary during 2Q 2017,
we recorded a loss on deconsolidation of $71 million. In addition, during 2Q 2017, we recorded non-cash impairment charges related to a manufacturing
facility previously announced for closure of $3 million. We do not consider these to be indicative of our ongoing operating performance.
AXALTA COATING SYSTEMS
Adjusted Net Income Reconciliation
Note: Numbers might not foot due to rounding.
14
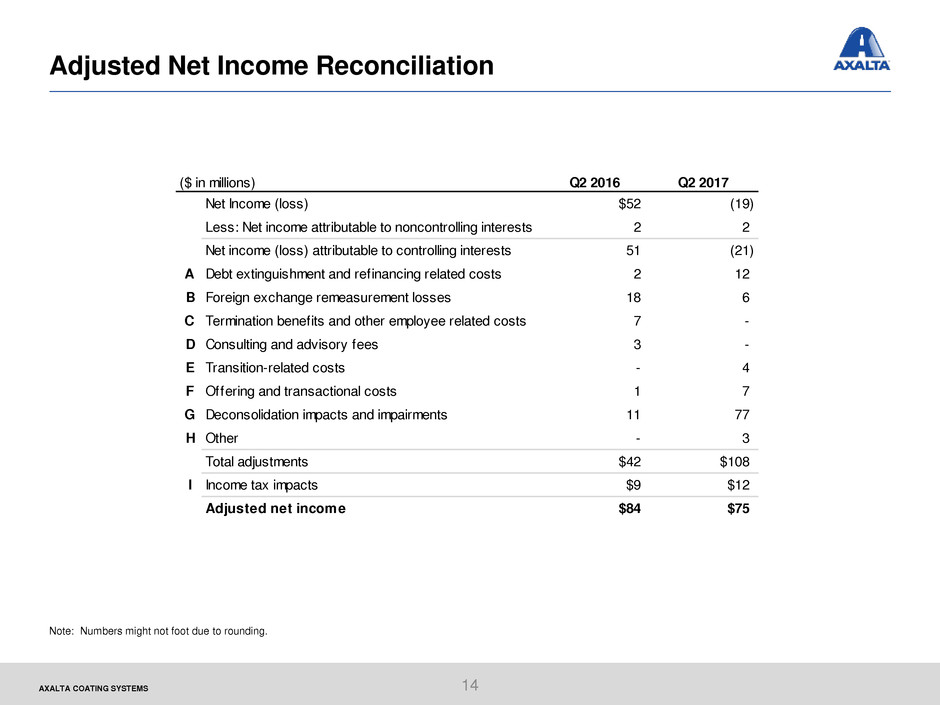
($ in millions) Q2 2016 Q2 2017
Net Income (loss) $52 (19)
Less: Net income attributable to noncontrolling interests 2 2
Net income (loss) attributable to controlling interests 51 (21)
A Debt extinguishment and refinancing related costs 2 12
B Foreign exchange remeasurement losses 18 6
C Termination benefits and other employee related costs 7 -
D Consulting and advisory fees 3 -
E Transition-related costs - 4
F Offering and transactional costs 1 7
G Deconsolidation impacts and impairments 11 77
H Other - 3
Total adjustments $42 $108
I Income tax impacts $9 $12
Adjusted net income $84 $75
AXALTA COATING SYSTEMS
Adjusted Net Income Reconciliation (cont’d)
15
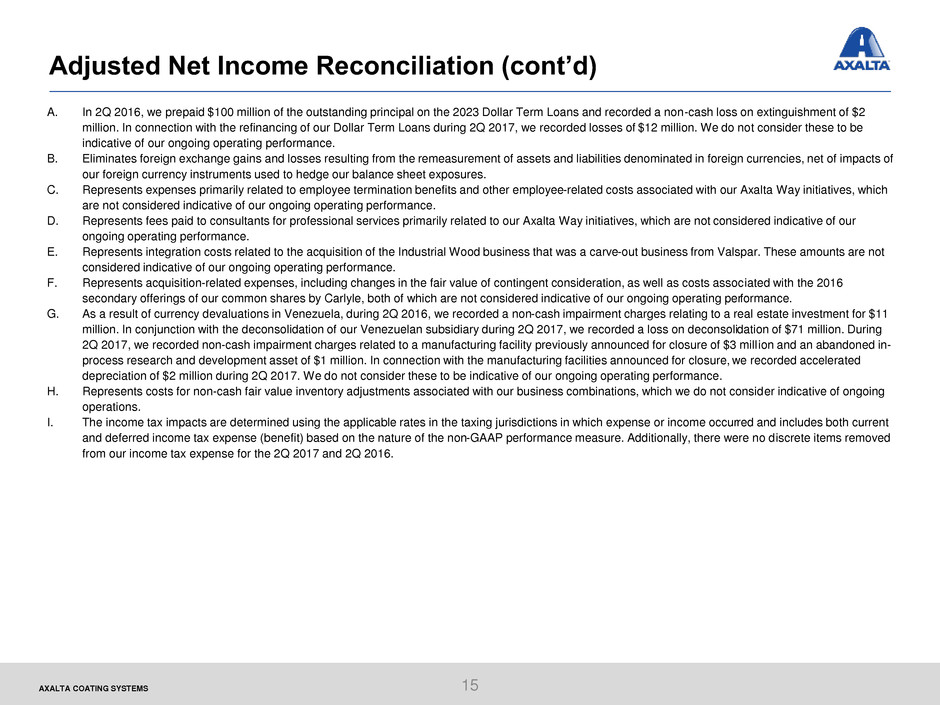
A. In 2Q 2016, we prepaid $100 million of the outstanding principal on the 2023 Dollar Term Loans and recorded a non-cash loss on extinguishment of $2
million. In connection with the refinancing of our Dollar Term Loans during 2Q 2017, we recorded losses of $12 million. We do not consider these to be
indicative of our ongoing operating performance.
B. Eliminates foreign exchange gains and losses resulting from the remeasurement of assets and liabilities denominated in foreign currencies, net of impacts of
our foreign currency instruments used to hedge our balance sheet exposures.
C. Represents expenses primarily related to employee termination benefits and other employee-related costs associated with our Axalta Way initiatives, which
are not considered indicative of our ongoing operating performance.
D. Represents fees paid to consultants for professional services primarily related to our Axalta Way initiatives, which are not considered indicative of our
ongoing operating performance.
E. Represents integration costs related to the acquisition of the Industrial Wood business that was a carve-out business from Valspar. These amounts are not
considered indicative of our ongoing operating performance.
F. Represents acquisition-related expenses, including changes in the fair value of contingent consideration, as well as costs associated with the 2016
secondary offerings of our common shares by Carlyle, both of which are not considered indicative of our ongoing operating performance.
G. As a result of currency devaluations in Venezuela, during 2Q 2016, we recorded a non-cash impairment charges relating to a real estate investment for $11
million. In conjunction with the deconsolidation of our Venezuelan subsidiary during 2Q 2017, we recorded a loss on deconsolidation of $71 million. During
2Q 2017, we recorded non-cash impairment charges related to a manufacturing facility previously announced for closure of $3 mill ion and an abandoned in-
process research and development asset of $1 million. In connection with the manufacturing facilities announced for closure, we recorded accelerated
depreciation of $2 million during 2Q 2017. We do not consider these to be indicative of our ongoing operating performance.
H. Represents costs for non-cash fair value inventory adjustments associated with our business combinations, which we do not consider indicative of ongoing
operations.
I. The income tax impacts are determined using the applicable rates in the taxing jurisdictions in which expense or income occurred and includes both current
and deferred income tax expense (benefit) based on the nature of the non-GAAP performance measure. Additionally, there were no discrete items removed
from our income tax expense for the 2Q 2017 and 2Q 2016.

Thank you
Investor Relations Contact:
Chris Mecray
Christopher.Mecray@axaltacs.com
215-255-7970