EXHIBIT 99.2
Published on March 8, 2018
2018 Capital Markets Day
March 8, 2018
Axalta Coating Systems Ltd.
Exhibit 99.2
2P R O P R I E T A R Y
Legal Notices
Forward-Looking Statements
This presentation and the oral remarks made in connection herewith may contain “forward-looking statements” within the meaning of the U.S. Private Securities Litigation Reform Act of 1995, including those relating to 2018
and longer term financial projections and goals, including with respect to net sales, constant currency net sales, Adjusted EBITDA, Adjusted EBITDA margins, free cash flow, return on invested capital, capital expenditures,
working capital, cost savings, pricing actions, product launches, acquisition opportunities, share repurchases, raw material cost increases, currency effects, and related assumptions. Any forward-looking statements involve
risks, uncertainties and assumptions. These statements often include words such as “believe,” “expect,” “anticipate,” “intend,” “plan,” “estimate,” “target,” “project,” “forecast,” “seek,” “will,” “may,” “should,” “could,” “would,” or
similar expressions. These statements are based on certain assumptions that we have made in light of our experience in the industry and our perceptions of historical trends, current conditions, expected future developments
and other factors we believe are appropriate under the circumstances as of the date hereof. Although we believe that the assumptions and analysis underlying these statements are reasonable as of the date hereof, investors
are cautioned not to place undue reliance on these statements. We do not have any obligation to and do not intend to update any forward-looking statements included herein, which speak only as of the date hereof. You
should understand that these statements are not guarantees of future performance or results. Actual results could differ materially from those described in any forward-looking statements contained herein or the oral remarks
made in connection herewith as a result of a variety of factors, including known and unknown risks and uncertainties, many of which are beyond our control including, but not limited to, the risks and uncertainties described in
"Non-GAAP Financial Measures," and "Forward-Looking Statements" as well as "Risk Factors" in our Annual Report on Form 10-K for the year ended December 31, 2017.
Non-GAAP Financial Measures
The historical financial information included in this presentation includes financial information that is not presented in accordance with generally accepted accounting principles in the United States (“GAAP”), including
constant currency net sales, EBITDA, Adjusted EBITDA, Free Cash Flow and Net Debt. Management uses these non-GAAP financial measures in the analysis of our financial and operating performance because they assist
in the evaluation of underlying trends in our business. Adjusted EBITDA consists of EBITDA adjusted for (i) non-cash items included within net income, (ii) items Axalta does not believe are indicative of ongoing operating
performance or (iii) nonrecurring, unusual or infrequent items that have not occurred within the last two years or Axalta believes are not reasonably likely to recur within the next two years. We believe that making such
adjustments provides investors meaningful information to understand our operating results and ability to analyze financial and business trends on a period-to-period basis. Our use of the terms net constant currency net
sales, EBITDA, Adjusted EBITDA, Free Cash Flow and Net Debt may differ from that of others in our industry. Constant currency net sales, EBITDA, Adjusted EBITDA and Free Cash Flow should not be considered as
alternatives to net sales, net income, operating income or any other performance measures derived in accordance with GAAP as measures of operating performance or operating cash flows or as measures of liquidity.
Constant currency net sales, EBITDA, Adjusted EBITDA, Free Cash Flow and Net Debt have important limitations as analytical tools and should be considered in conjunction with, and not as substitutes for, our results as
reported under GAAP. This presentation includes a reconciliation of certain non-GAAP financial measures with the most directly comparable financial measures calculated in accordance with GAAP. Axalta does not provide a
reconciliation for non-GAAP estimates for constant currency net sales, EBITDA, Adjusted EBITDA or Free Cash Flow on a forward-looking basis because the information necessary to calculate a meaningful or accurate
estimation of reconciling items is not available without unreasonable effort. For example, such reconciling items include the impact of foreign currency exchange gains or losses, gains or losses that are unusual or
nonrecurring in nature, as well as discrete taxable events. We cannot estimate or project those items and they may have a substantial and unpredictable impact on our US GAAP results.
Segment Financial Measures
The primary measure of segment operating performance is Adjusted EBITDA, which is a key metric that is used by management to evaluate business performance in comparison to budgets, forecasts and prior year financial
results, providing a measure that management believes reflects Axalta’s core operating performance. As we do not measure segment operating performance based on Net Income, a reconciliation of this non-GAAP financial
measure with the most directly comparable financial measure calculated in accordance with GAAP is not available.
Defined Terms
All capitalized terms contained within this presentation have been previously defined in our filings with the United States Securities and Exchange Commission.
3P R O P R I E T A R Y
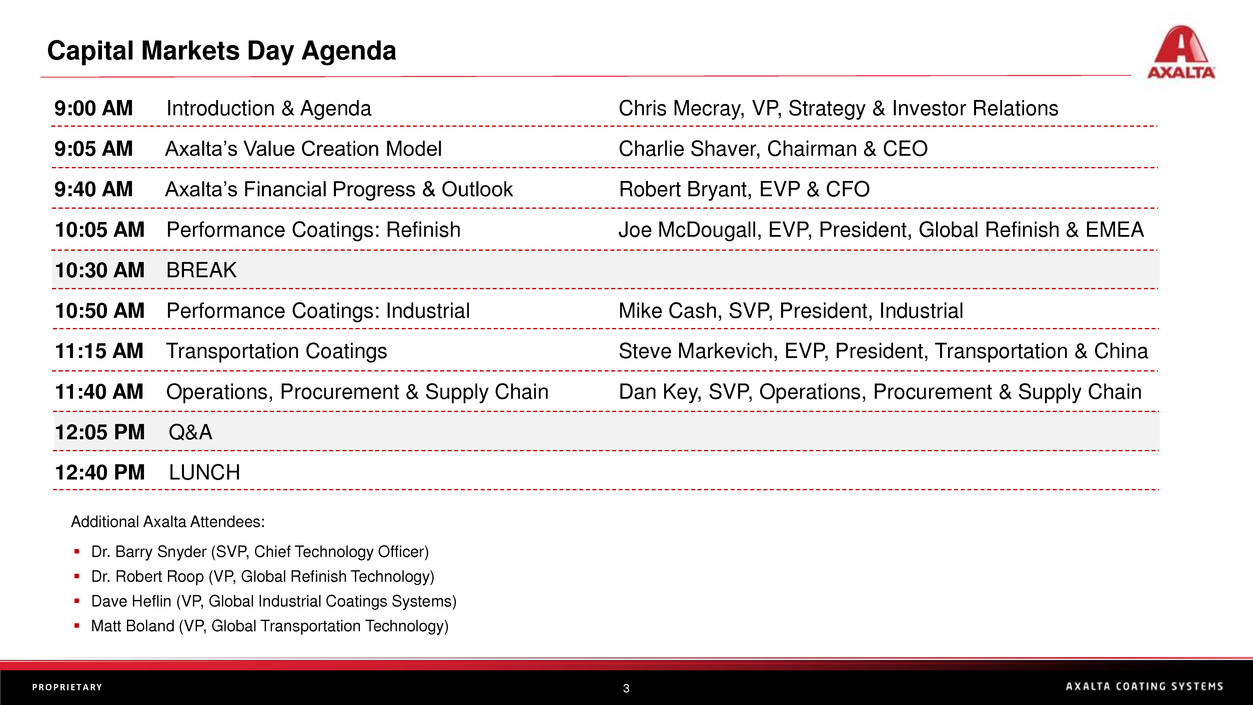
Capital Markets Day Agenda
9:00 AM Introduction & Agenda Chris Mecray, VP, Strategy & Investor Relations
9:05 AM Axalta’s Value Creation Model Charlie Shaver, Chairman & CEO
9:40 AM Axalta’s Financial Progress & Outlook Robert Bryant, EVP & CFO
10:05 AM Performance Coatings: Refinish Joe McDougall, EVP, President, Global Refinish & EMEA
10:30 AM BREAK
10:50 AM Performance Coatings: Industrial Mike Cash, SVP, President, Industrial
11:15 AM Transportation Coatings Steve Markevich, EVP, President, Transportation & China
11:40 AM Operations, Procurement & Supply Chain Dan Key, SVP, Operations, Procurement & Supply Chain
12:05 PM Q&A
12:40 PM LUNCH
▪ Dr. Barry Snyder (SVP, Chief Technology Officer)
▪ Dr. Robert Roop (VP, Global Refinish Technology)
▪ Dave Heflin (VP, Global Industrial Coatings Systems)
▪ Matt Boland (VP, Global Transportation Technology)
Additional Axalta Attendees:
4P R O P R I E T A R Y
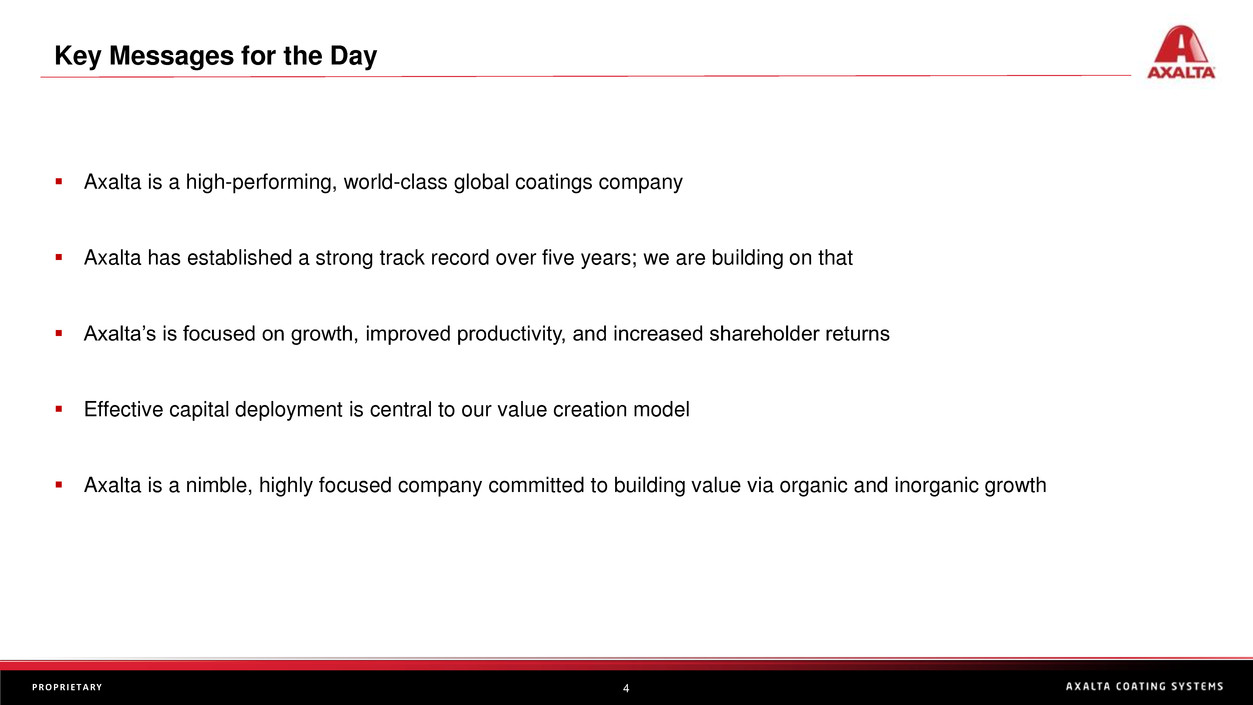
▪ Axalta is a high-performing, world-class global coatings company
▪ Axalta has established a strong track record over five years; we are building on that
▪ Axalta’s is focused on growth, improved productivity, and increased shareholder returns
▪ Effective capital deployment is central to our value creation model
▪ Axalta is a nimble, highly focused company committed to building value via organic and inorganic growth
Key Messages for the Day
Axalta’s Value Creation Model
Charlie Shaver
Chairman and CEO
6P R O P R I E T A R Y
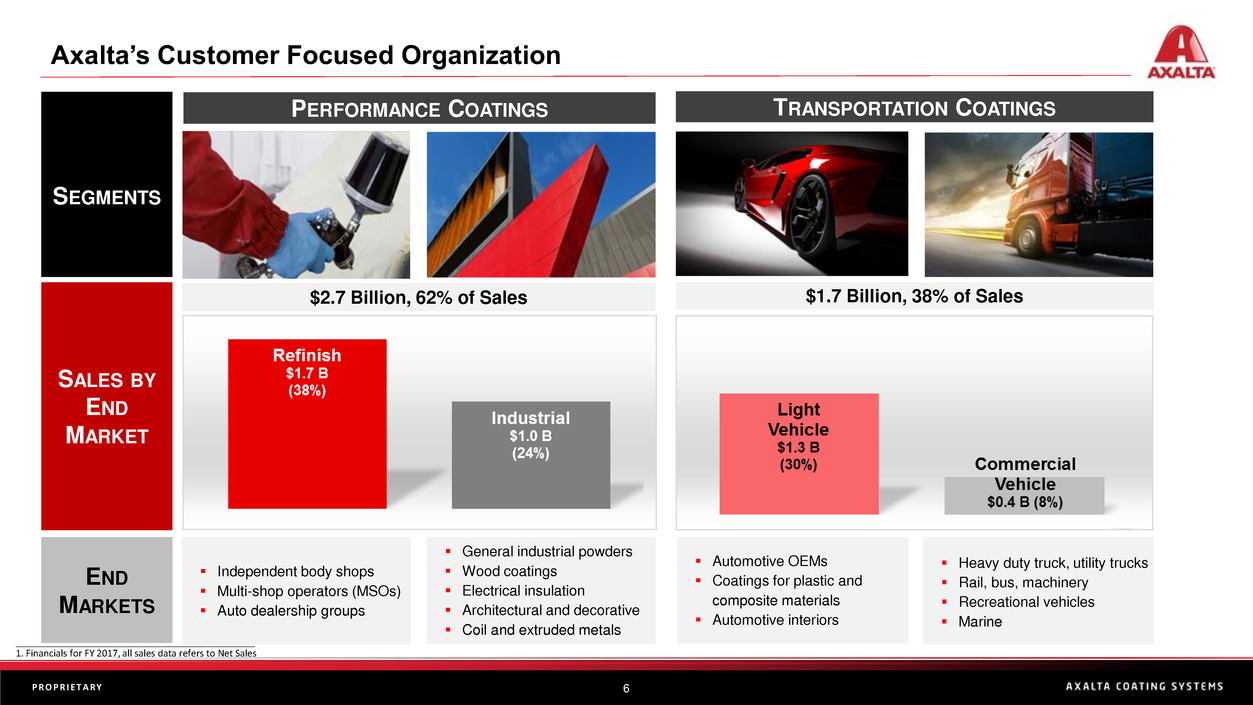
Axalta’s Customer Focused Organization
SEGMENTS
END
MARKETS
▪ Automotive OEMs
▪ Coatings for plastic and
composite materials
▪ Automotive interiors
▪ Heavy duty truck, utility trucks
▪ Rail, bus, machinery
▪ Recreational vehicles
▪ Marine
▪ General industrial powders
▪ Wood coatings
▪ Electrical insulation
▪ Architectural and decorative
▪ Coil and extruded metals
▪ Independent body shops
▪ Multi-shop operators (MSOs)
▪ Auto dealership groups
TRANSPORTATION COATINGSPERFORMANCE COATINGS
$2.7 Billion, 62% of Sales $1.7 Billion, 38% of Sales
SALES BY
END
MARKET
______________________________________________
1. Financials for FY 2017, all sales data refers to Net Sales
7P R O P R I E T A R Y
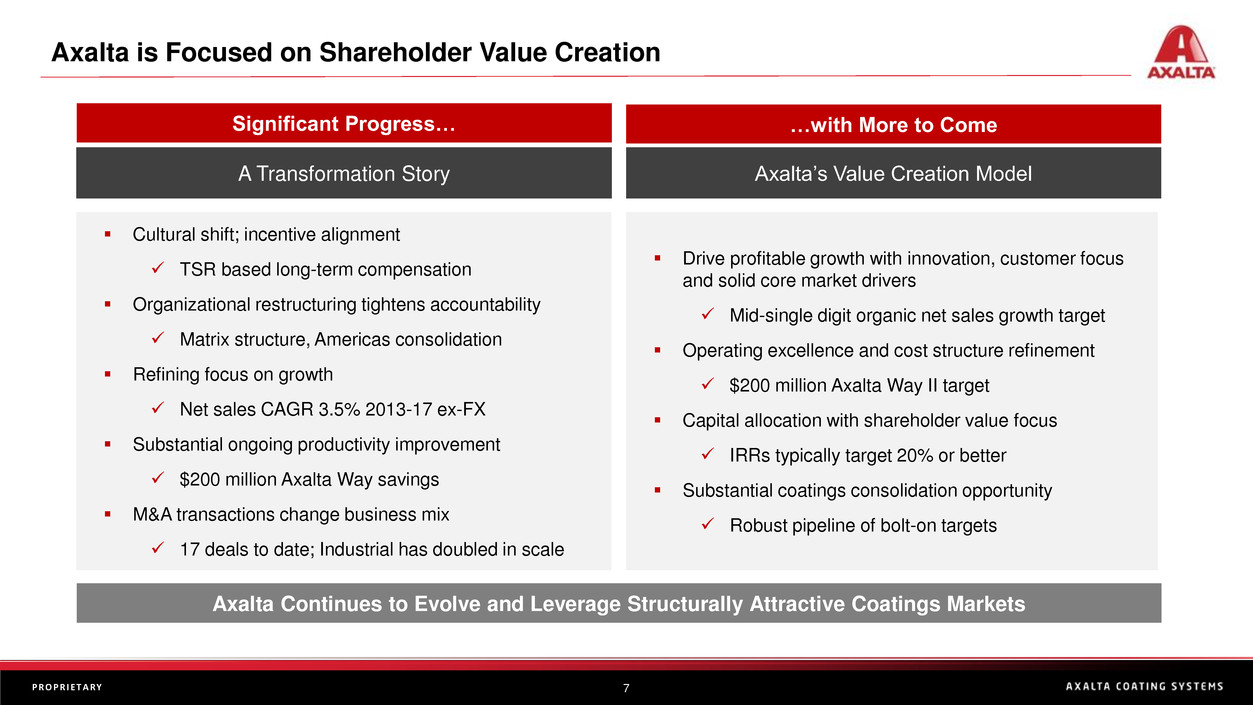
Axalta is Focused on Shareholder Value Creation
Axalta Continues to Evolve and Leverage Structurally Attractive Coatings Markets
Significant Progress…
A Transformation Story
▪ Cultural shift; incentive alignment
✓ TSR based long-term compensation
▪ Organizational restructuring tightens accountability
✓ Matrix structure, Americas consolidation
▪ Refining focus on growth
✓ Net sales CAGR 3.5% 2013-17 ex-FX
▪ Substantial ongoing productivity improvement
✓ $200 million Axalta Way savings
▪ M&A transactions change business mix
✓ 17 deals to date; Industrial has doubled in scale
Axalta’s Value Creation Model
…with More to Come
▪ Drive profitable growth with innovation, customer focus
and solid core market drivers
✓ Mid-single digit organic net sales growth target
▪ Operating excellence and cost structure refinement
✓ $200 million Axalta Way II target
▪ Capital allocation with shareholder value focus
✓ IRRs typically target 20% or better
▪ Substantial coatings consolidation opportunity
✓ Robust pipeline of bolt-on targets
8P R O P R I E T A R Y
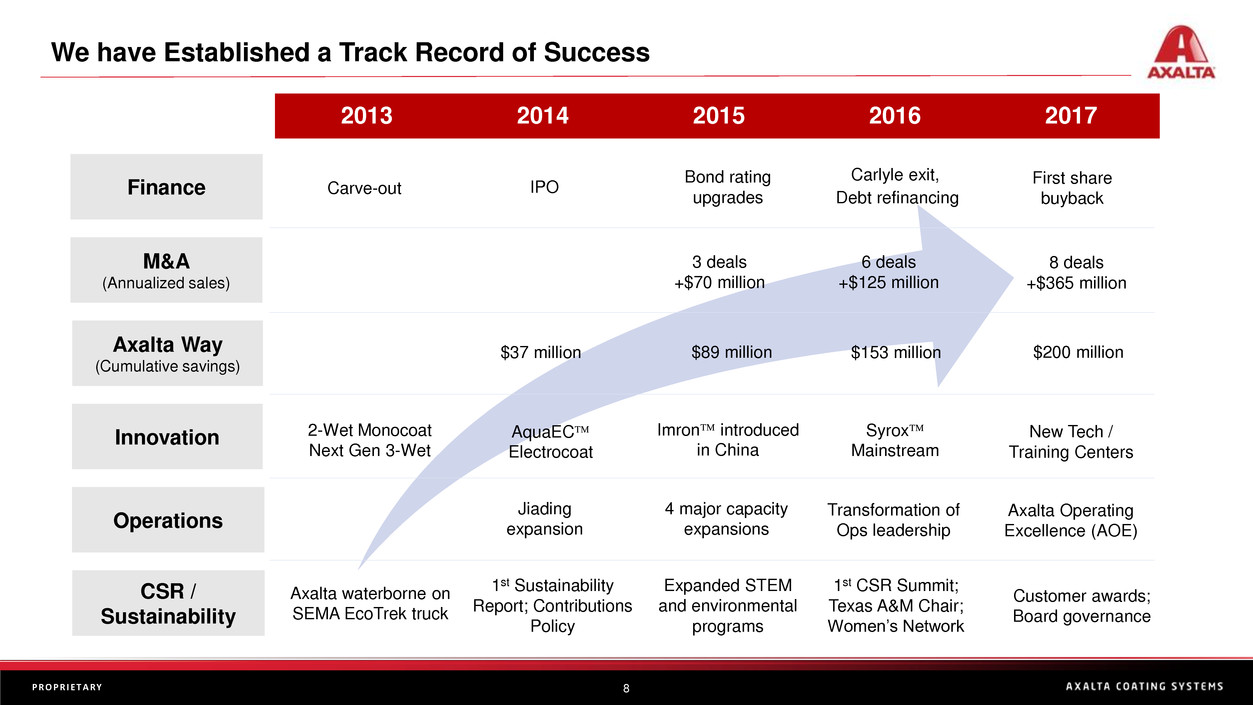
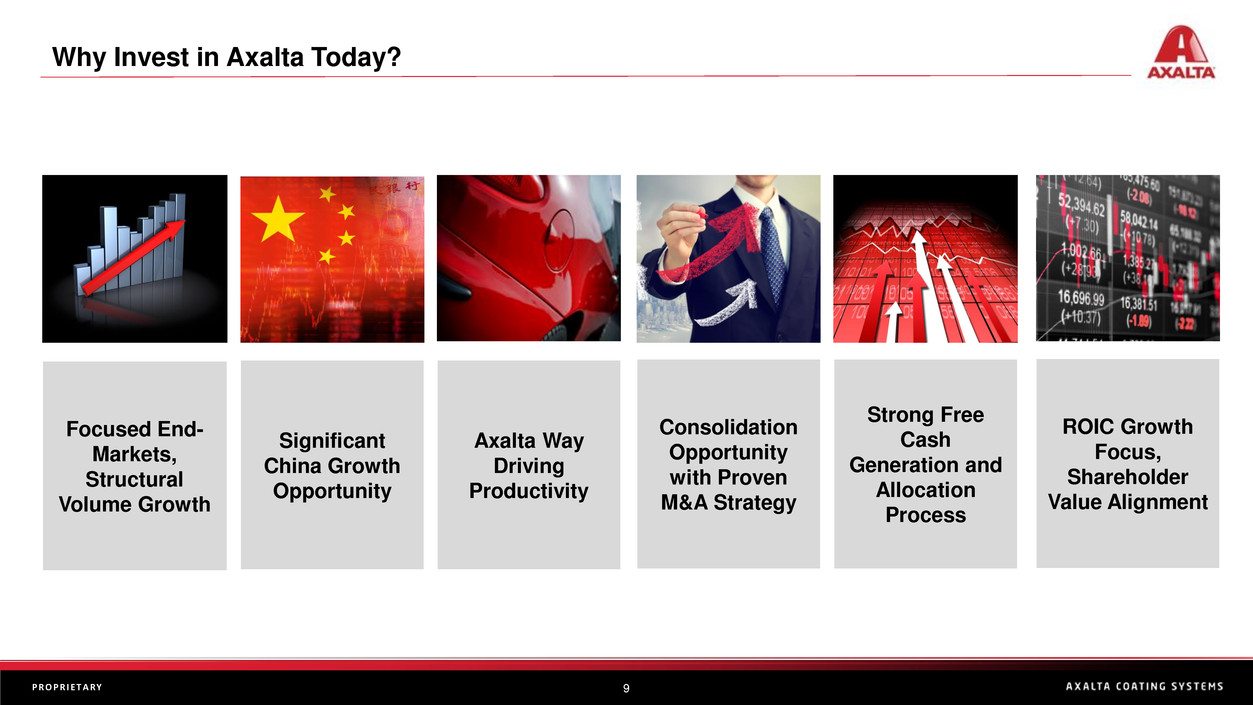
We have Established a Track Record of Success
Finance
M&A
(Annualized sales)
Operations
Axalta Way
(Cumulative savings)
Innovation
CSR /
Sustainability
2013 2014 2015 2016 2017
Carve-out IPO
Debt refinancing
Carlyle exit, First share
buyback
Axalta waterborne on
SEMA EcoTrek truck
1st Sustainability
Report; Contributions
Policy
Expanded STEM
and environmental
programs
Customer awards;
Board governance
3 deals
+$70 million
6 deals
+$125 million
8 deals
+$365 million
$37 million
2-Wet Monocoat
Next Gen 3-Wet
Imron introduced
in China
AquaEC
Electrocoat
Syrox
Mainstream
New Tech /
Training Centers
Jiading
expansion
4 major capacity
expansions
Axalta Operating
Excellence (AOE)
Transformation of
Ops leadership
1st CSR Summit;
Texas A&M Chair;
Women’s Network
$89 million $153 million $200 million
Bond rating
upgrades
9P R O P R I E T A R Y
Significant
China Growth
Opportunity
Focused End-
Markets,
Structural
Volume Growth
Axalta Way
Driving
Productivity
Why Invest in Axalta Today?
Consolidation
Opportunity
with Proven
M&A Strategy
Strong Free
Cash
Generation and
Allocation
Process
ROIC Growth
Focus,
Shareholder
Value Alignment
10P R O P R I E T A R Y
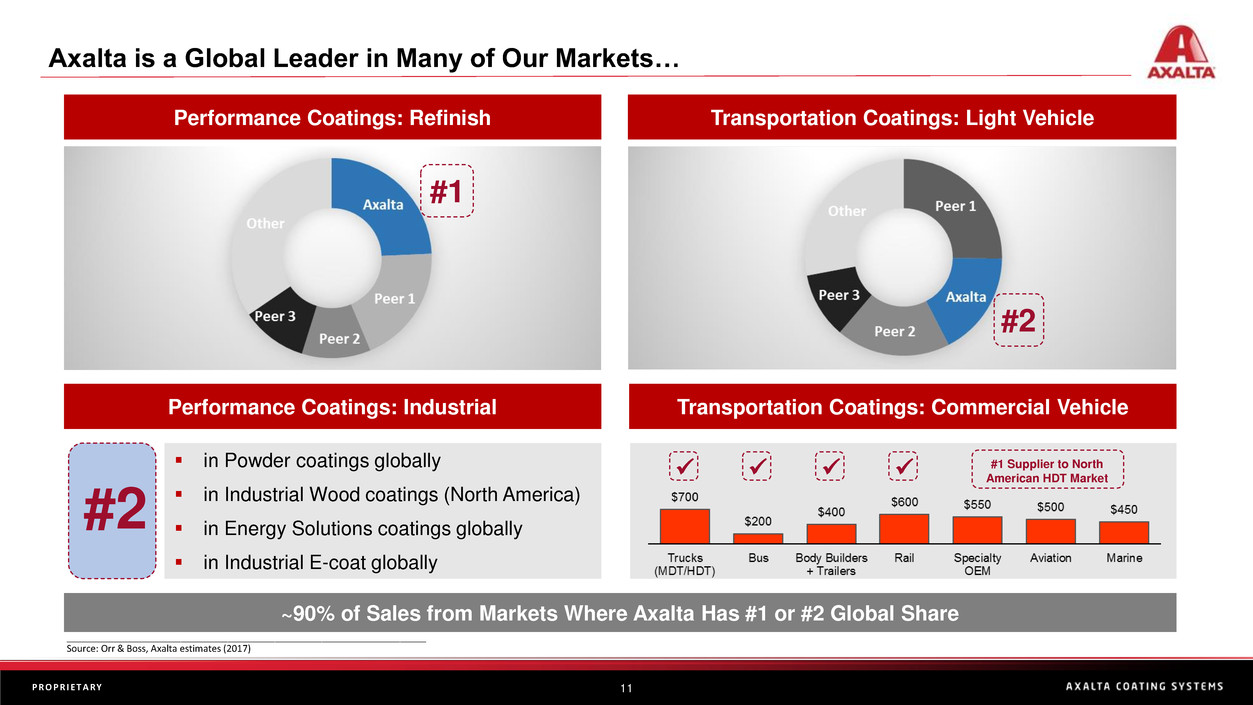
We are Focused on Structurally Attractive Coatings End-Markets
A $130 Billion Global Coatings Market
Long Term Alignment With Global Growth
Axalta’s Coatings Markets
Commercial
Vehicle
Light
Vehicle
Refinish
Industrial
5.2%
3.9%
2.9%
2.7%
CAGR
Coatings Industry Sales
($ Billions)
_____________________________
Source: Orr & Boss (2017), Axalta estimates
____________________
Source: Axalta estimates
Coatings Industry Sales
11P R O P R I E T A R Y
#1 Supplier to North
American HDT Market
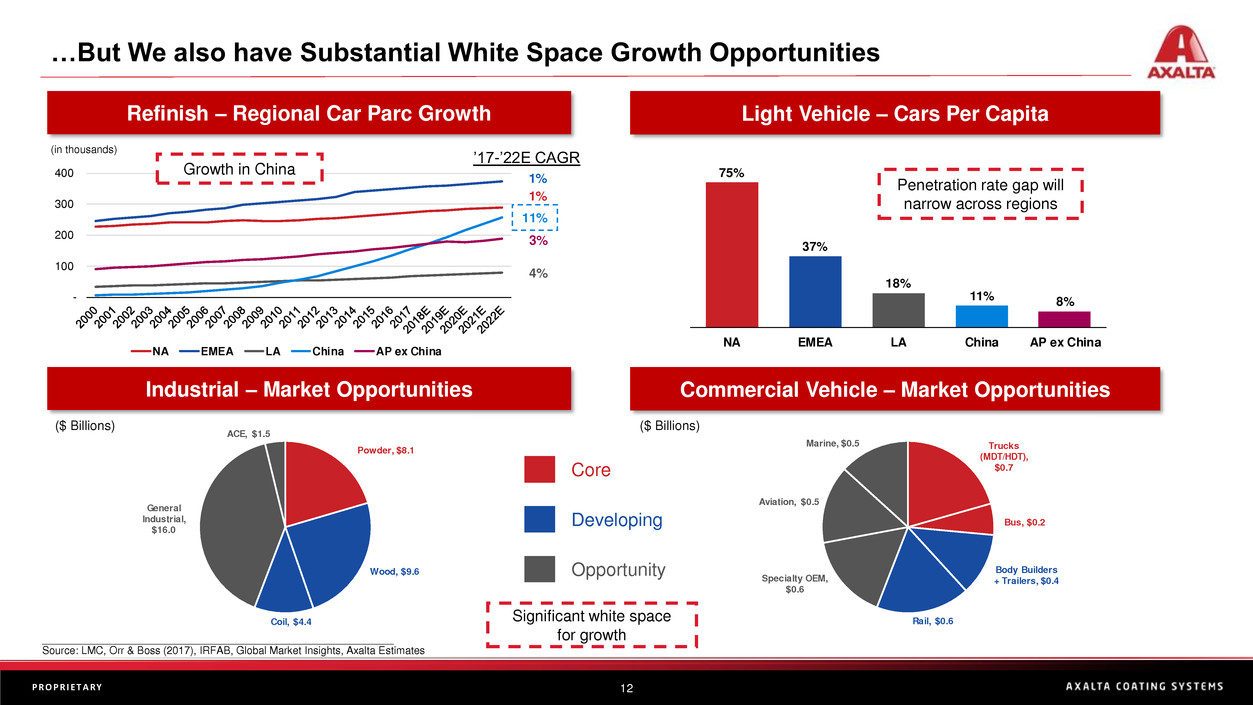
Axalta is a Global Leader in Many of Our Markets…
~90% of Sales from Markets Where Axalta Has #1 or #2 Global Share
Performance Coatings: Refinish Transportation Coatings: Light Vehicle
#1
_____________________________________________________________________
Source: Orr & Boss, Axalta estimates (2017)
#2
Performance Coatings: Industrial Transportation Coatings: Commercial Vehicle
▪ in Powder coatings globally
▪ in Industrial Wood coatings (North America)
▪ in Energy Solutions coatings globally
▪ in Industrial E-coat globally
#2
✓ ✓✓✓
12P R O P R I E T A R Y
75%
37%
18%
11% 8%
NA EMEA LA China AP ex China
…But We also have Substantial White Space Growth Opportunities
Refinish – Regional Car Parc Growth Light Vehicle – Cars Per Capita
Industrial – Market Opportunities
-
100
200
300
400
NA EMEA LA China AP ex China
’17-’22E CAGR
1%
1%
11%
3%
4%
(in thousands)
Commercial Vehicle – Market Opportunities
Core
Developing
Opportunity
Penetration rate gap will
narrow across regions
Growth in China
Significant white space
for growth____________________________________________________________
Source: LMC, Orr & Boss (2017), IRFAB, Global Market Insights, Axalta Estimates
Powder, $8.1
Wood, $9.6
Coil, $4.4
General
Industrial,
$16.0
ACE, $1.5
Trucks
(MDT/HDT),
$0.7
Bus, $0.2
Body Builders
+ Trailers, $0.4
Rail, $0.6
Specialty OEM,
$0.6
Aviation, $0.5
Marine, $0.5
($ Billions) ($ Billions)
13P R O P R I E T A R Y
Refinish Offers Both Demand Stability and Global Growth Opportunity
Market Share Product Breadth
Customer Consolidation Axalta Is Growing Global Refinish
Strong Momentum Driven by Customer-Centric Approach
Premium
Mainstream
Economy
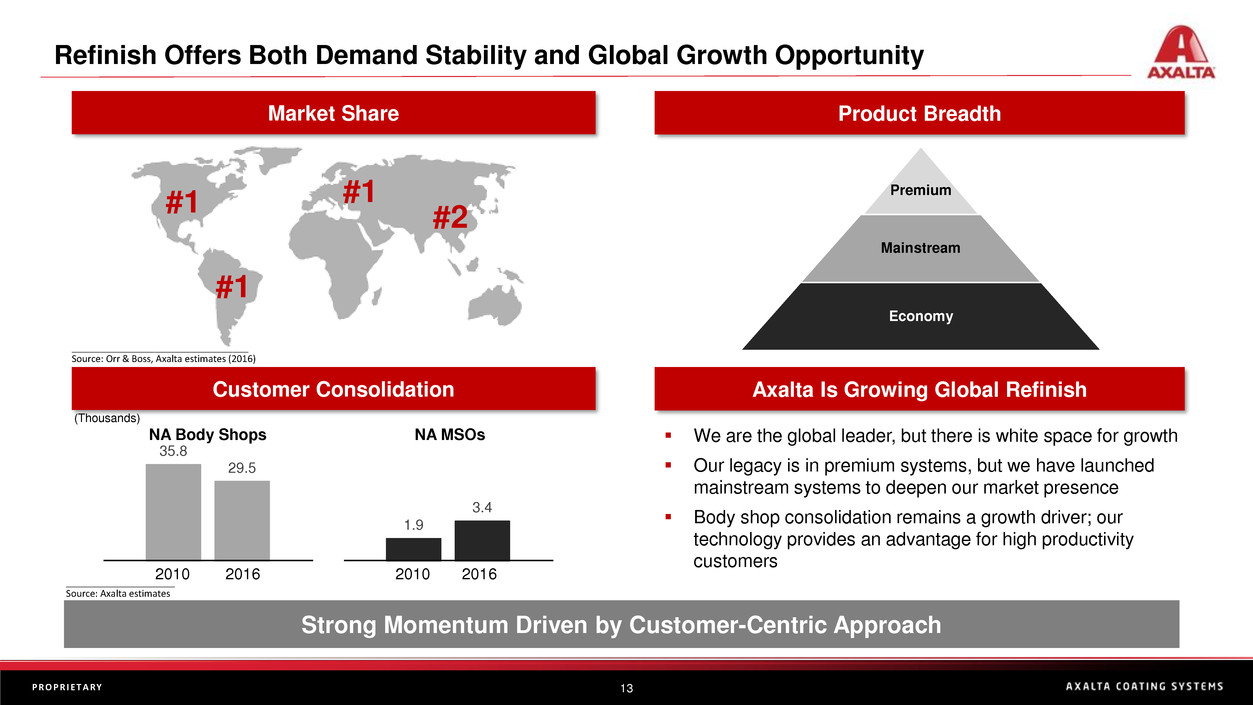
▪ We are the global leader, but there is white space for growth
▪ Our legacy is in premium systems, but we have launched
mainstream systems to deepen our market presence
▪ Body shop consolidation remains a growth driver; our
technology provides an advantage for high productivity
customers
#1
__________________________________
Source: Orr & Boss, Axalta estimates (2016)
#1
#1
#2
35.8
29.5
2010 2016
1.9
3.4
2010 2016
NA Body Shops NA MSOs
_____________________
Source: Axalta estimates
(Thousands)
14P R O P R I E T A R Y
Industrial Coating
Systems
Axalta’s Industrial End-Market is Rapidly Growing with Focused Strategies
Growth from Leveraging our Regional Product Portfolio Globally
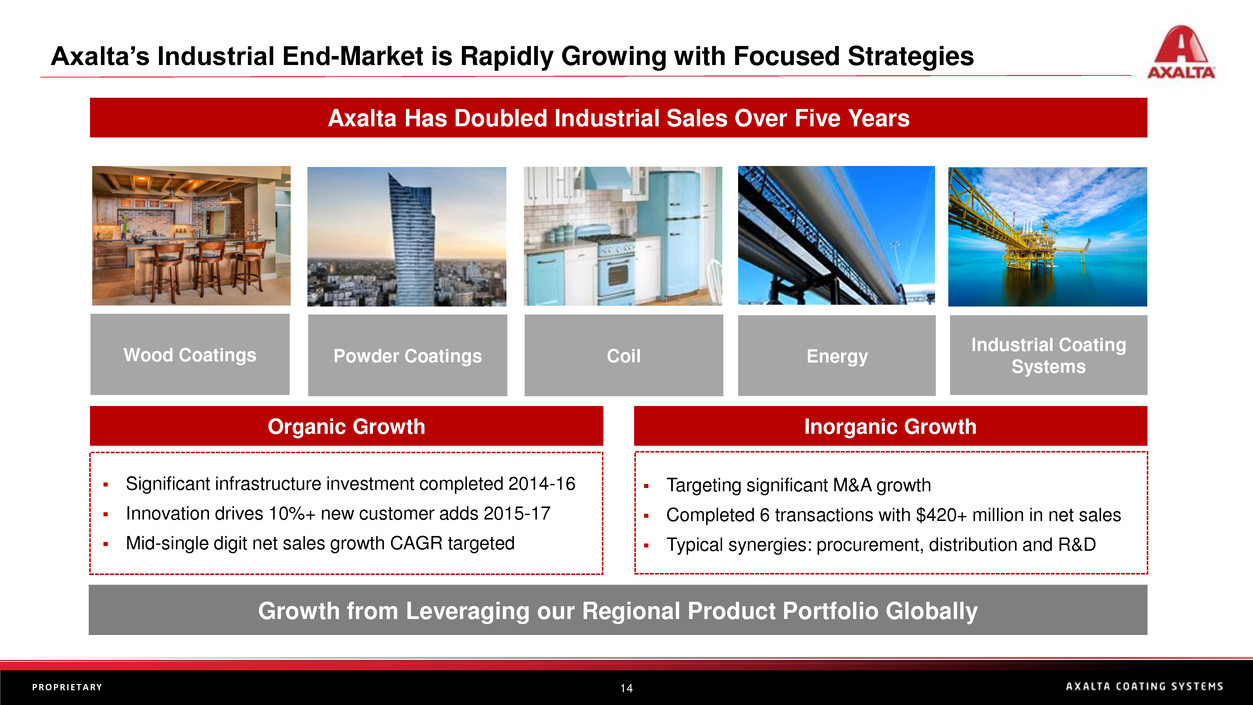
▪ Significant infrastructure investment completed 2014-16
▪ Innovation drives 10%+ new customer adds 2015-17
▪ Mid-single digit net sales growth CAGR targeted
Axalta Has Doubled Industrial Sales Over Five Years
Powder Coatings EnergyCoilWood Coatings
Organic Growth Inorganic Growth
▪ Targeting significant M&A growth
▪ Completed 6 transactions with $420+ million in net sales
▪ Typical synergies: procurement, distribution and R&D
15P R O P R I E T A R Y
Our Commercial Vehicle Business is Growing and Diverse
Strong Momentum Driven by Customer-Centric Approach
Market White Space Share Gain Technology
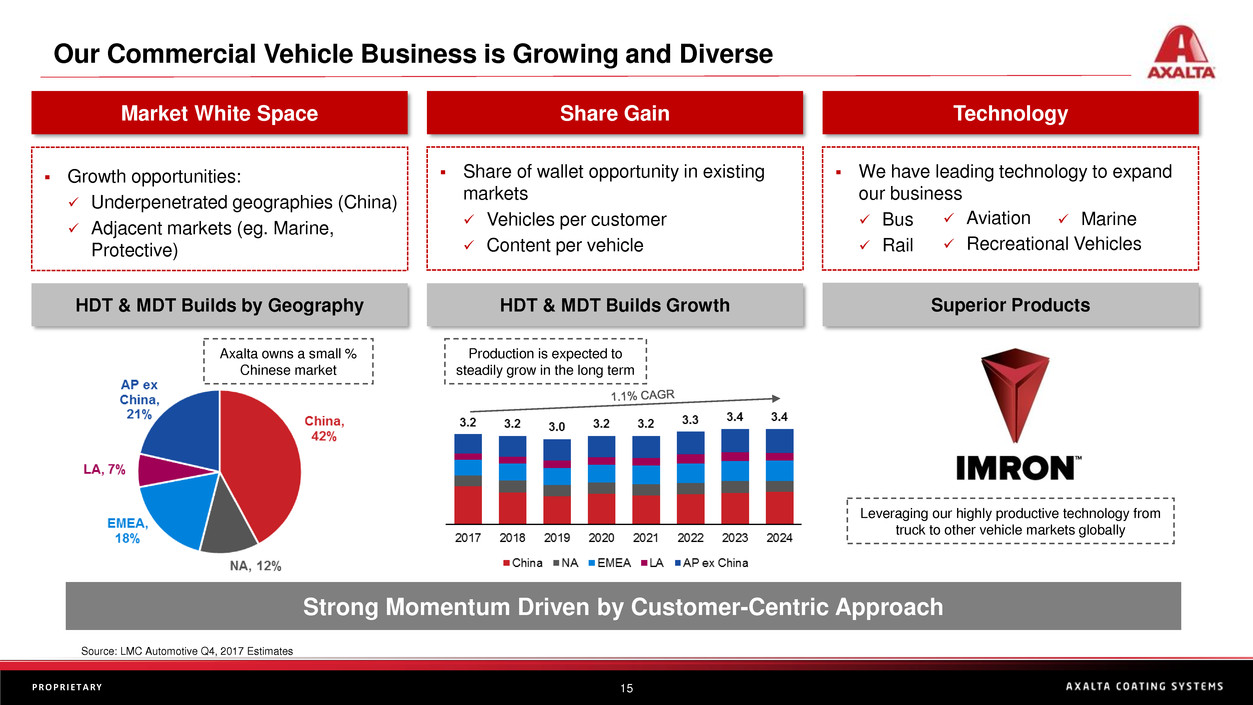
▪ Growth opportunities:
✓ Underpenetrated geographies (China)
✓ Adjacent markets (eg. Marine,
Protective)
▪ Share of wallet opportunity in existing
markets
✓ Vehicles per customer
✓ Content per vehicle
▪ We have leading technology to expand
our business
✓ Bus
✓ Rail
Axalta owns a small %
Chinese market
HDT & MDT Builds by Geography
Source: LMC Automotive Q4, 2017 Estimates
HDT & MDT Builds Growth
Production is expected to
steadily grow in the long term
Superior Products
✓ Aviation
✓ Recreational Vehicles
✓ Marine
Leveraging our highly productive technology from
truck to other vehicle markets globally
16P R O P R I E T A R Y
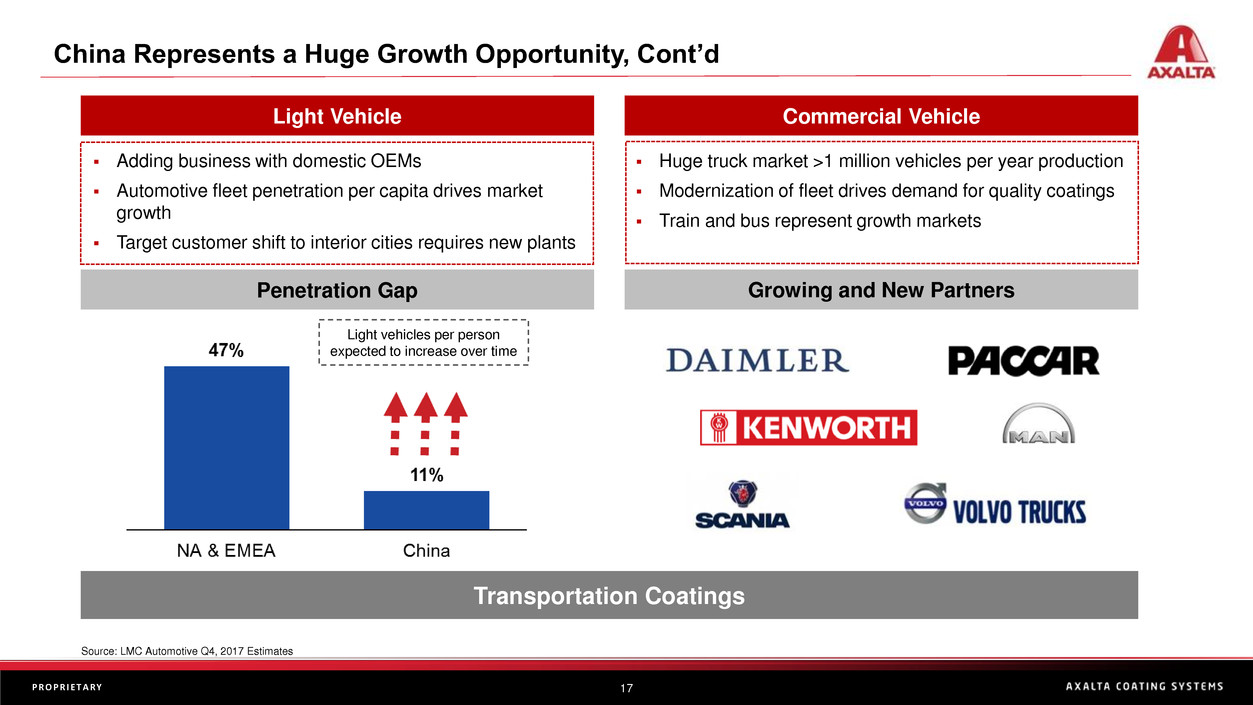
China Represents a Huge Growth Opportunity
Performance Coatings
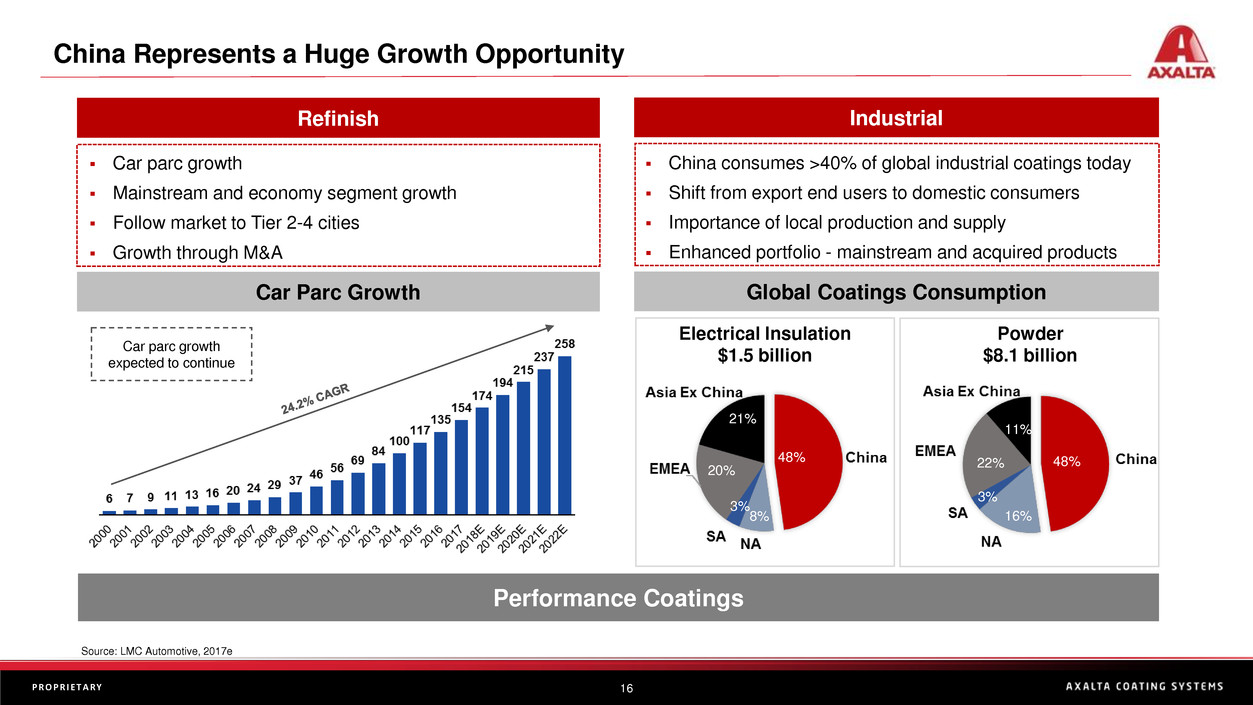
▪ Car parc growth
▪ Mainstream and economy segment growth
▪ Follow market to Tier 2-4 cities
▪ Growth through M&A
Refinish Industrial
▪ China consumes >40% of global industrial coatings today
▪ Shift from export end users to domestic consumers
▪ Importance of local production and supply
▪ Enhanced portfolio - mainstream and acquired products
Car Parc Growth Global Coatings Consumption
Source: LMC Automotive, 2017e
Car parc growth
expected to continue
Electrical Insulation
$1.5 billion
Powder
$8.1 billion
48%
11%
22%
16%
3%
48%
20%
3%
8%
21%
17P R O P R I E T A R Y
China Represents a Huge Growth Opportunity, Cont’d
Transportation Coatings
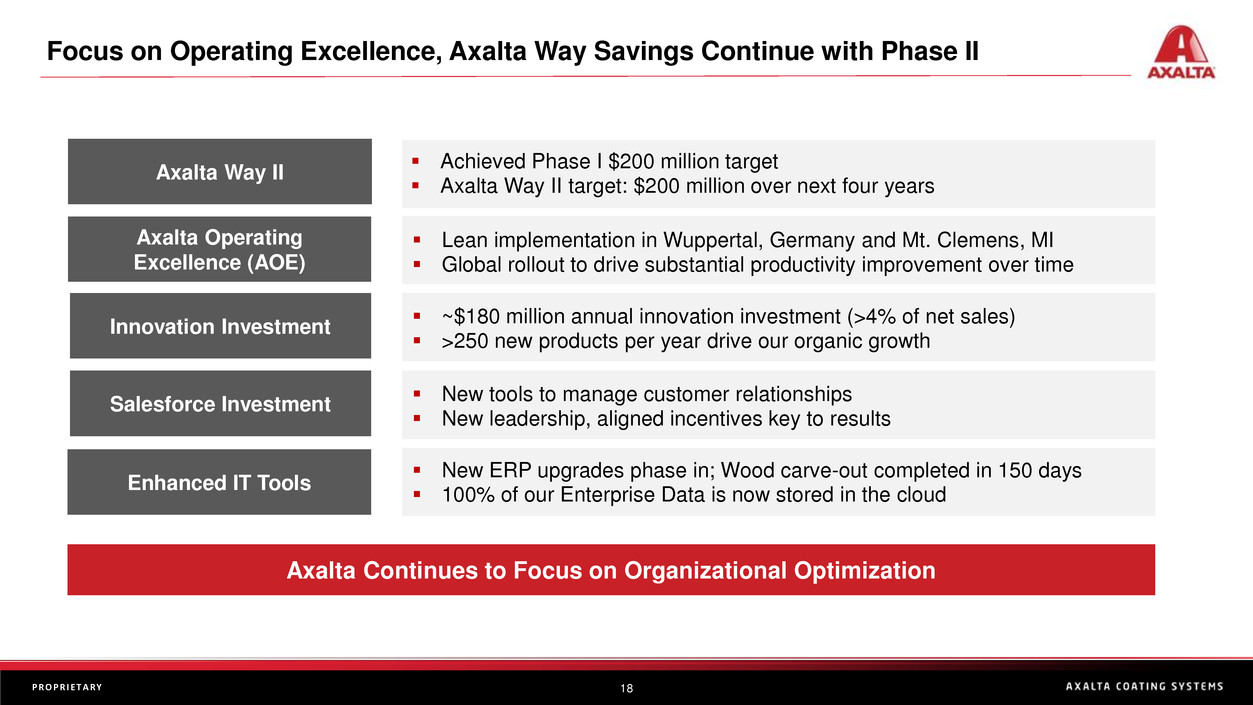
▪ Adding business with domestic OEMs
▪ Automotive fleet penetration per capita drives market
growth
▪ Target customer shift to interior cities requires new plants
Light Vehicle Commercial Vehicle
▪ Huge truck market >1 million vehicles per year production
▪ Modernization of fleet drives demand for quality coatings
▪ Train and bus represent growth markets
Penetration Gap Growing and New Partners
Source: LMC Automotive Q4, 2017 Estimates
Light vehicles per person
expected to increase over time
18P R O P R I E T A R Y
Focus on Operating Excellence, Axalta Way Savings Continue with Phase II
Axalta Continues to Focus on Organizational Optimization
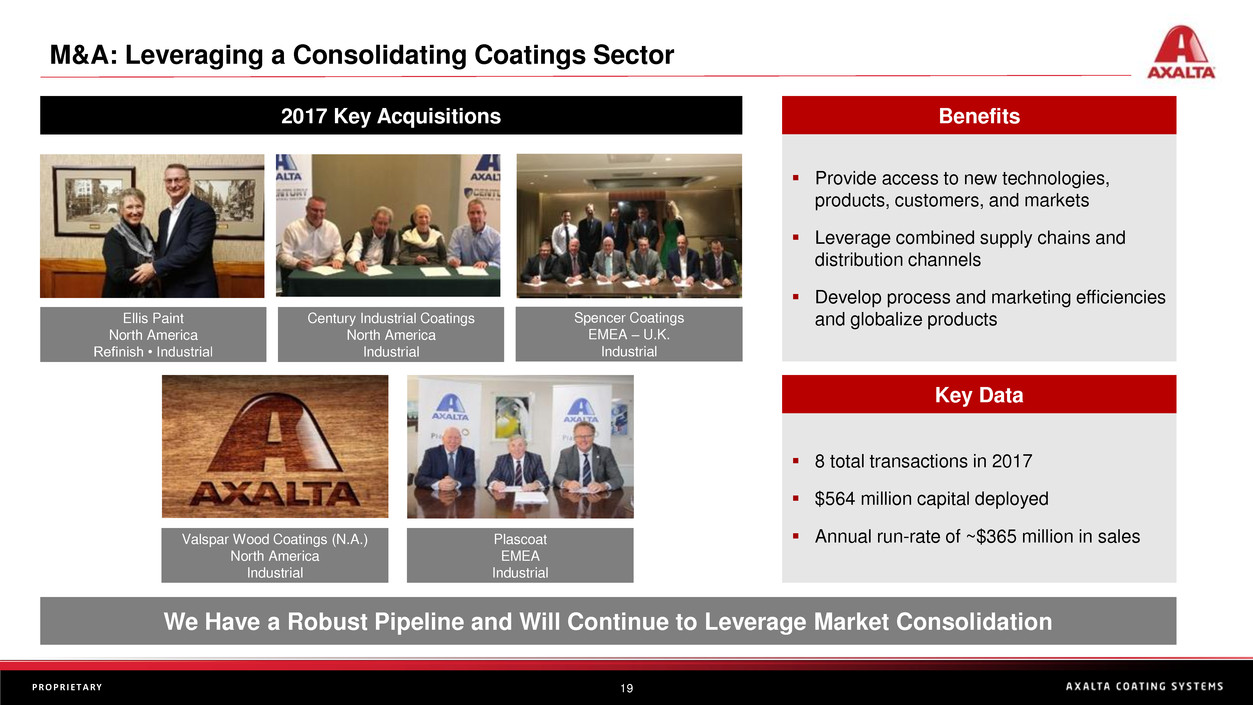
Axalta Way II
Axalta Operating
Excellence (AOE)
Enhanced IT Tools
Innovation Investment
Salesforce Investment
▪ Achieved Phase I $200 million target
▪ Axalta Way II target: $200 million over next four years
▪ Lean implementation in Wuppertal, Germany and Mt. Clemens, MI
▪ Global rollout to drive substantial productivity improvement over time
▪ ~$180 million annual innovation investment (>4% of net sales)
▪ >250 new products per year drive our organic growth
▪ New tools to manage customer relationships
▪ New leadership, aligned incentives key to results
▪ New ERP upgrades phase in; Wood carve-out completed in 150 days
▪ 100% of our Enterprise Data is now stored in the cloud
19P R O P R I E T A R Y
Valspar Wood Coatings (N.A.)
North America
Industrial
Spencer Coatings
EMEA – U.K.
Industrial
Plascoat
EMEA
Industrial
M&A: Leveraging a Consolidating Coatings Sector
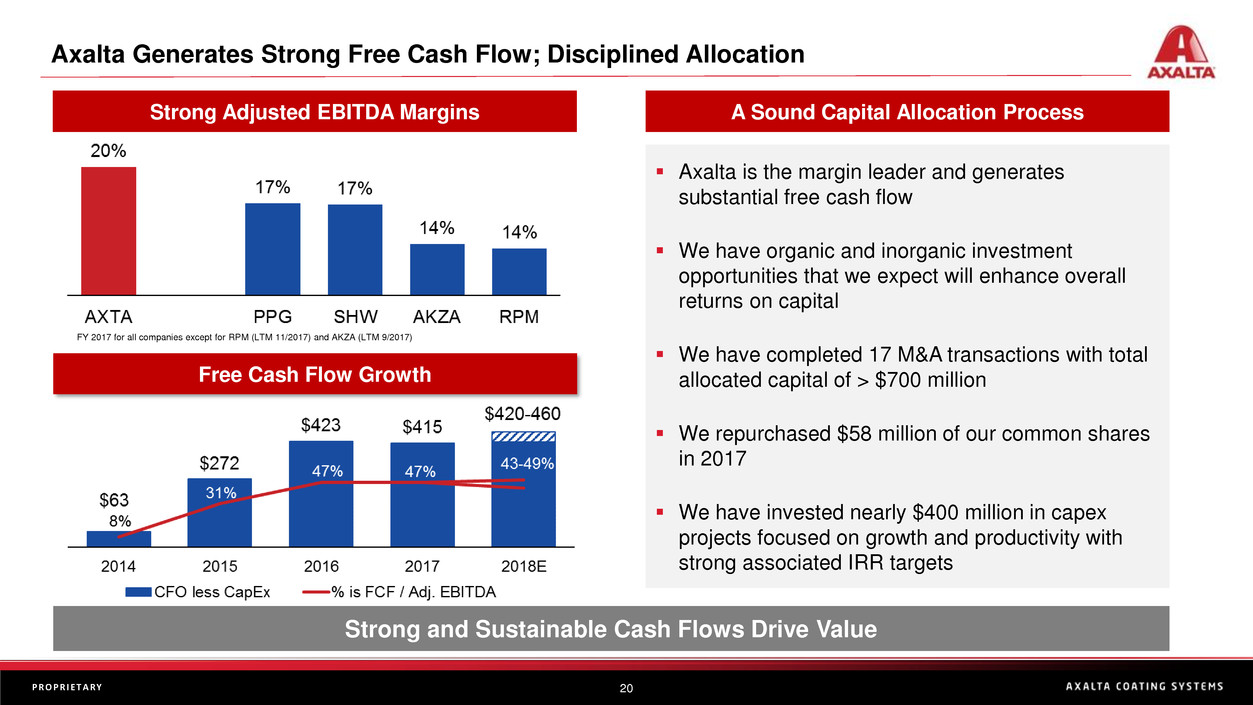
Benefits
▪ Provide access to new technologies,
products, customers, and markets
▪ Leverage combined supply chains and
distribution channels
▪ Develop process and marketing efficiencies
and globalize productsEllis Paint
North America
Refinish • Industrial
2017 Key Acquisitions
Century Industrial Coatings
North America
Industrial
Key Data
▪ 8 total transactions in 2017
▪ $564 million capital deployed
▪ Annual run-rate of ~$365 million in sales
We Have a Robust Pipeline and Will Continue to Leverage Market Consolidation
20P R O P R I E T A R Y
Axalta Generates Strong Free Cash Flow; Disciplined Allocation
Strong and Sustainable Cash Flows Drive Value
Strong Adjusted EBITDA Margins
Free Cash Flow Growth
A Sound Capital Allocation Process
FY 2017 for all companies except for RPM (LTM 11/2017) and AKZA (LTM 9/2017)
▪ Axalta is the margin leader and generates
substantial free cash flow
▪ We have organic and inorganic investment
opportunities that we expect will enhance overall
returns on capital
▪ We have completed 17 M&A transactions with total
allocated capital of > $700 million
▪ We repurchased $58 million of our common shares
in 2017
▪ We have invested nearly $400 million in capex
projects focused on growth and productivity with
strong associated IRR targets
21P R O P R I E T A R Y
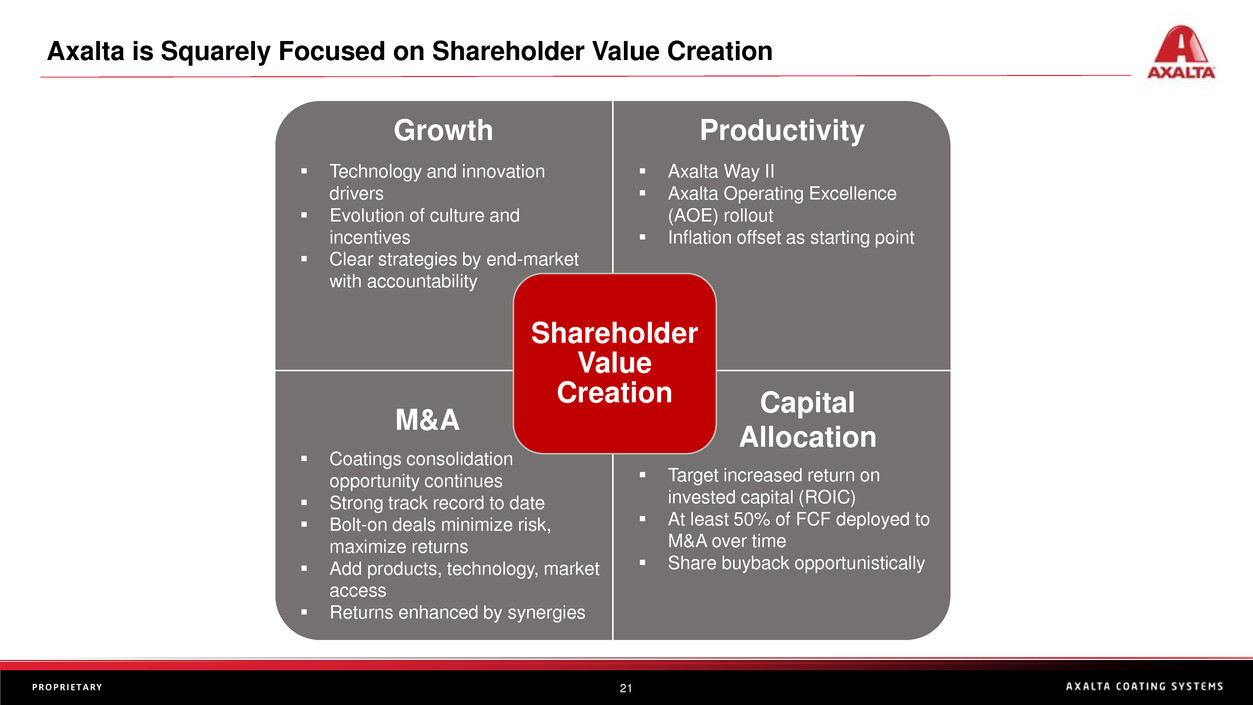
Growth Productivity
Shareholder
Value
Creation
▪ Technology and innovation
drivers
▪ Evolution of culture and
incentives
▪ Clear strategies by end-market
with accountability
▪ Axalta Way II
▪ Axalta Operating Excellence
(AOE) rollout
▪ Inflation offset as starting point
▪ Coatings consolidation
opportunity continues
▪ Strong track record to date
▪ Bolt-on deals minimize risk,
maximize returns
▪ Add products, technology, market
access
▪ Returns enhanced by synergies
▪ Target increased return on
invested capital (ROIC)
▪ At least 50% of FCF deployed to
M&A over time
▪ Share buyback opportunistically
Capital
Allocation
M&A
Axalta is Squarely Focused on Shareholder Value Creation
22P R O P R I E T A R Y
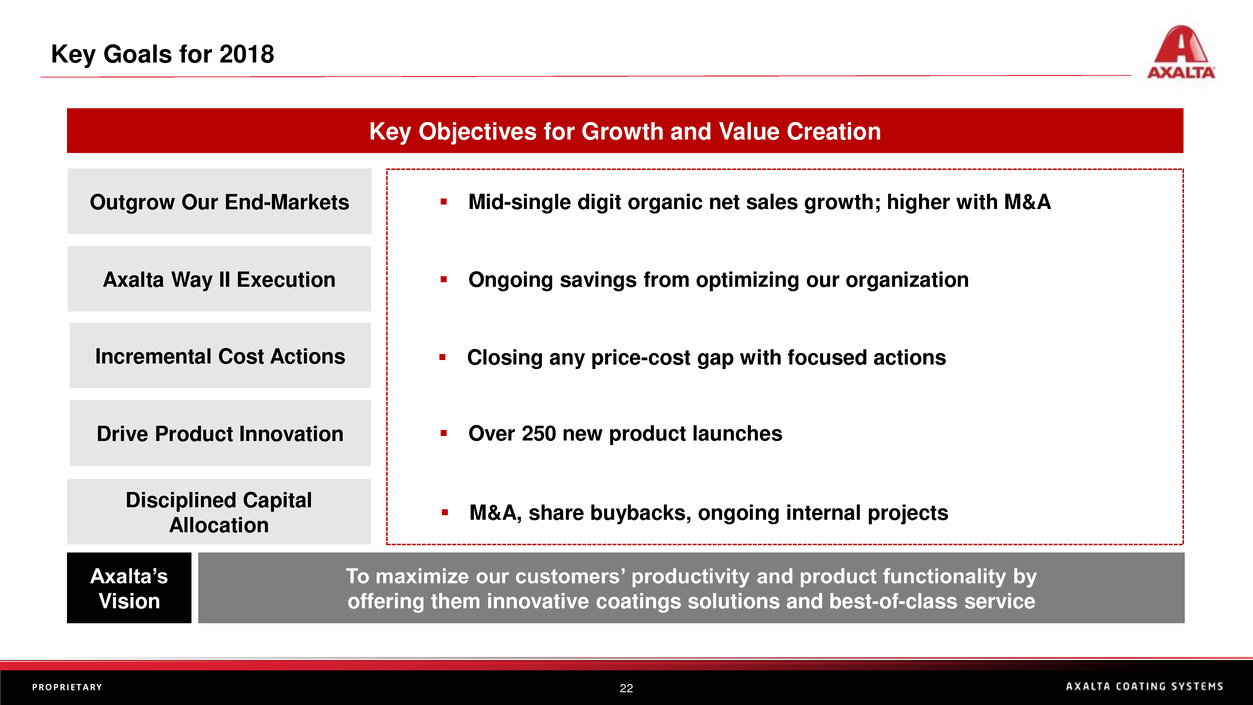
Key Goals for 2018
Key Objectives for Growth and Value Creation
To maximize our customers’ productivity and product functionality by
offering them innovative coatings solutions and best-of-class service
Outgrow Our End-Markets
Axalta Way II Execution
Disciplined Capital
Allocation
Incremental Cost Actions
Drive Product Innovation
▪ Mid-single digit organic net sales growth; higher with M&A
▪ Ongoing savings from optimizing our organization
▪ Closing any price-cost gap with focused actions
▪ Over 250 new product launches
▪ M&A, share buybacks, ongoing internal projects
Axalta’s
Vision
23P R O P R I E T A R Y
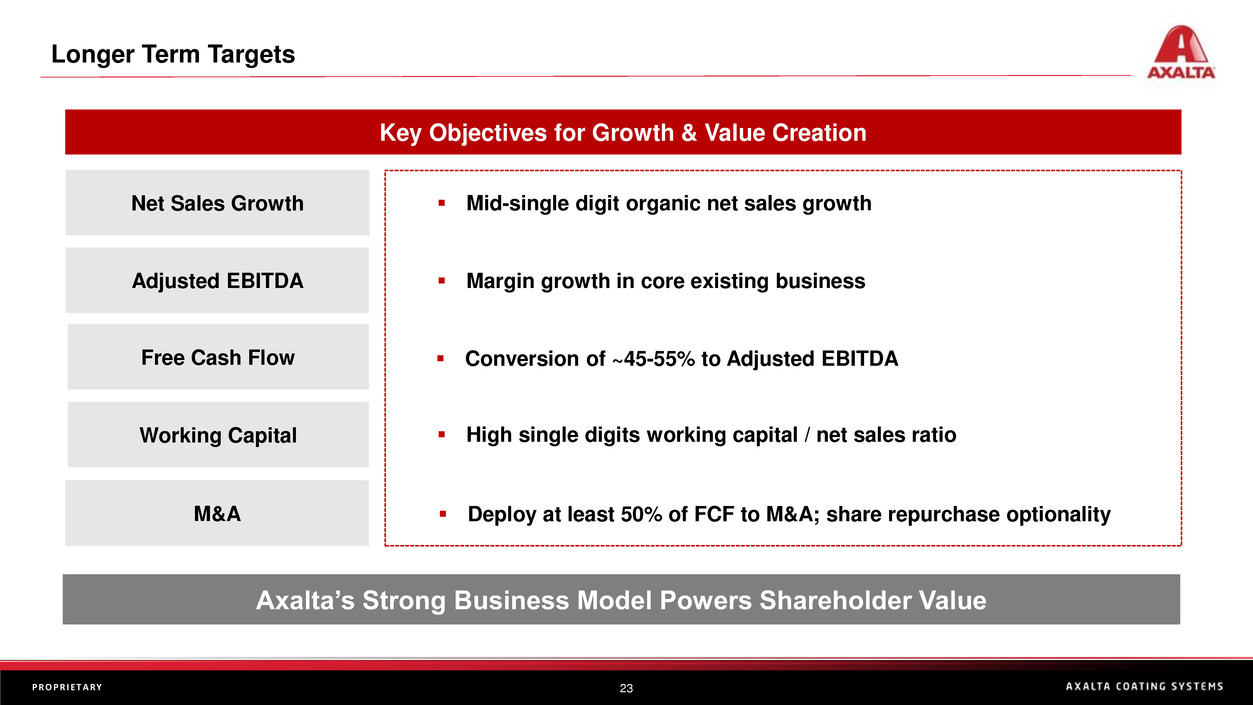
Longer Term Targets
Key Objectives for Growth & Value Creation
Axalta’s Strong Business Model Powers Shareholder Value
Net Sales Growth
Adjusted EBITDA
M&A
Free Cash Flow
Working Capital
▪ Mid-single digit organic net sales growth
▪ Margin growth in core existing business
▪ Conversion of ~45-55% to Adjusted EBITDA
▪ High single digits working capital / net sales ratio
▪ Deploy at least 50% of FCF to M&A; share repurchase optionality
24P R O P R I E T A R Y
Summary
▪ Axalta has developed a strong five year execution track record;
we see significant upside in sales and profit growth, cash flow
generation, and returns on capital
▪ We lead in growing, strong, and stable coatings segments and
are actively entering new close adjacent markets
▪ Our technologies and service differentiate Axalta in the
markets we serve
▪ Axalta has material growth opportunities in China, adjacent
coatings markets and ongoing industry consolidation
▪ We are targeting $200 million in incremental savings over four
years with Axalta Way Phase II
We Are 100% Focused on Shareholder Value Creation
Thank You!
Axalta’s Financial Progress and Outlook
Robert Bryant
EVP and CFO
27P R O P R I E T A R Y
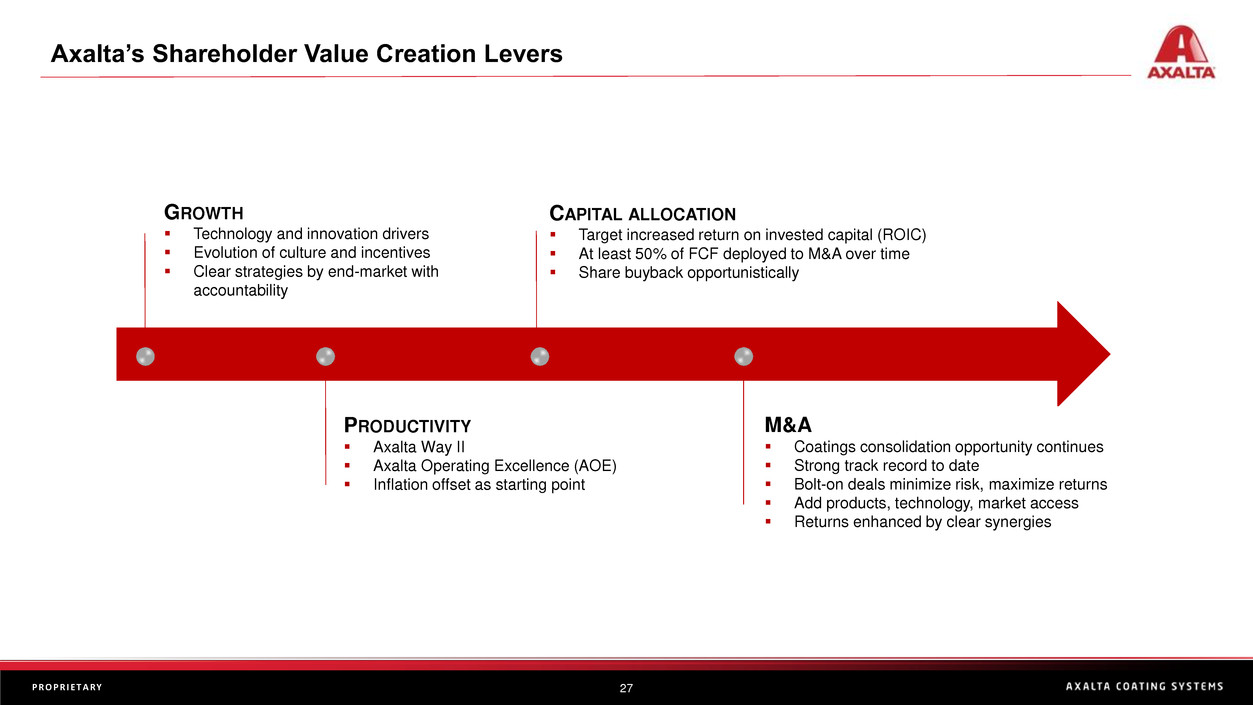
GROWTH
▪ Technology and innovation drivers
▪ Evolution of culture and incentives
▪ Clear strategies by end-market with
accountability
PRODUCTIVITY
▪ Axalta Way II
▪ Axalta Operating Excellence (AOE)
▪ Inflation offset as starting point
M&A
▪ Coatings consolidation opportunity continues
▪ Strong track record to date
▪ Bolt-on deals minimize risk, maximize returns
▪ Add products, technology, market access
▪ Returns enhanced by clear synergies
CAPITAL ALLOCATION
▪ Target increased return on invested capital (ROIC)
▪ At least 50% of FCF deployed to M&A over time
▪ Share buyback opportunistically
Axalta’s Shareholder Value Creation Levers
28P R O P R I E T A R Y
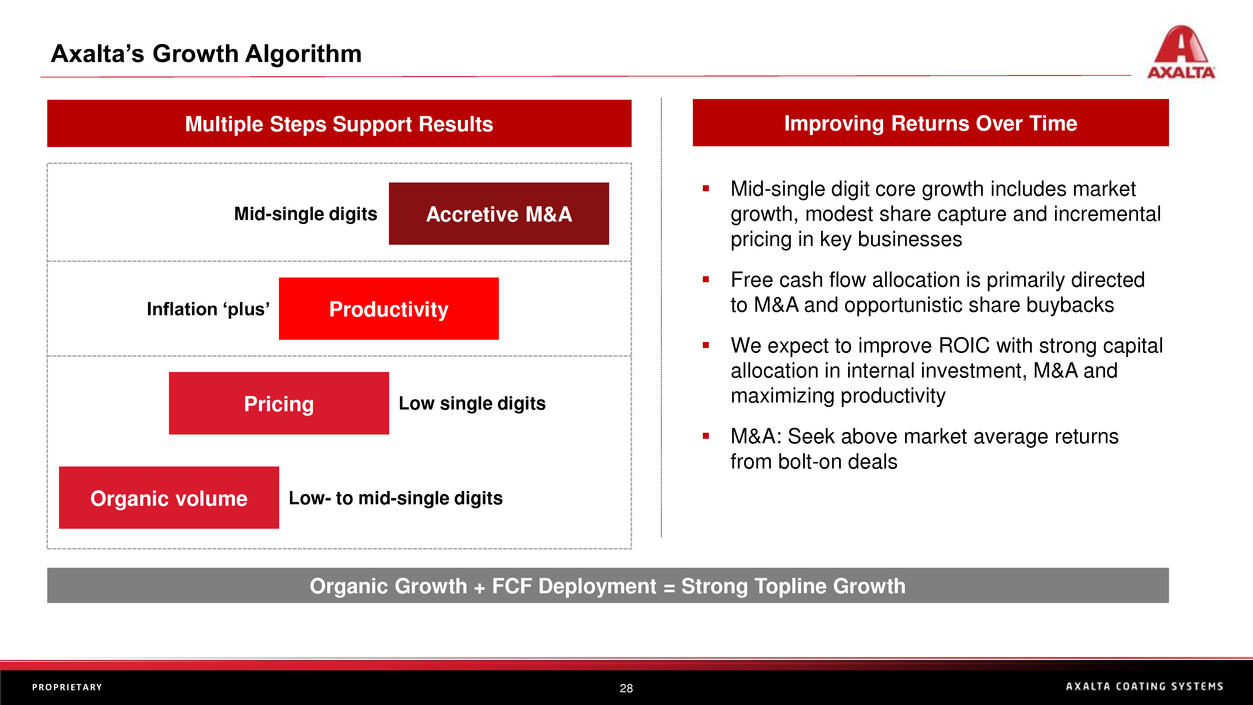
Organic Growth + FCF Deployment = Strong Topline Growth
▪ Mid-single digit core growth includes market
growth, modest share capture and incremental
pricing in key businesses
▪ Free cash flow allocation is primarily directed
to M&A and opportunistic share buybacks
▪ We expect to improve ROIC with strong capital
allocation in internal investment, M&A and
maximizing productivity
▪ M&A: Seek above market average returns
from bolt-on deals
Improving Returns Over TimeMultiple Steps Support Results
Organic volume
Pricing
Productivity
Accretive M&A
Low- to mid-single digits
Low single digits
Inflation ‘plus’
Mid-single digits
Axalta’s Growth Algorithm
29P R O P R I E T A R Y
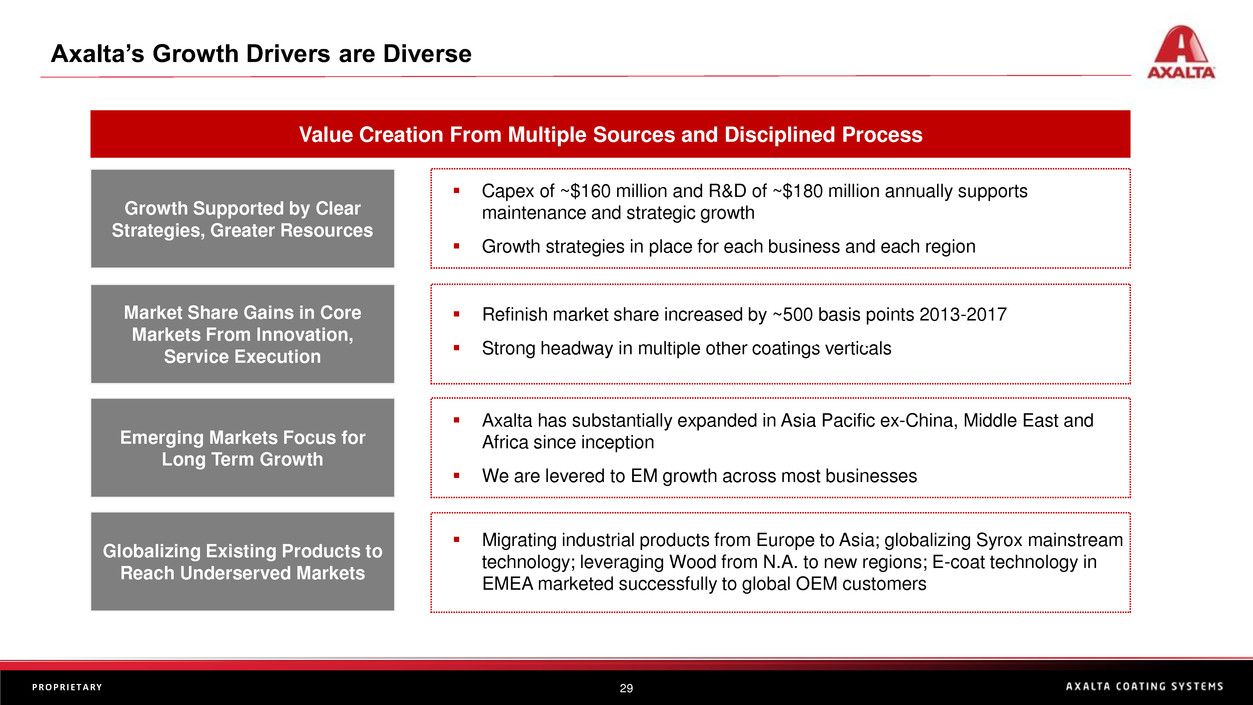
Axalta’s Growth Drivers are Diverse
Value Creation From Multiple Sources and Disciplined Process
Growth Supported by Clear
Strategies, Greater Resources
Market Share Gains in Core
Markets From Innovation,
Service Execution
Emerging Markets Focus for
Long Term Growth
Globalizing Existing Products to
Reach Underserved Markets
▪ Capex of ~$160 million and R&D of ~$180 million annually supports
maintenance and strategic growth
▪ Growth strategies in place for each business and each region
▪ Refinish market share increased by ~500 basis points 2013-2017
▪ Strong headway in multiple other coatings verticals
▪ Axalta has substantially expanded in Asia Pacific ex-China, Middle East and
Africa since inception
▪ We are levered to EM growth across most businesses
▪ Migrating industrial products from Europe to Asia; globalizing Syrox mainstream
technology; leveraging Wood from N.A. to new regions; E-coat technology in
EMEA marketed successfully to global OEM customers
I think we are go to go.
I think we are go to go.
30P R O P R I E T A R Y
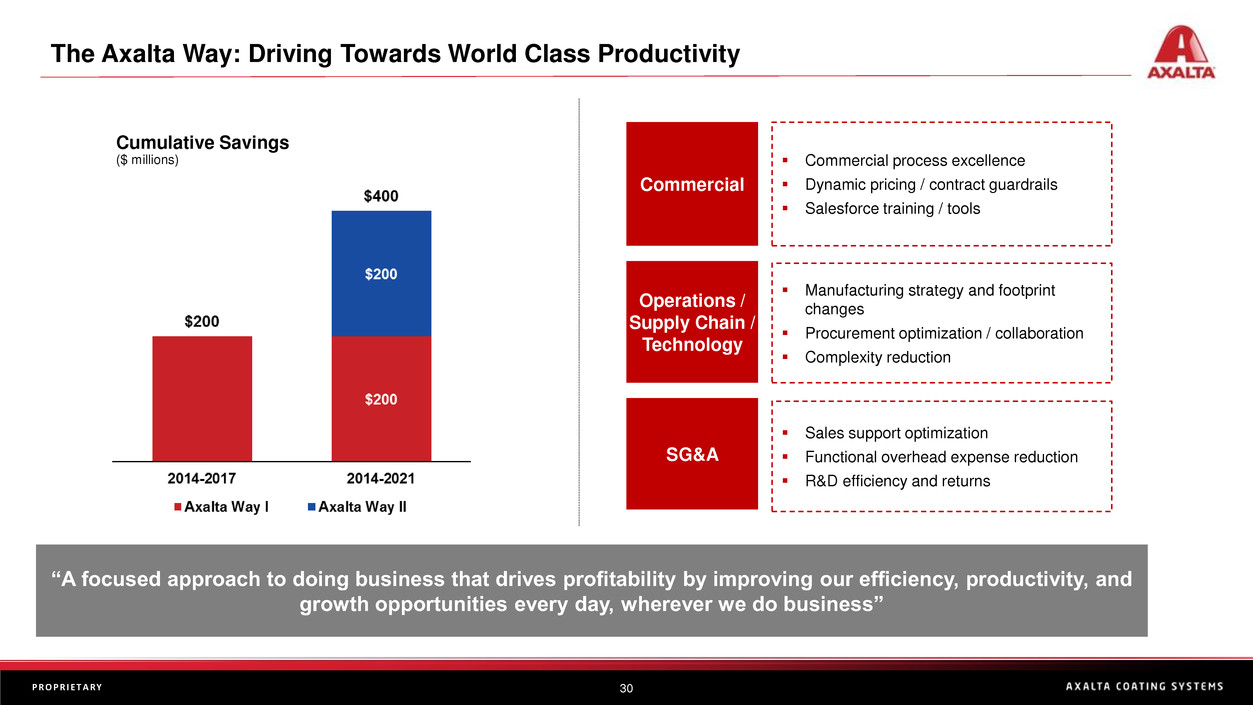
Cumulative Savings
($ millions)
“A focused approach to doing business that drives profitability by improving our efficiency, productivity, and
growth opportunities every day, wherever we do business”
Commercial
Operations /
Supply Chain /
Technology
SG&A
▪ Manufacturing strategy and footprint
changes
▪ Procurement optimization / collaboration
▪ Complexity reduction
▪ Sales support optimization
▪ Functional overhead expense reduction
▪ R&D efficiency and returns
▪ Commercial process excellence
▪ Dynamic pricing / contract guardrails
▪ Salesforce training / tools
The Axalta Way: Driving Towards World Class Productivity
31P R O P R I E T A R Y
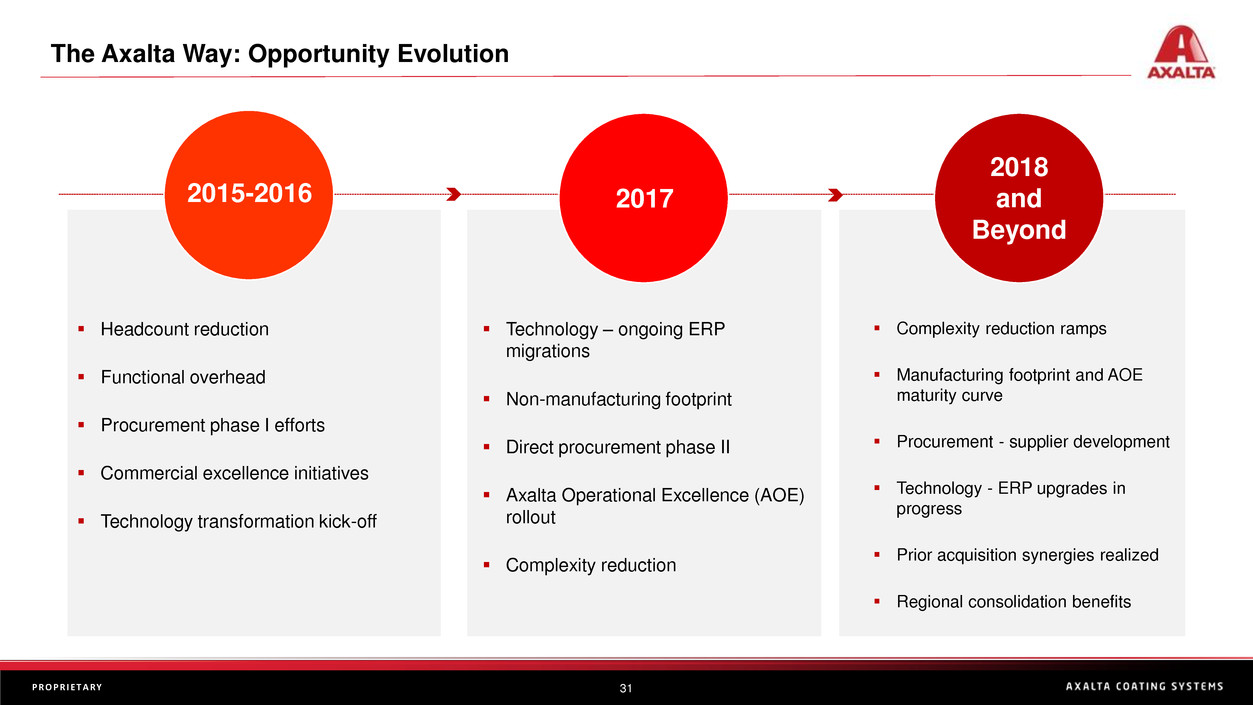
▪ Headcount reduction
▪ Functional overhead
▪ Procurement phase I efforts
▪ Commercial excellence initiatives
▪ Technology transformation kick-off
▪ Technology – ongoing ERP
migrations
▪ Non-manufacturing footprint
▪ Direct procurement phase II
▪ Axalta Operational Excellence (AOE)
rollout
▪ Complexity reduction
▪ Complexity reduction ramps
▪ Manufacturing footprint and AOE
maturity curve
▪ Procurement - supplier development
▪ Technology - ERP upgrades in
progress
▪ Prior acquisition synergies realized
▪ Regional consolidation benefits
2015-2016 2017
2018
and
Beyond
The Axalta Way: Opportunity Evolution
32P R O P R I E T A R Y
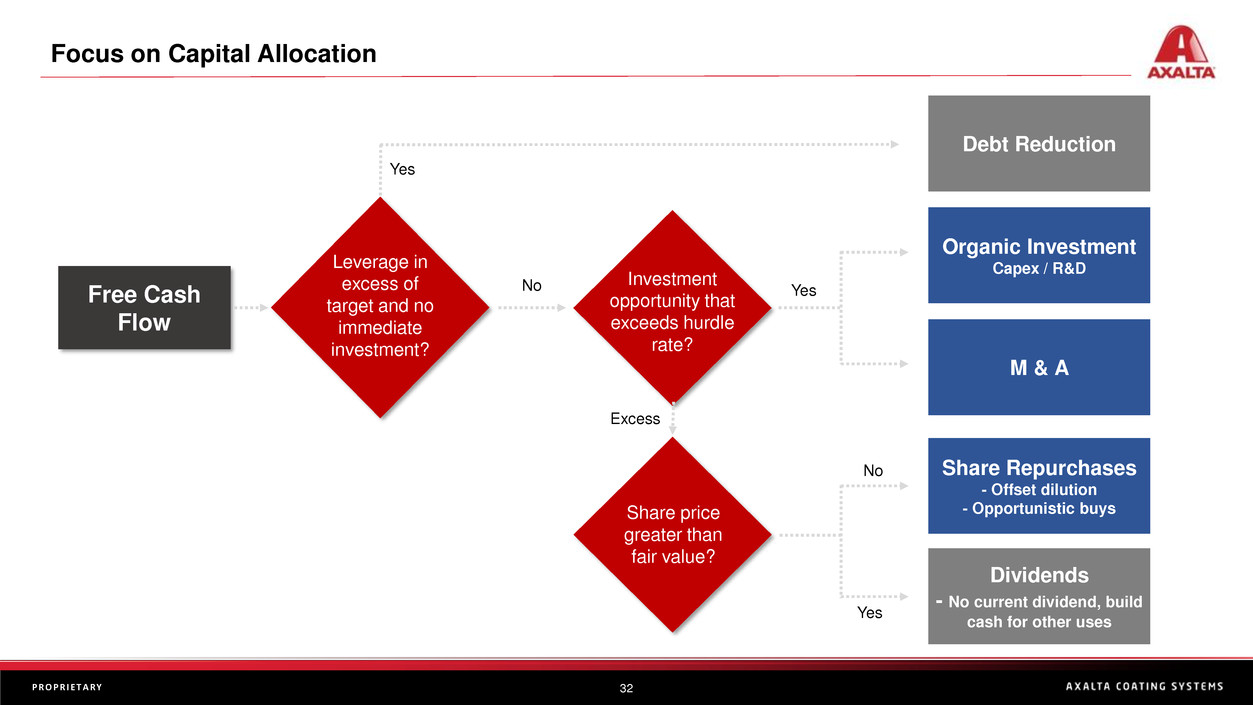
Debt Reduction
Organic Investment
Capex / R&D
M & A
Dividends
- No current dividend, build
cash for other uses
Share Repurchases
- Offset dilution
- Opportunistic buys
Leverage in
excess of
target and no
immediate
investment?
Investment
opportunity that
exceeds hurdle
rate?
Share price
greater than
fair value?
Free Cash
Flow
No
Excess
Yes
Yes
Yes
No
Focus on Capital Allocation
33P R O P R I E T A R Y
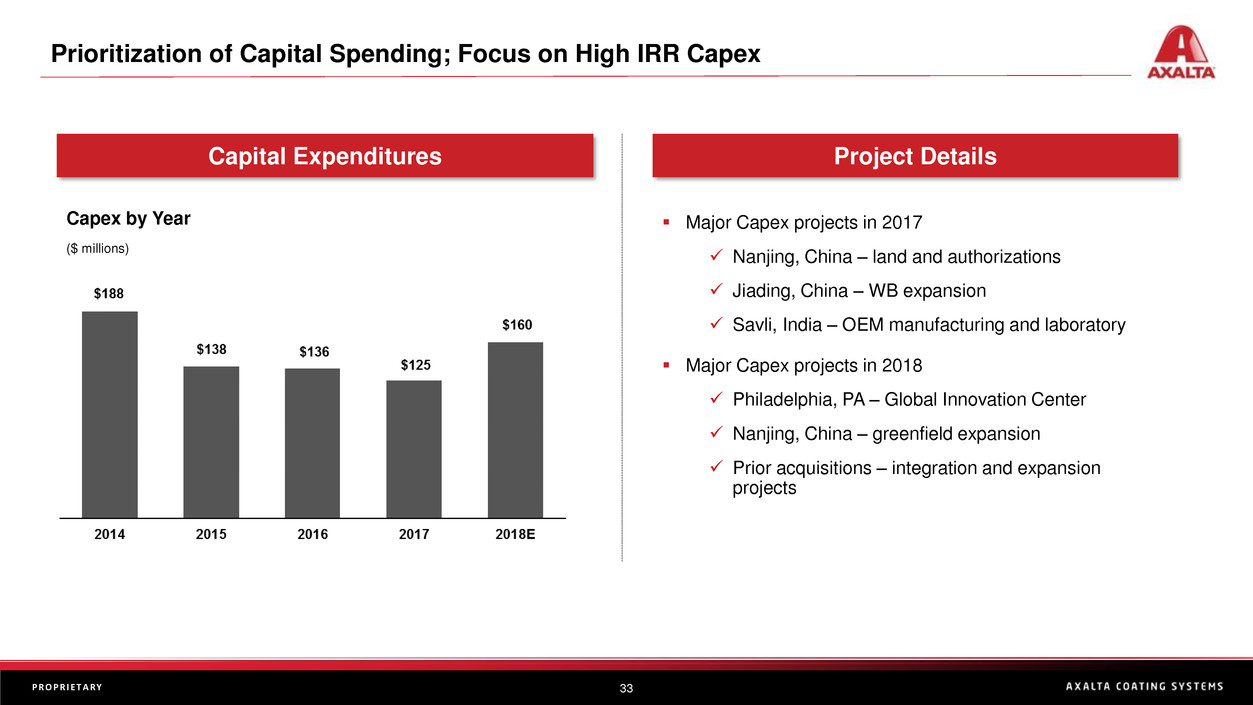
Capital Expenditures
Capex by Year
($ millions)
Project Details
▪ Major Capex projects in 2017
✓ Nanjing, China – land and authorizations
✓ Jiading, China – WB expansion
✓ Savli, India – OEM manufacturing and laboratory
▪ Major Capex projects in 2018
✓ Philadelphia, PA – Global Innovation Center
✓ Nanjing, China – greenfield expansion
✓ Prior acquisitions – integration and expansion
projects
Prioritization of Capital Spending; Focus on High IRR Capex
34P R O P R I E T A R Y
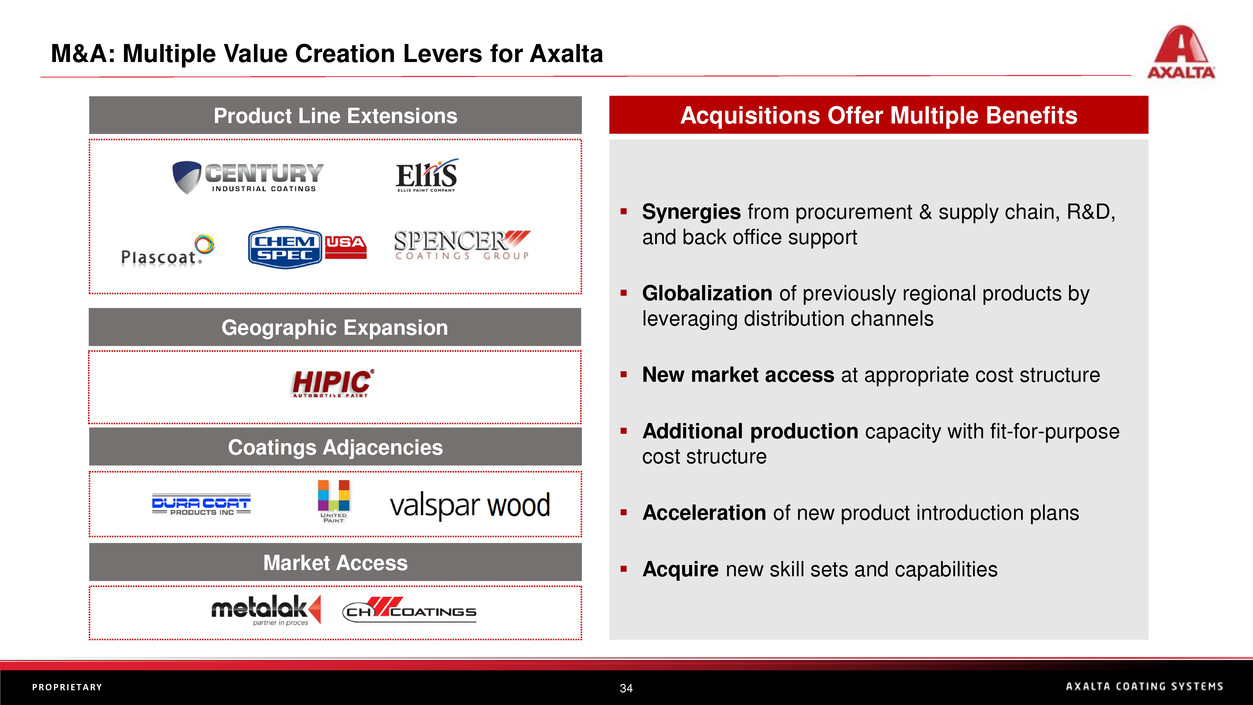
Acquisitions Offer Multiple BenefitsProduct Line Extensions
Geographic Expansion
Coatings Adjacencies
Market Access
▪ Synergies from procurement & supply chain, R&D,
and back office support
▪ Globalization of previously regional products by
leveraging distribution channels
▪ New market access at appropriate cost structure
▪ Additional production capacity with fit-for-purpose
cost structure
▪ Acceleration of new product introduction plans
▪ Acquire new skill sets and capabilities
.
.
.
.
M&A: Multiple Value Creation Levers for Axalta
35P R O P R I E T A R Y
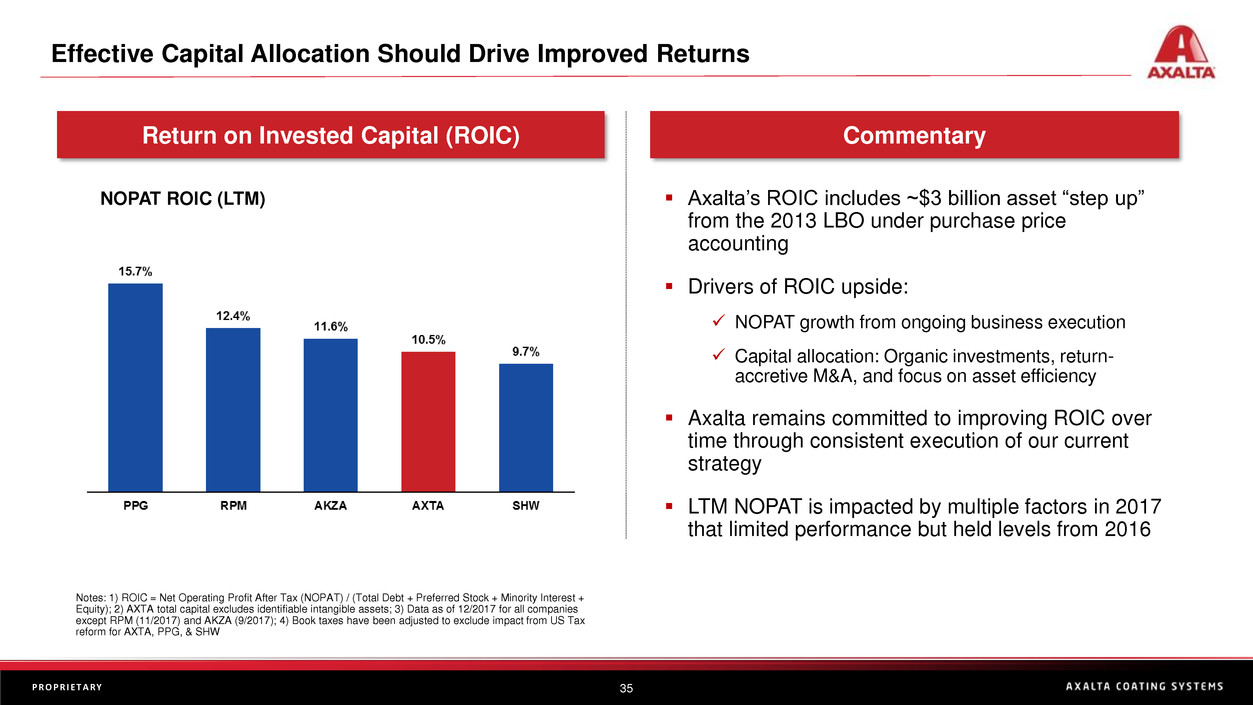
Notes: 1) ROIC = Net Operating Profit After Tax (NOPAT) / (Total Debt + Preferred Stock + Minority Interest +
Equity); 2) AXTA total capital excludes identifiable intangible assets; 3) Data as of 12/2017 for all companies
except RPM (11/2017) and AKZA (9/2017); 4) Book taxes have been adjusted to exclude impact from US Tax
reform for AXTA, PPG, & SHW
Return on Invested Capital (ROIC) Commentary
NOPAT ROIC (LTM) ▪ Axalta’s ROIC includes ~$3 billion asset “step up”
from the 2013 LBO under purchase price
accounting
▪ Drivers of ROIC upside:
✓ NOPAT growth from ongoing business execution
✓ Capital allocation: Organic investments, return-
accretive M&A, and focus on asset efficiency
▪ Axalta remains committed to improving ROIC over
time through consistent execution of our current
strategy
▪ LTM NOPAT is impacted by multiple factors in 2017
that limited performance but held levels from 2016
Effective Capital Allocation Should Drive Improved Returns
36P R O P R I E T A R Y
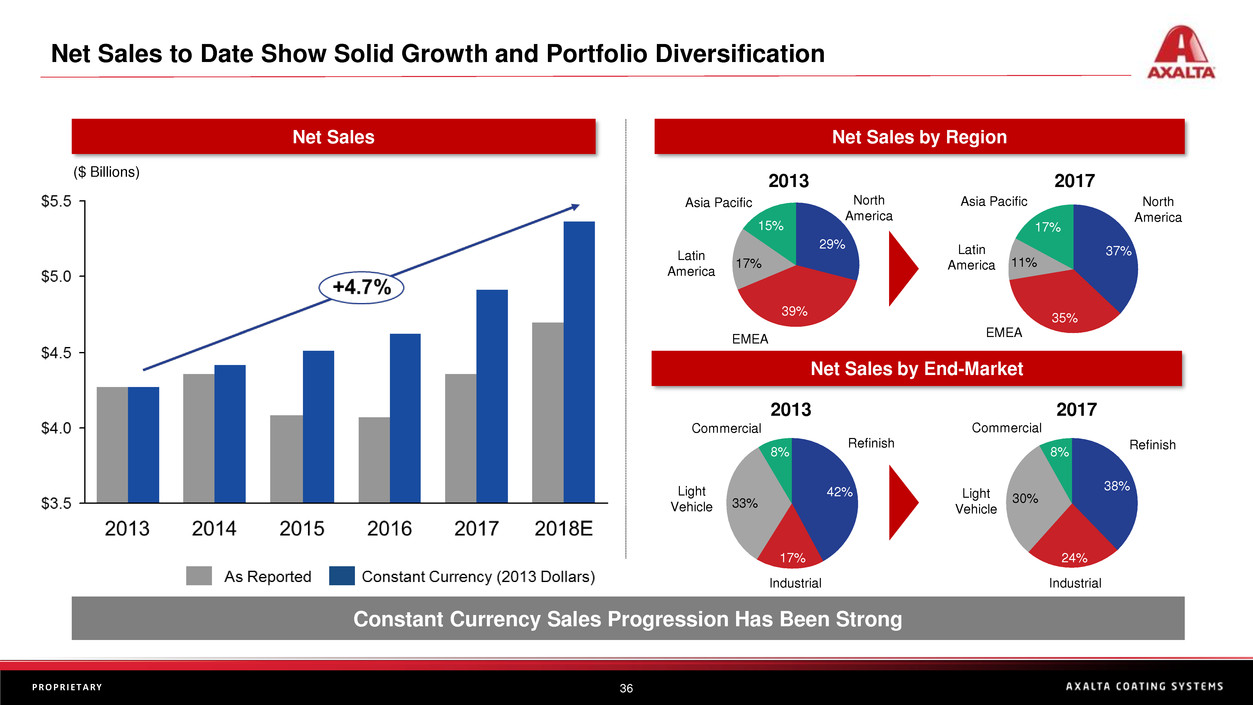
Constant Currency Sales Progression Has Been Strong
Net Sales Net Sales by Region
North
America
29%
15%
Asia Pacific
Latin
America
17%
EMEA
39%
17%
11%
EMEA
35%
Asia Pacific North
America
37%Latin
America
2013 2017
Light
Vehicle
Commercial
33%
8%
Refinish
17%
Industrial
42%
Industrial
38%
8%
24%
30%
Refinish
Commercial
Light
Vehicle
($ Billions)
Net Sales by End-Market
2013 2017
Net Sales to Date Show Solid Growth and Portfolio Diversification
37P R O P R I E T A R Y
Axalta Success is Driven by the Axis of Innovation and Customer Focus
An Active Product PipelineSignificant Technology Investment
Note: All data as of 12/2017 except VAL (4/2017), Akzo (12/2016), RPM (5/2017), and
SHW (12/2016). Axalta total includes technical selling expense.
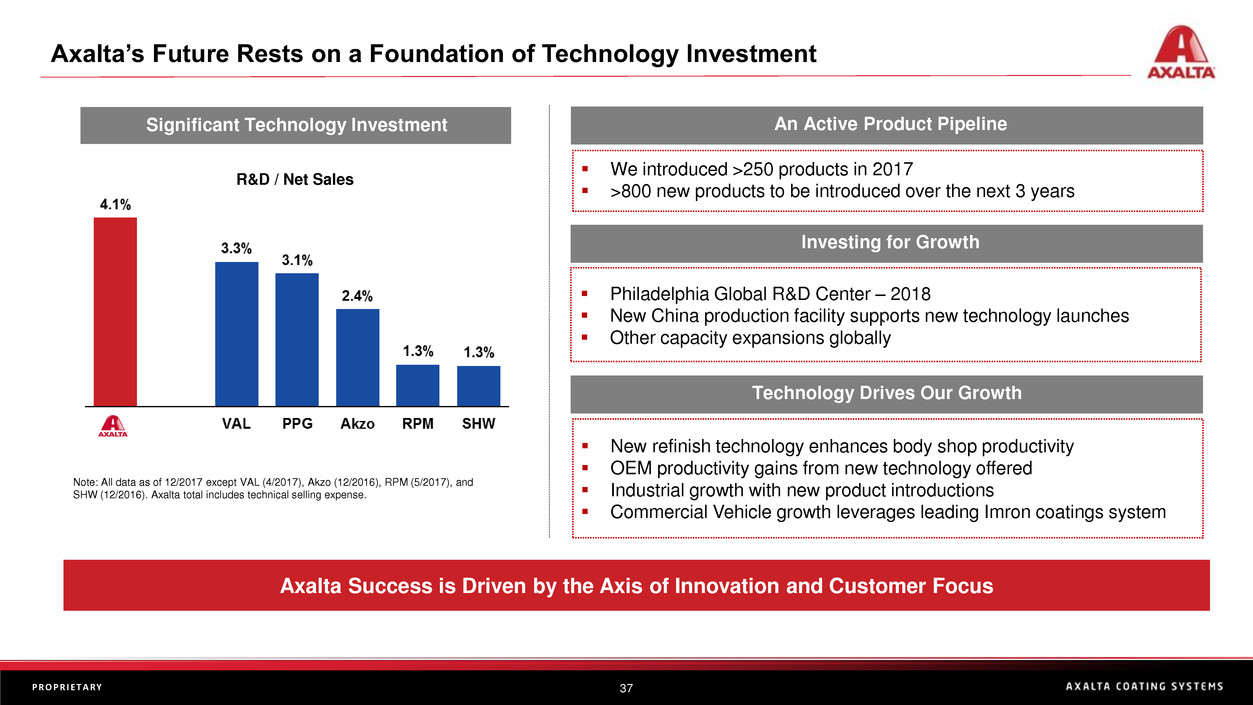
▪ We introduced >250 products in 2017
▪ >800 new products to be introduced over the next 3 years
▪ Philadelphia Global R&D Center – 2018
▪ New China production facility supports new technology launches
▪ Other capacity expansions globally
▪ New refinish technology enhances body shop productivity
▪ OEM productivity gains from new technology offered
▪ Industrial growth with new product introductions
▪ Commercial Vehicle growth leverages leading Imron coatings system
Investing for Growth
Technology Drives Our Growth
R&D / Net Sales .
.
.
Axalta’s Future Rests on a Foundation of Technology Investment
38P R O P R I E T A R Y
Strong Margin Progress, Upside From Volume Growth and Productivity Expected Over Time
Adjusted EBITDA Growth Drivers
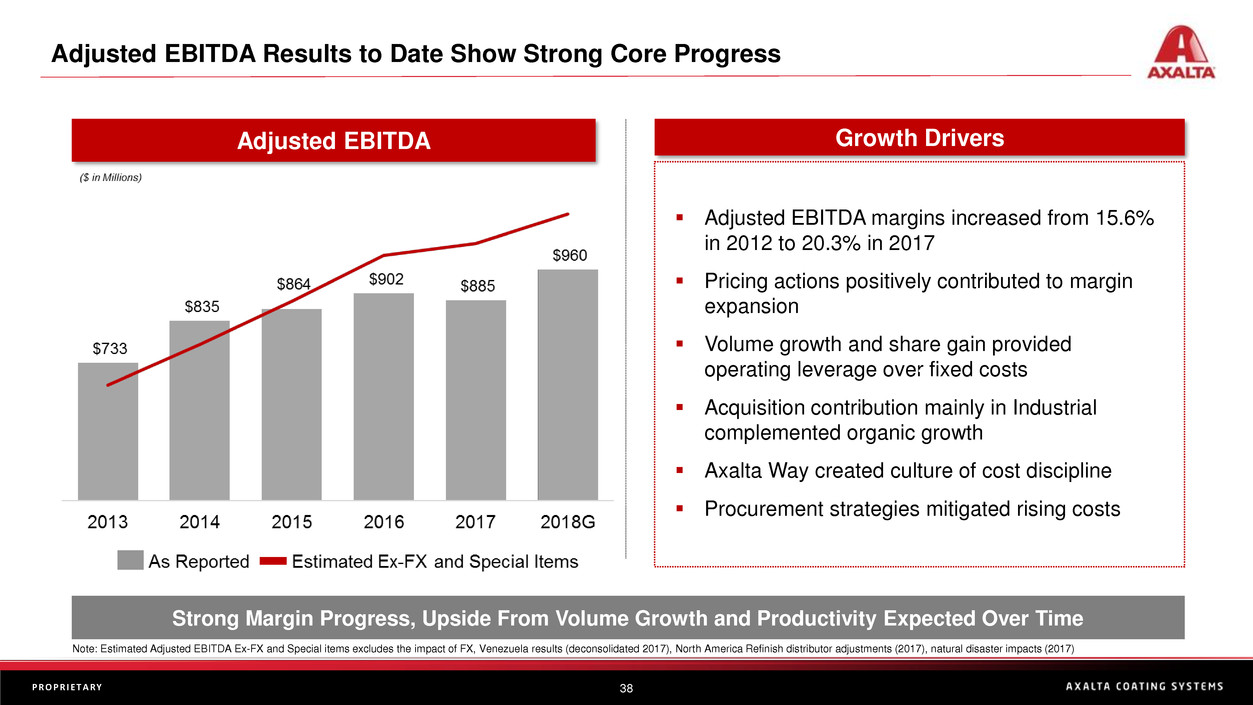
▪ Adjusted EBITDA margins increased from 15.6%
in 2012 to 20.3% in 2017
▪ Pricing actions positively contributed to margin
expansion
▪ Volume growth and share gain provided
operating leverage over fixed costs
▪ Acquisition contribution mainly in Industrial
complemented organic growth
▪ Axalta Way created culture of cost discipline
▪ Procurement strategies mitigated rising costs
.
Adjusted EBITDA Results to Date Show Strong Core Progress
Note: Estimated Adjusted EBITDA Ex-FX and Special items excludes the impact of FX, Venezuela results (deconsolidated 2017), North America Refinish distributor adjustments (2017), natural disaster impacts (2017)
39P R O P R I E T A R Y
Long Term Opportunity From Increased Working Capital Efficiency
Net Working Capital / Net Sales Comments
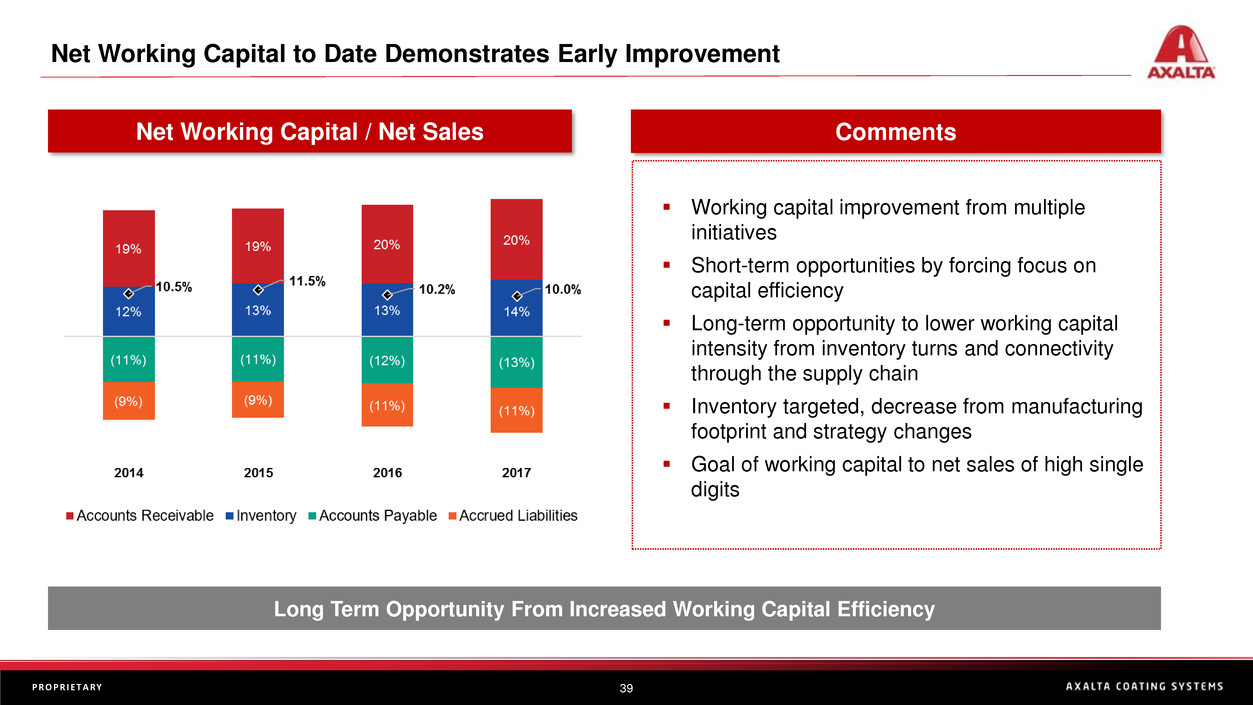
▪ Working capital improvement from multiple
initiatives
▪ Short-term opportunities by forcing focus on
capital efficiency
▪ Long-term opportunity to lower working capital
intensity from inventory turns and connectivity
through the supply chain
▪ Inventory targeted, decrease from manufacturing
footprint and strategy changes
▪ Goal of working capital to net sales of high single
digits
.
Net Working Capital to Date Demonstrates Early Improvement
40P R O P R I E T A R Y
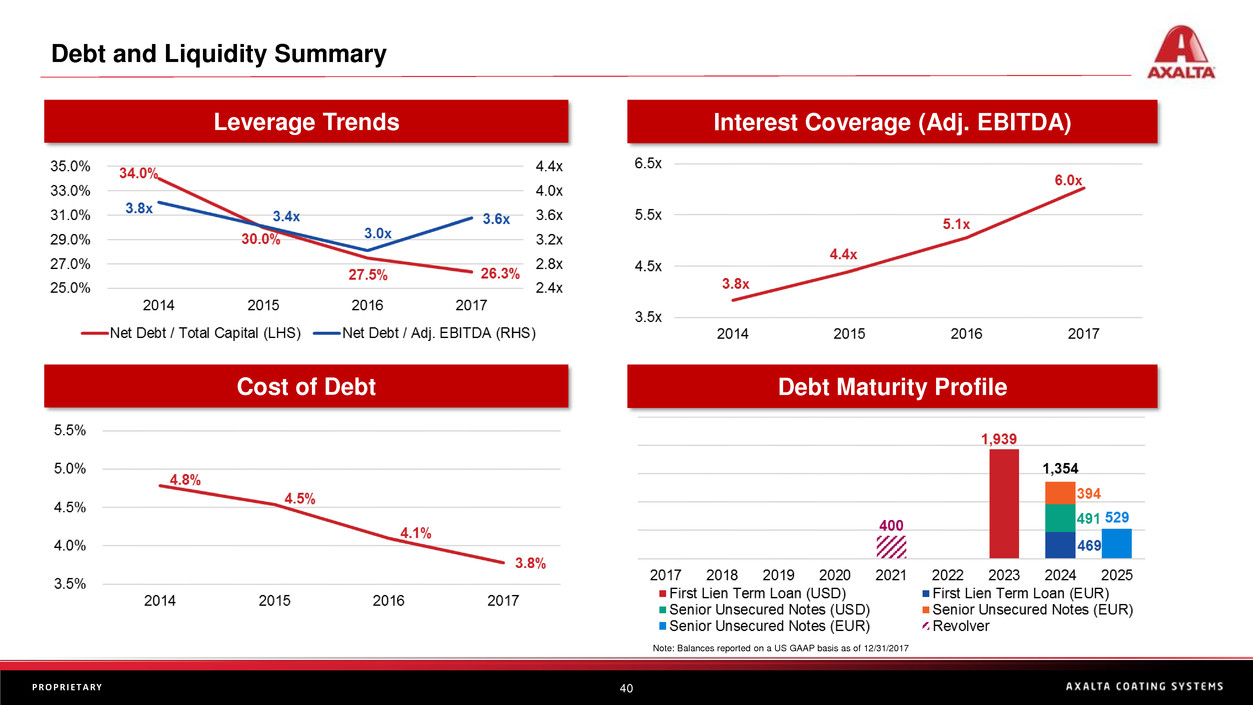
Leverage Trends Interest Coverage (Adj. EBITDA)
Cost of Debt Debt Maturity Profile
Note: Balances reported on a US GAAP basis as of 12/31/2017
Debt and Liquidity Summary
41P R O P R I E T A R Y
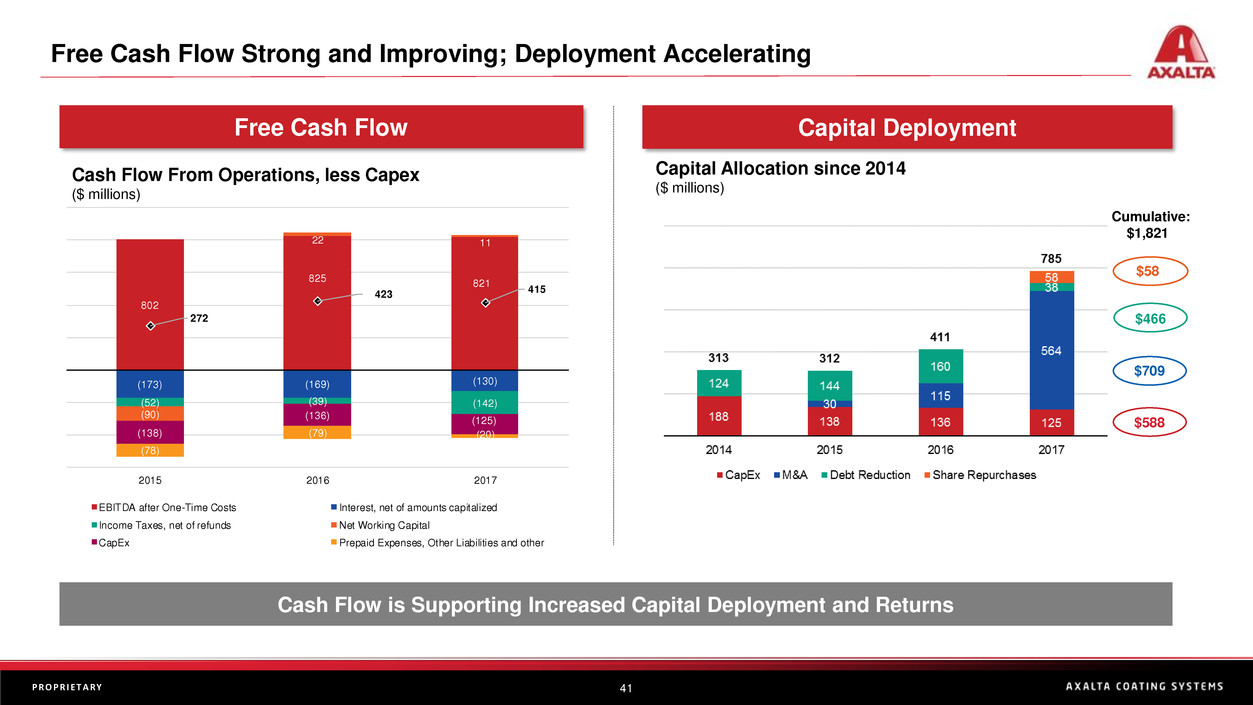
802
825 821
(173) (169) (130)
(52) (39) (142)
(90)
22 11
(138)
(136) (125)
(78)
(79) (20)
272
423 415
2015 2016 2017
EBITDA after One-Time Costs Interest, net of amounts capitalized
Income Taxes, net of refunds Net Working Capital
CapEx Prepaid Expenses, Other Liabilities and other
Cash Flow is Supporting Increased Capital Deployment and Returns
Free Cash Flow Capital Deployment
Cash Flow From Operations, less Capex
($ millions)
Capital Allocation since 2014
($ millions)
$58
$709
$588
$466
Cumulative:
$1,821
Free Cash Flow Strong and Improving; Deployment Accelerating
42P R O P R I E T A R Y
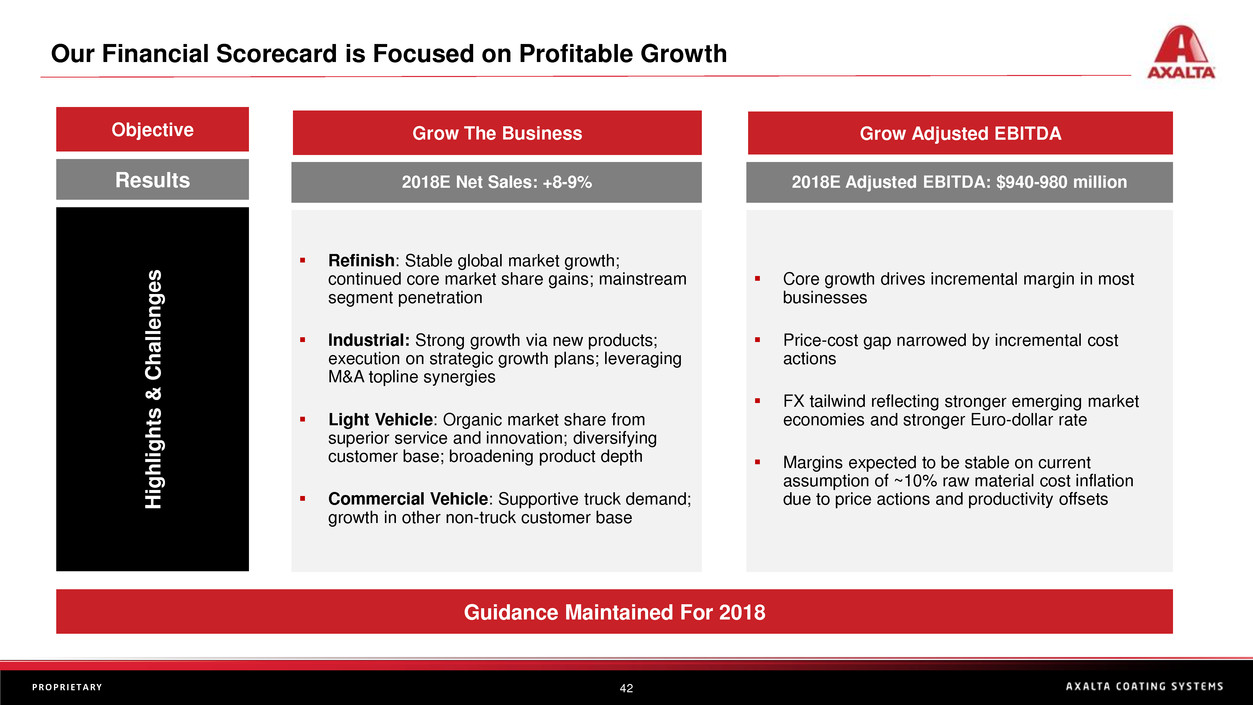
Grow The Business Grow Adjusted EBITDA
2018E Net Sales: +8-9%
▪ Refinish: Stable global market growth;
continued core market share gains; mainstream
segment penetration
▪ Industrial: Strong growth via new products;
execution on strategic growth plans; leveraging
M&A topline synergies
▪ Light Vehicle: Organic market share from
superior service and innovation; diversifying
customer base; broadening product depth
▪ Commercial Vehicle: Supportive truck demand;
growth in other non-truck customer base
2018E Adjusted EBITDA: $940-980 million
▪ Core growth drives incremental margin in most
businesses
▪ Price-cost gap narrowed by incremental cost
actions
▪ FX tailwind reflecting stronger emerging market
economies and stronger Euro-dollar rate
▪ Margins expected to be stable on current
assumption of ~10% raw material cost inflation
due to price actions and productivity offsets
Objective
Results
Hig
h
lig
h
ts
& Challen
g
e
s
Our Financial Scorecard is Focused on Profitable Growth
Guidance Maintained For 2018
43P R O P R I E T A R Y
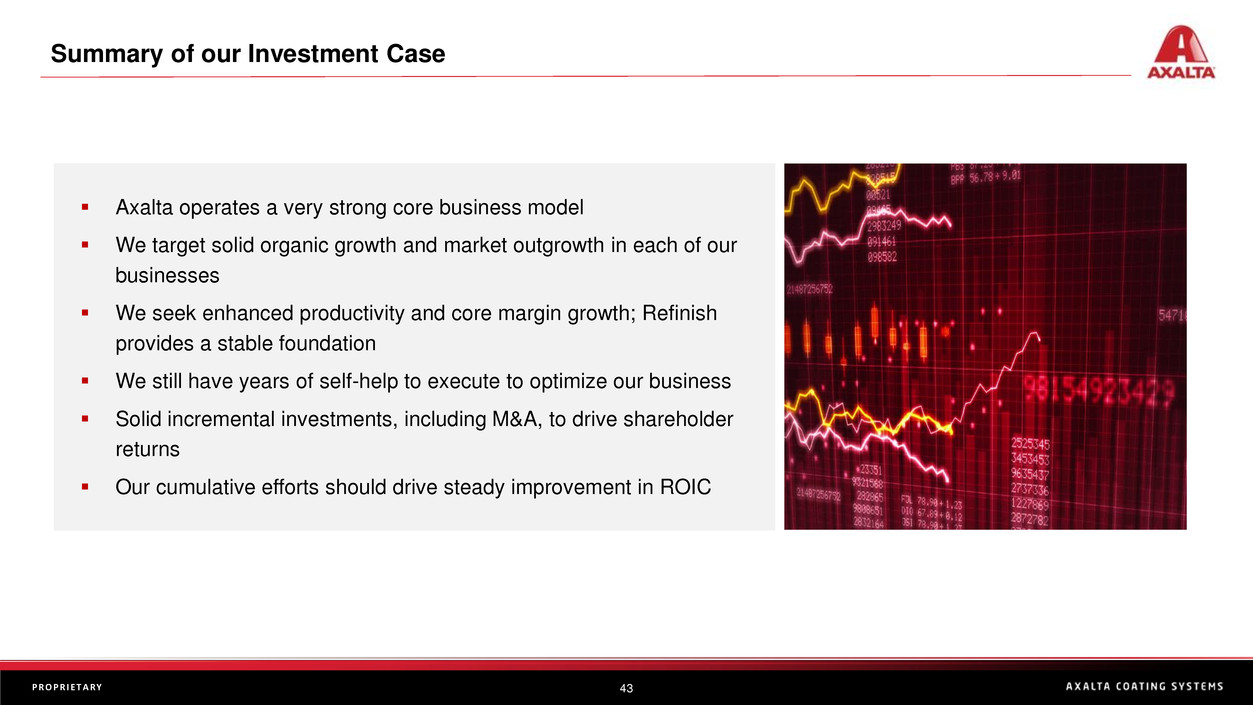
▪ Axalta operates a very strong core business model
▪ We target solid organic growth and market outgrowth in each of our
businesses
▪ We seek enhanced productivity and core margin growth; Refinish
provides a stable foundation
▪ We still have years of self-help to execute to optimize our business
▪ Solid incremental investments, including M&A, to drive shareholder
returns
▪ Our cumulative efforts should drive steady improvement in ROIC
Summary of our Investment Case
Thank you!
Performance Coatings: Refinish
Joe McDougall
EVP, President, Global Refinish & EMEA
46P R O P R I E T A R Y
▪ The global automotive refinish market is stable, consolidated and growing
✓ Refinish is highly stable, linked to global miles driven and accident rates
✓ The top four Refinish players hold two-thirds of the global market
✓ End-market growth ~3-4% per year expected
▪ Axalta leads with the broadest and deepest technology and market reach
✓ We lead the global market with 25% share; higher share in developed regions
✓ Our deep portfolio of next-generation technology addresses wide-ranging customer needs
✓ Axalta has broad market reach across product and customer types globally
▪ Axalta continues to grow through an aggressive and disciplined strategy
✓ Organic and inorganic product introductions to increase reach and competitiveness
✓ Benefiting from consolidation and professionalization of body shop market
✓ Tailwind from growing car parc, especially in emerging markets
✓ Adding technology and services to solidify competitive moat and customer relationships
Axalta Refinish Investment Thesis
47P R O P R I E T A R Y
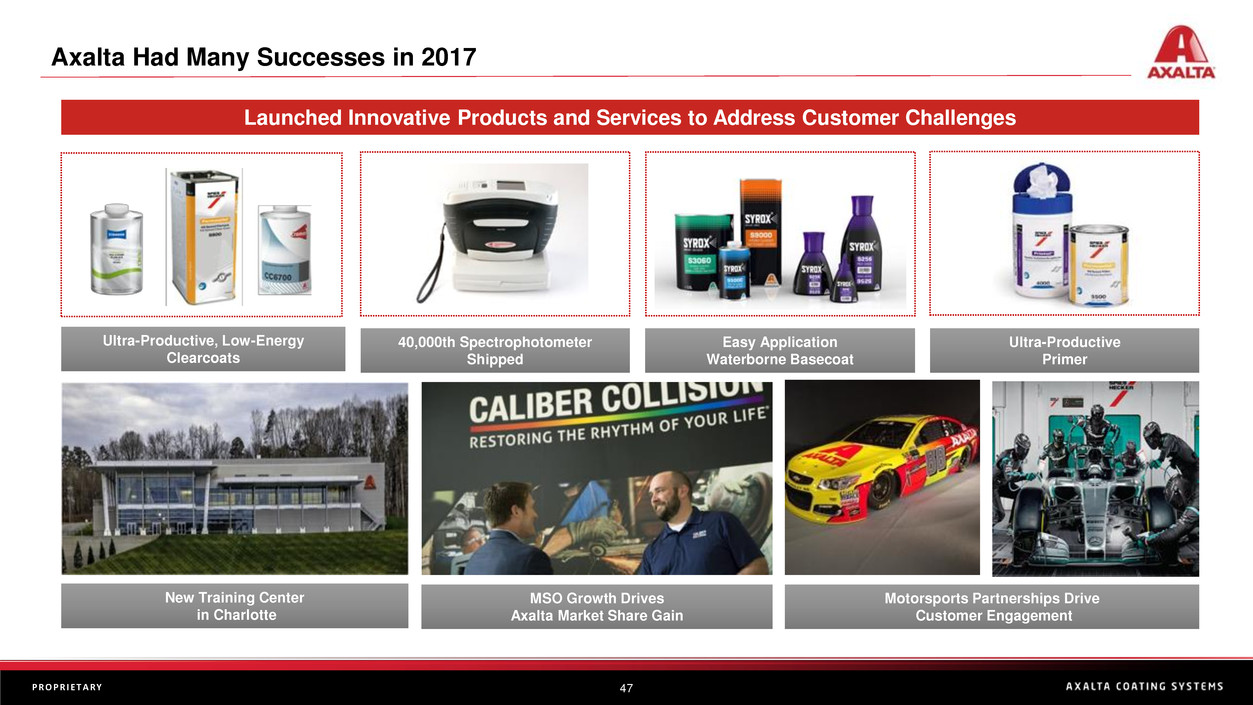
Axalta Had Many Successes in 2017
Ultra-Productive, Low-Energy
Clearcoats
Ultra-Productive
Primer
Easy Application
Waterborne Basecoat
40,000th Spectrophotometer
Shipped
MSO Growth Drives
Axalta Market Share Gain
New Training Center
in Charlotte
Motorsports Partnerships Drive
Customer Engagement
Launched Innovative Products and Services to Address Customer Challenges
48P R O P R I E T A R Y
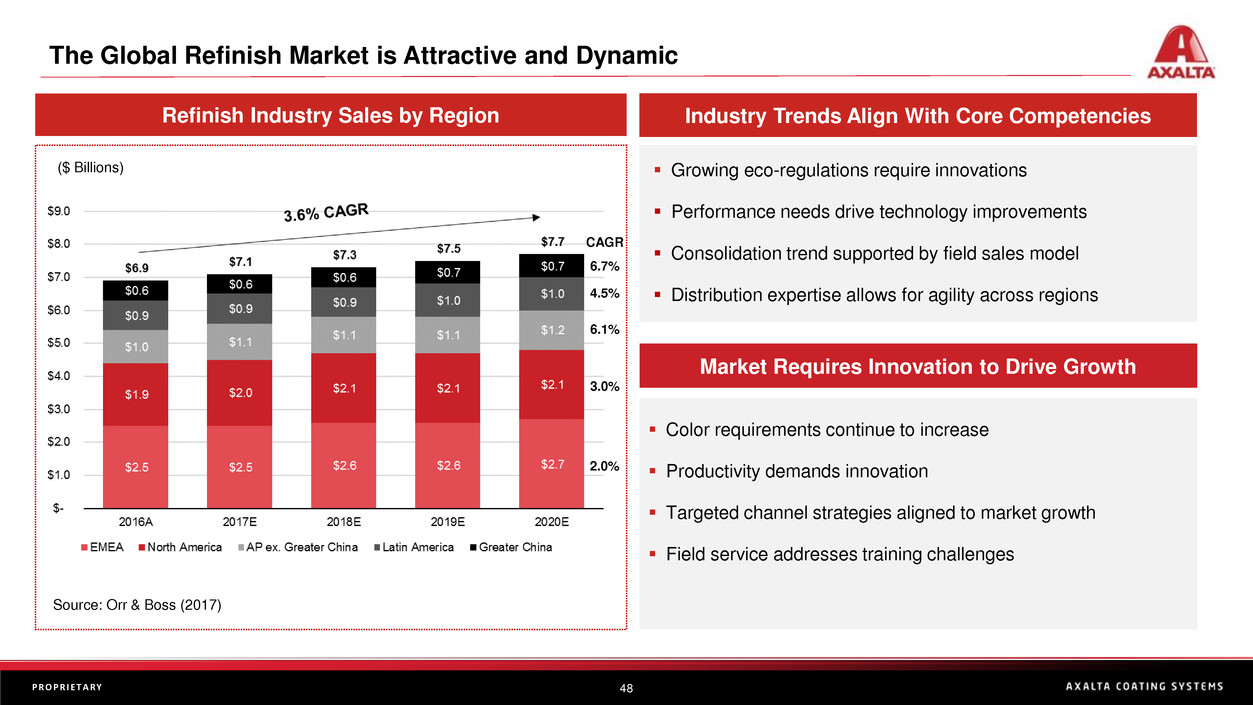
The Global Refinish Market is Attractive and Dynamic
▪ Growing eco-regulations require innovations
▪ Performance needs drive technology improvements
▪ Consolidation trend supported by field sales model
▪ Distribution expertise allows for agility across regions
Industry Trends Align With Core Competencies
Market Requires Innovation to Drive Growth
▪ Color requirements continue to increase
▪ Productivity demands innovation
▪ Targeted channel strategies aligned to market growth
▪ Field service addresses training challenges
Refinish Industry Sales by Region
Source: Orr & Boss (2017)
($ Billions)
CAGR
6.7%
4.5%
6.1%
3.0%
2.0%
49P R O P R I E T A R Y
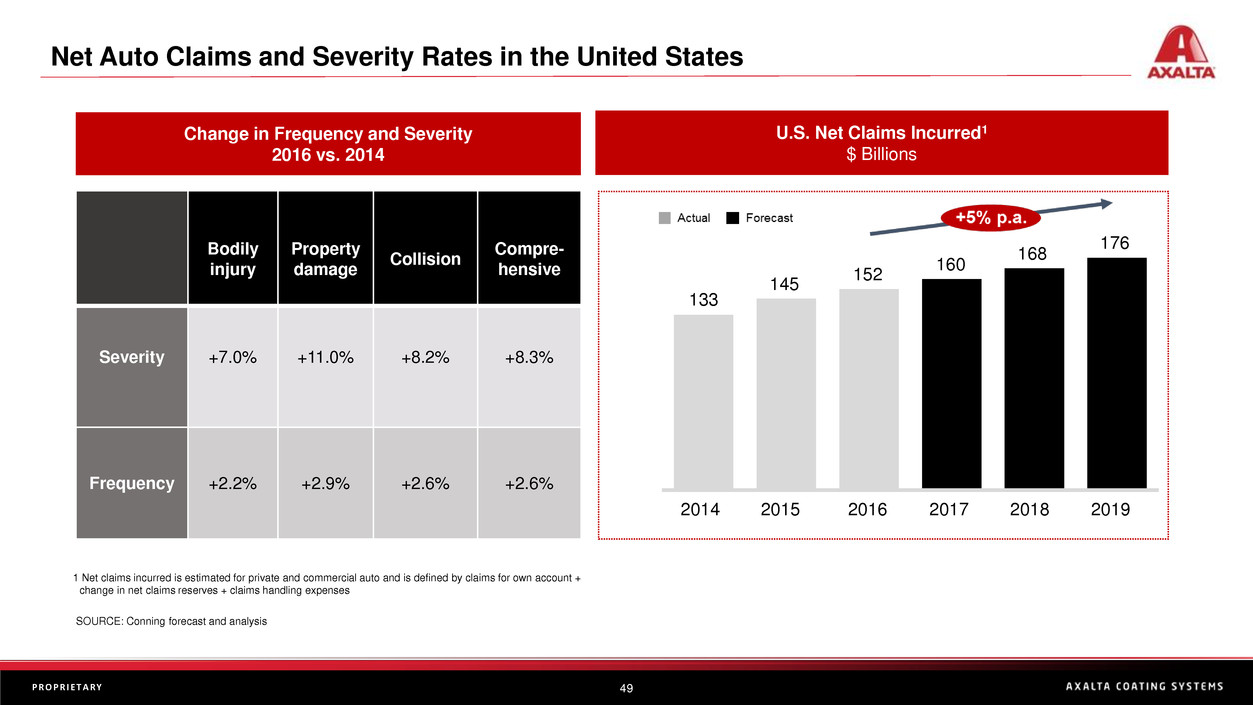
Net Auto Claims and Severity Rates in the United States
1 Net claims incurred is estimated for private and commercial auto and is defined by claims for own account +
change in net claims reserves + claims handling expenses
176
152
2019
168
160
20162015
145
20182014
133
2017
U.S. Net Claims Incurred1
$ Billions
Change in Frequency and Severity
2016 vs. 2014
SOURCE: Conning forecast and analysis
Bodily
injury
Property
damage
Collision
Compre-
hensive
Severity +7.0% +11.0% +8.2% +8.3%
Frequency +2.2% +2.9% +2.6% +2.6%
50P R O P R I E T A R Y
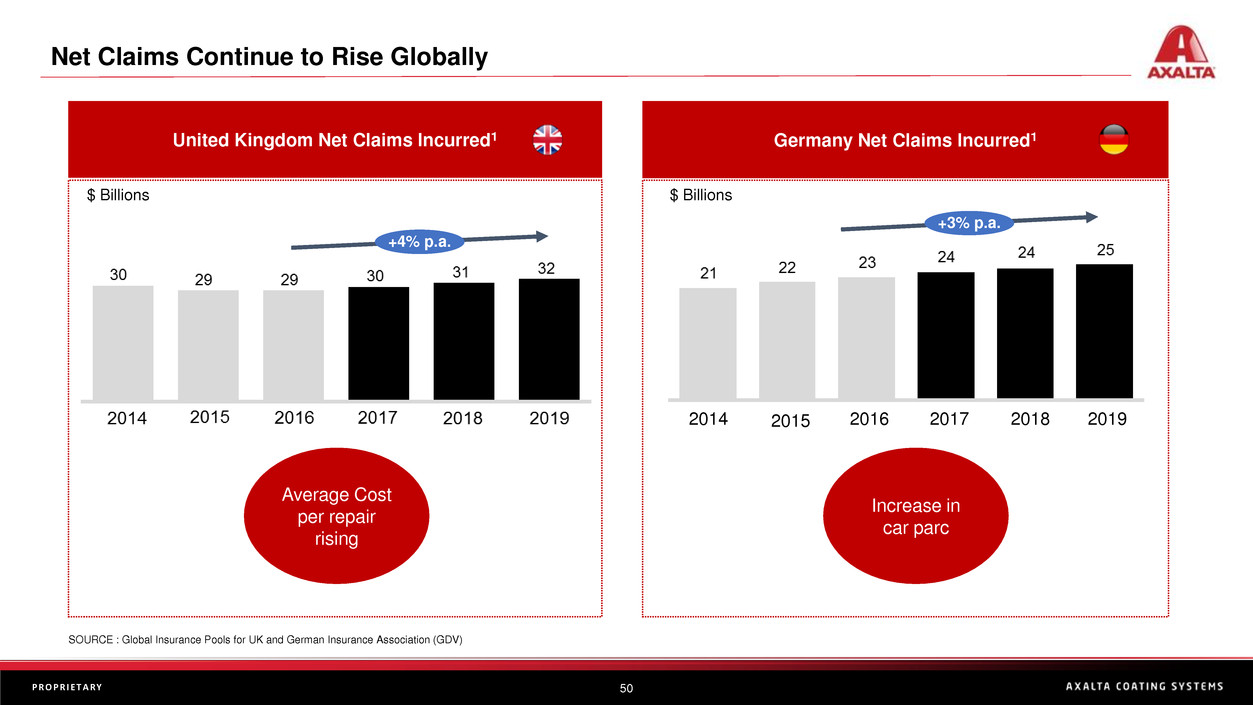
United Kingdom Net Claims Incurred1
+4% p.a.
+3% p.a.
2019
Germany Net Claims Incurred1
Average Cost
per repair
rising
Increase in
car parc
SOURCE : Global Insurance Pools for UK and German Insurance Association (GDV)
20162015 20182014 2017
$ Billions $ Billions
Net Claims Continue to Rise Globally
51P R O P R I E T A R Y
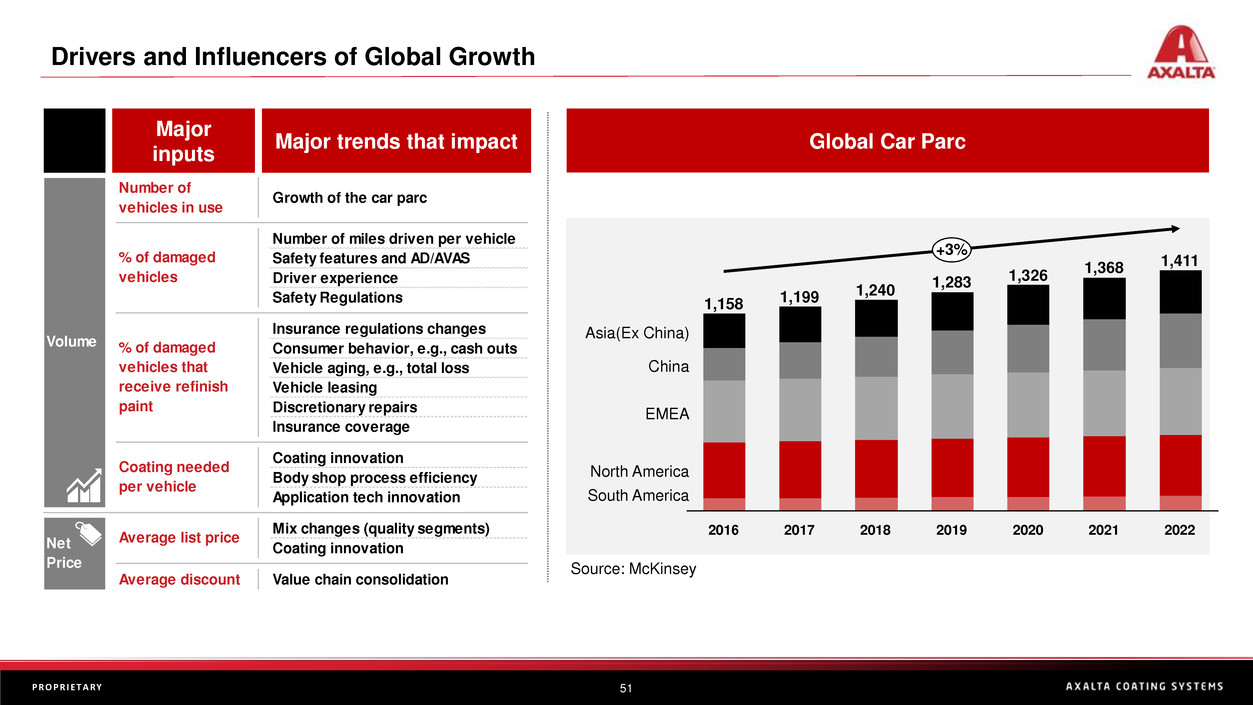
Drivers and Influencers of Global Growth
+3%
EMEA
1,368
1,283 1,326
South America
2020
North America
2021
1,411
2017
China
1,158
20182016
1,240
Asia(Ex China)
1,199
2019 2022
Major
inputs
Major trends that impact Global Car Parc
Source: McKinsey
Number of
vehicles in use
Growth of the car parc
Number of miles driven per vehicle
Safety features and AD/AVAS
Driver experience
Safety Regulations
Insurance regulations changes
Consumer behavior, e.g., cash outs
Vehicle aging, e.g., total loss
Vehicle leasing
Discretionary repairs
Insurance coverage
Coating innovation
Body shop process efficiency
Application tech innovation
Mix changes (quality segments)
Coating innovation
Averag discount Value chain consolidation
% of damaged
vehicles
% of damaged
vehicles that
receive refinish
paint
C ating needed
per vehicle
Volume
Net
Price
Average list priceNet price
Volume
% of damaged
vehicles
% of damaged
vehicles that
receive refinish
paint
Europe
Driver experience
Vehicle leasing
Discretionary repairs
Major trends that impact ChinaMajor inputs
Insurance coverage
Insurance regulations changes
United
States
Safety regulations
Number of miles driven per vehicle
Safety features and AD/AVAS
Consumer behavior, e.g., cash outs
Vehicle aging, e.g., total loss
Coating
needed per
vehicle
Number of
vehicles in use Growth of the car parc
Application tech innovation
Coating innovation
Body shop process efficiency
Average list price
Average discount Value chain consolidation
Coating i novation
Mix changes (quality segments)
Net
price
Volume
% of damaged
vehicles
% of damaged
vehicles that
receive refinish
paint
Europe
Driver experience
Vehicle leasing
Discretionary repairs
Major trends that impact ChinaMajor inputs
Insurance coverage
Insurance regulations changes
United
States
Safety regulations
Number of miles driven per vehicle
Safety features and AD/AVAS
Consumer behavior, e.g., cash outs
V hicle ging, e.g., total loss
Coating
needed per
vehicle
Number of
vehicles in use Growth of the car parc
Application tech innovation
Coating innovation
Body shop process efficiency
Average list price
Average discount Value chain consolidation
oating innovation
Mix cha ges (quality segments)
52P R O P R I E T A R Y
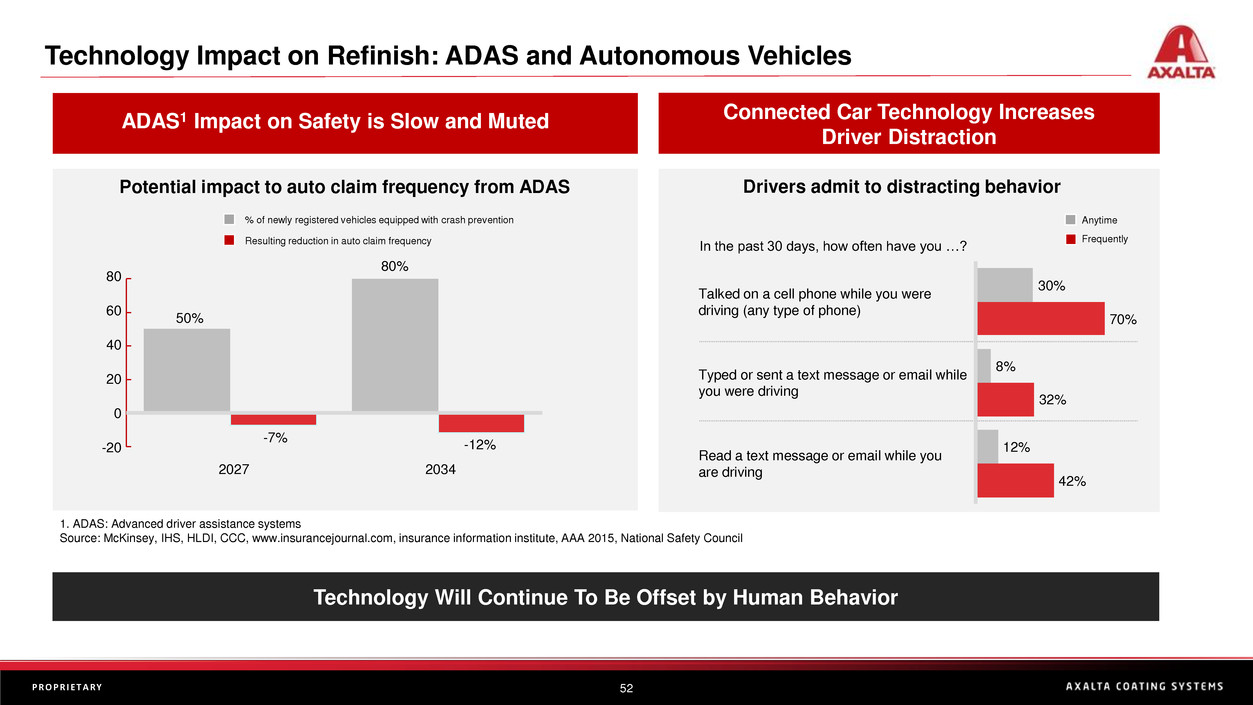
Technology Impact on Refinish: ADAS and Autonomous Vehicles
Technology Will Continue To Be Offset by Human Behavior
Potential impact to auto claim frequency from ADAS
ADAS1 Impact on Safety is Slow and Muted
80
0
40
20
-20
60
-7%
-12%
50%
2034
80%
2027
Resulting reduction in auto claim frequency
% of newly registered vehicles equipped with crash prevention
In the past 30 days, how often have you …?
Read a text message or email while you
are driving
42%
8%
70%
12%
Typed or sent a text message or email while
you were driving
32%
Talked on a cell phone while you were
driving (any type of phone)
30%
Connected Car Technology Increases
Driver Distraction
Drivers admit to distracting behavior
1. ADAS: Advanced driver assistance systems
Source: McKinsey, IHS, HLDI, CCC, www.insurancejournal.com, insurance information institute, AAA 2015, National Safety Council
Anytime
Frequently
53P R O P R I E T A R Y
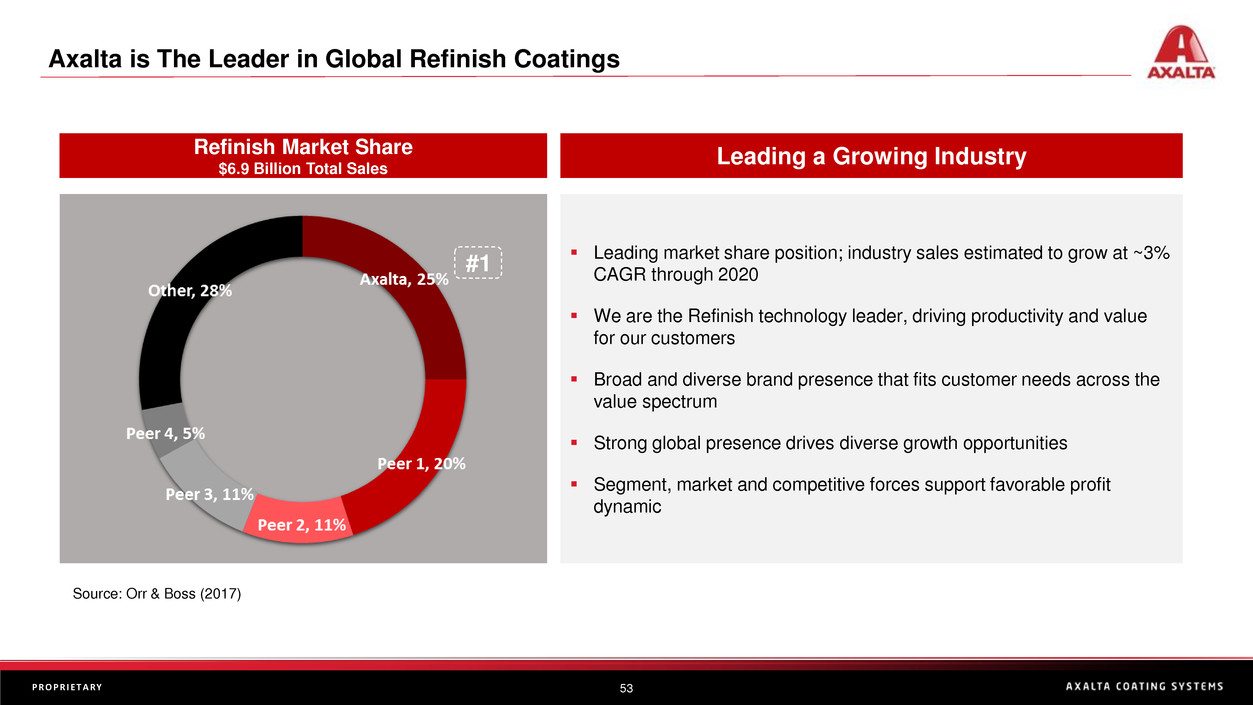
Axalta is The Leader in Global Refinish Coatings
▪ Leading market share position; industry sales estimated to grow at ~3%
CAGR through 2020
▪ We are the Refinish technology leader, driving productivity and value
for our customers
▪ Broad and diverse brand presence that fits customer needs across the
value spectrum
▪ Strong global presence drives diverse growth opportunities
▪ Segment, market and competitive forces support favorable profit
dynamic
#1
Refinish Market Share
$6.9 Billion Total Sales
Leading a Growing Industry
Source: Orr & Boss (2017)
54P R O P R I E T A R Y
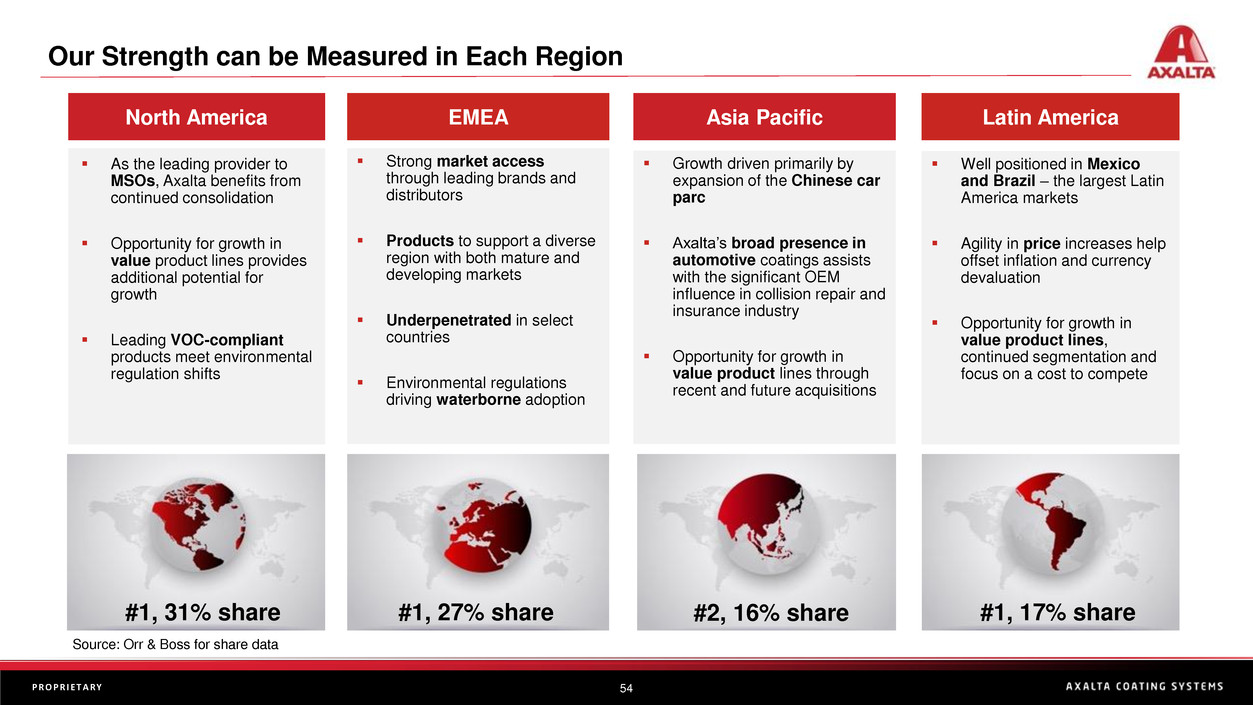
▪ Strong market access
through leading brands and
distributors
▪ Products to support a diverse
region with both mature and
developing markets
▪ Underpenetrated in select
countries
▪ Environmental regulations
driving waterborne adoption
North America EMEA
▪ As the leading provider to
MSOs, Axalta benefits from
continued consolidation
▪ Opportunity for growth in
value product lines provides
additional potential for
growth
▪ Leading VOC-compliant
products meet environmental
regulation shifts
▪ Growth driven primarily by
expansion of the Chinese car
parc
▪ Axalta’s broad presence in
automotive coatings assists
with the significant OEM
influence in collision repair and
insurance industry
▪ Opportunity for growth in
value product lines through
recent and future acquisitions
▪ Well positioned in Mexico
and Brazil – the largest Latin
America markets
▪ Agility in price increases help
offset inflation and currency
devaluation
▪ Opportunity for growth in
value product lines,
continued segmentation and
focus on a cost to compete
Asia Pacific Latin America
Our Strength can be Measured in Each Region
#1, 31% share #1, 27% share #2, 16% share #1, 17% share
Source: Orr & Boss for share data
55P R O P R I E T A R Y
Refinish Growth Drivers Globally
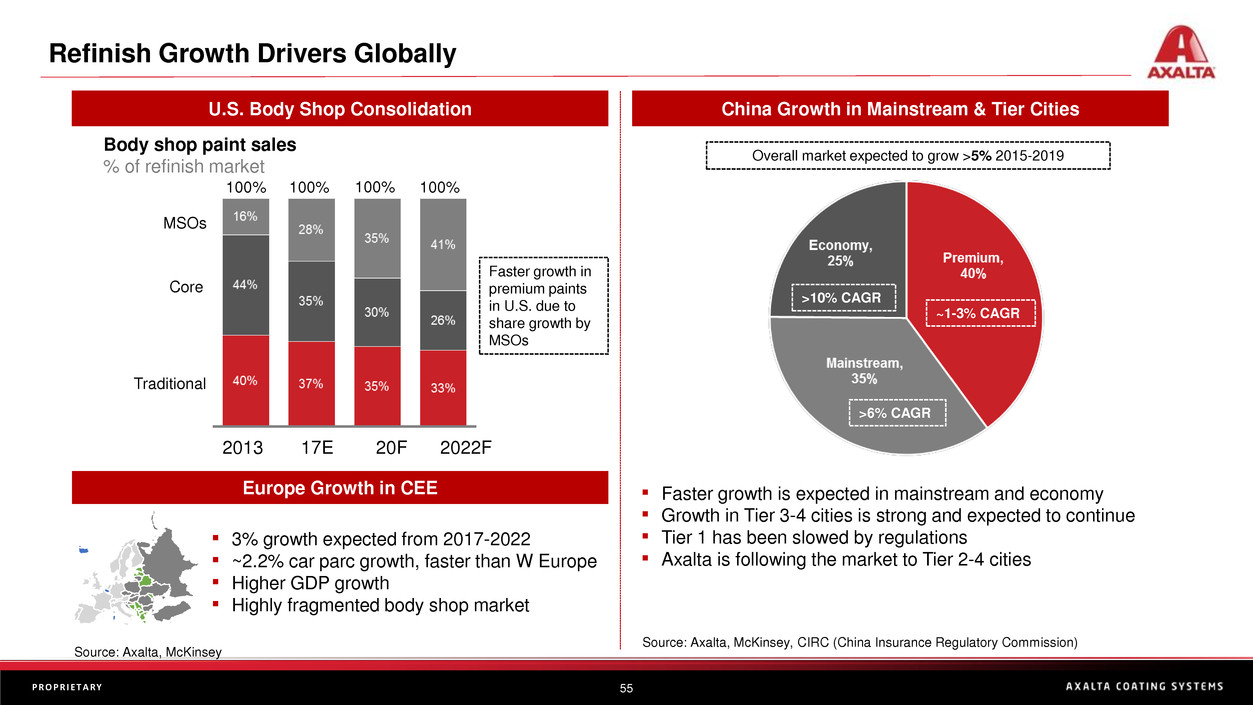
U.S. Body Shop Consolidation China Growth in Mainstream & Tier Cities
Source: Axalta, McKinsey, CIRC (China Insurance Regulatory Commission)
100%
Core
2022F
Traditional
MSOs
100%
17E
100%
2013 20F
100%
Body shop paint sales
% of refinish market
Europe Growth in CEE
▪ 3% growth expected from 2017-2022
▪ ~2.2% car parc growth, faster than W Europe
▪ Higher GDP growth
▪ Highly fragmented body shop market
Faster growth in
premium paints
in U.S. due to
share growth by
MSOs
Source: Axalta, McKinsey
▪ Faster growth is expected in mainstream and economy
▪ Growth in Tier 3-4 cities is strong and expected to continue
▪ Tier 1 has been slowed by regulations
▪ Axalta is following the market to Tier 2-4 cities
Overall market expected to grow >5% 2015-2019
~1-3% CAGR
>6% CAGR
>10% CAGR
56P R O P R I E T A R Y
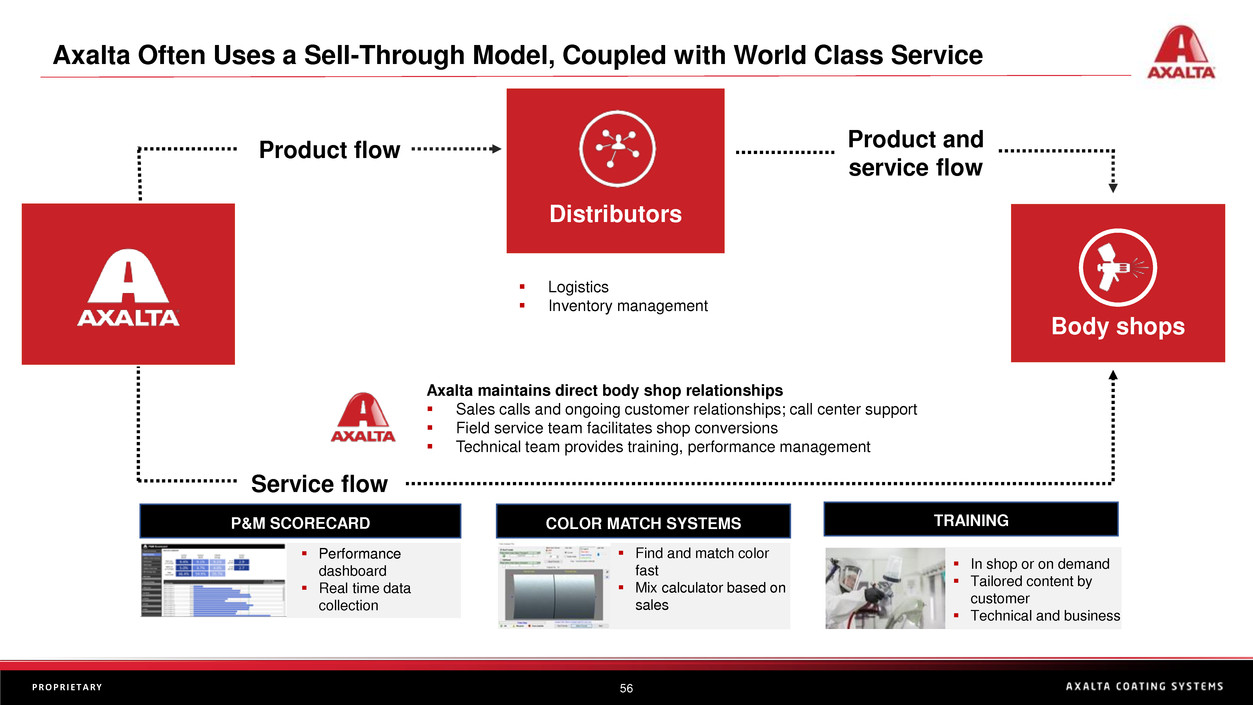
Axalta Often Uses a Sell-Through Model, Coupled with World Class Service
Axalta maintains direct body shop relationships
▪ Sales calls and ongoing customer relationships; call center support
▪ Field service team facilitates shop conversions
▪ Technical team provides training, performance management
Product flow
Service flow
Product and
service flow
Distributors
Body shops
▪ Logistics
▪ Inventory management
COLOR MATCH SYSTEMS
▪ Find and match color
fast
▪ Mix calculator based on
sales
TRAINING
▪ In shop or on demand
▪ Tailored content by
customer
▪ Technical and business
P&M SCORECARD
▪ Performance
dashboard
▪ Real time data
collection
57P R O P R I E T A R Y
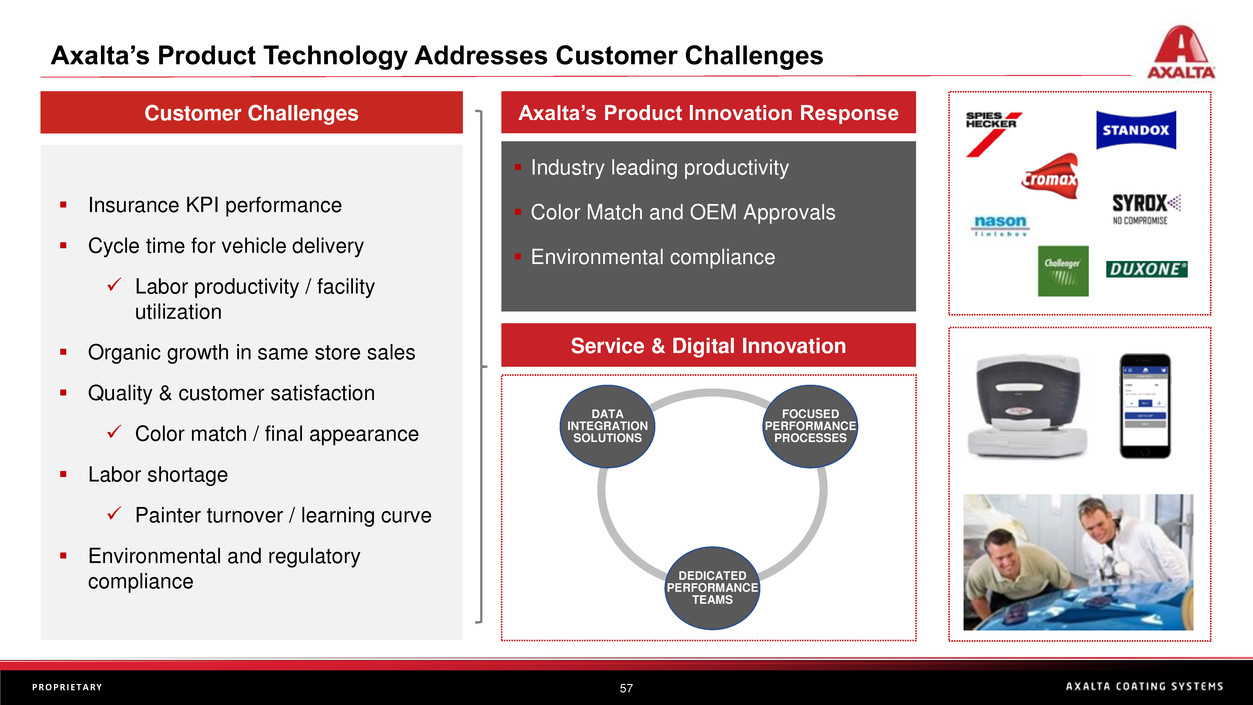
Customer Challenges Axalta’s Product Innovation Response
Axalta’s Product Technology Addresses Customer Challenges
▪ Industry leading productivity
▪ Color Match and OEM Approvals
▪ Environmental compliance
Service & Digital Innovation
DATA
INTEGRATION
SOLUTIONS
FOCUSED
PERFORMANCE
PROCESSES
DEDICATED
PERFORMANCE
TEAMS
▪ Insurance KPI performance
▪ Cycle time for vehicle delivery
✓ Labor productivity / facility
utilization
▪ Organic growth in same store sales
▪ Quality & customer satisfaction
✓ Color match / final appearance
▪ Labor shortage
✓ Painter turnover / learning curve
▪ Environmental and regulatory
compliance
58P R O P R I E T A R Y
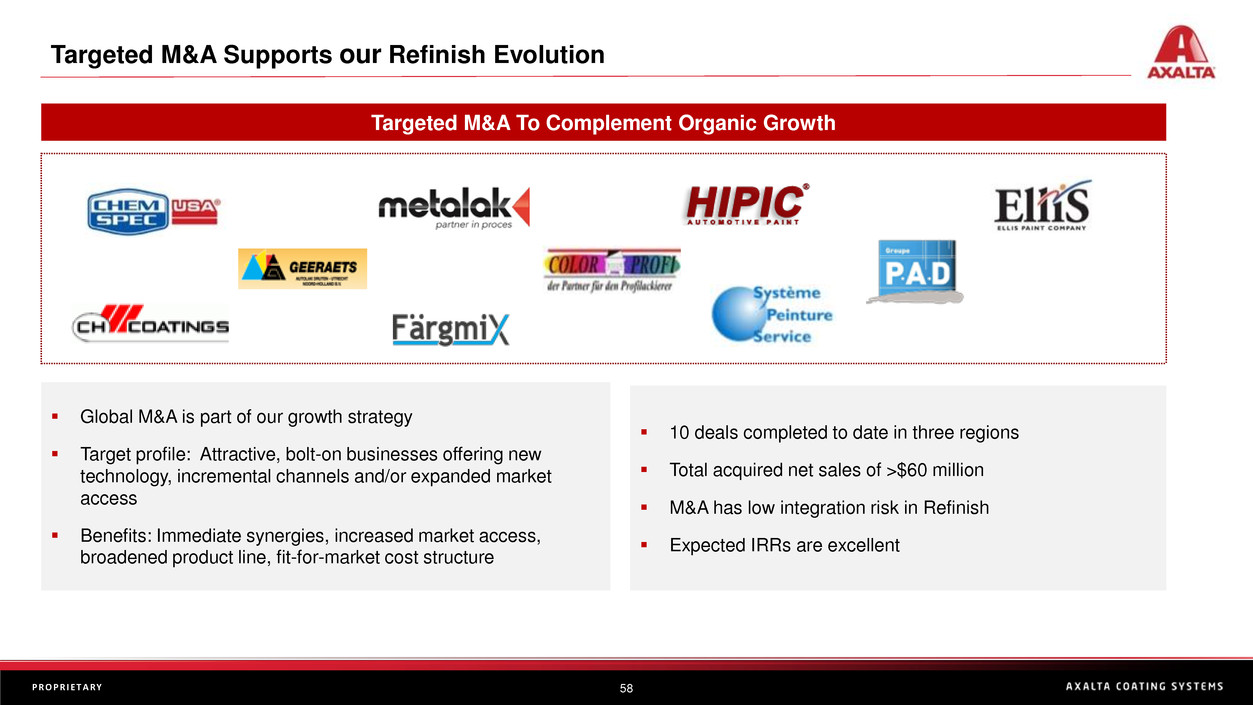
Targeted M&A Supports our Refinish Evolution
▪ Global M&A is part of our growth strategy
▪ Target profile: Attractive, bolt-on businesses offering new
technology, incremental channels and/or expanded market
access
▪ Benefits: Immediate synergies, increased market access,
broadened product line, fit-for-market cost structure
Targeted M&A To Complement Organic Growth
▪ 10 deals completed to date in three regions
▪ Total acquired net sales of >$60 million
▪ M&A has low integration risk in Refinish
▪ Expected IRRs are excellent
59P R O P R I E T A R Y
Refinish Summary
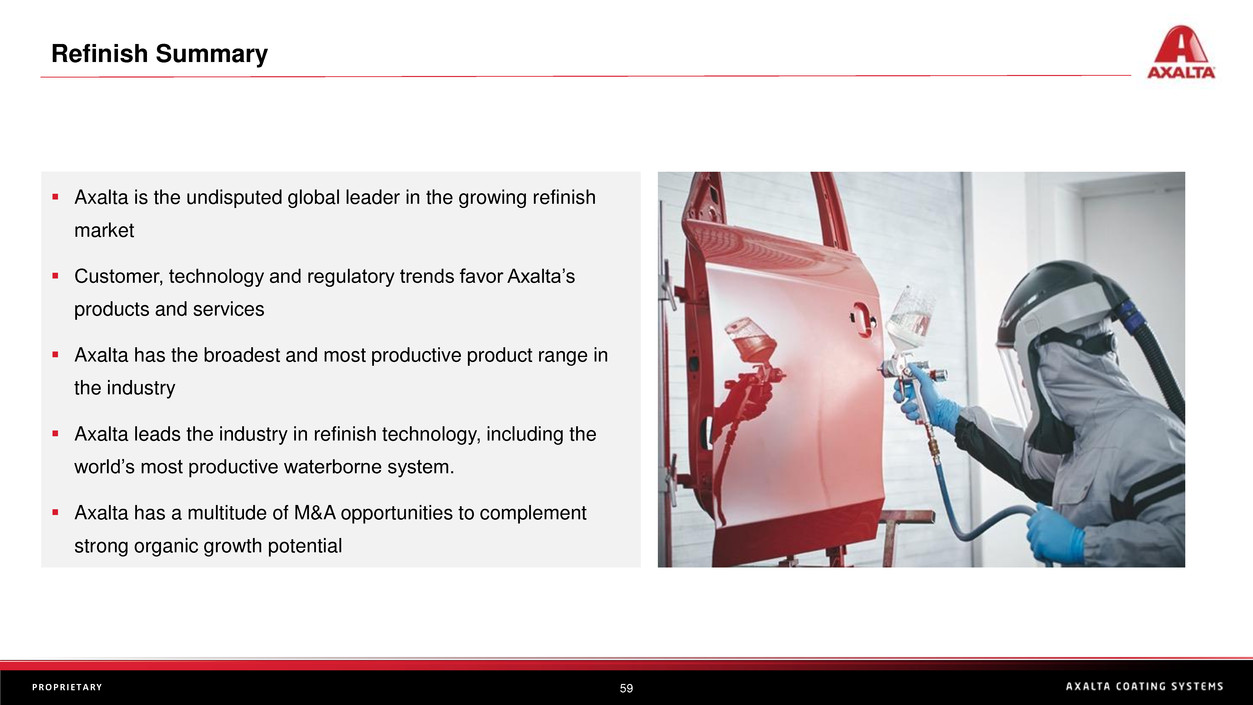
▪ Axalta is the undisputed global leader in the growing refinish
market
▪ Customer, technology and regulatory trends favor Axalta’s
products and services
▪ Axalta has the broadest and most productive product range in
the industry
▪ Axalta leads the industry in refinish technology, including the
world’s most productive waterborne system.
▪ Axalta has a multitude of M&A opportunities to complement
strong organic growth potential
Thank you!
Performance Coatings: Industrial
Mike Cash
SVP, President, Industrial Coatings
62P R O P R I E T A R Y
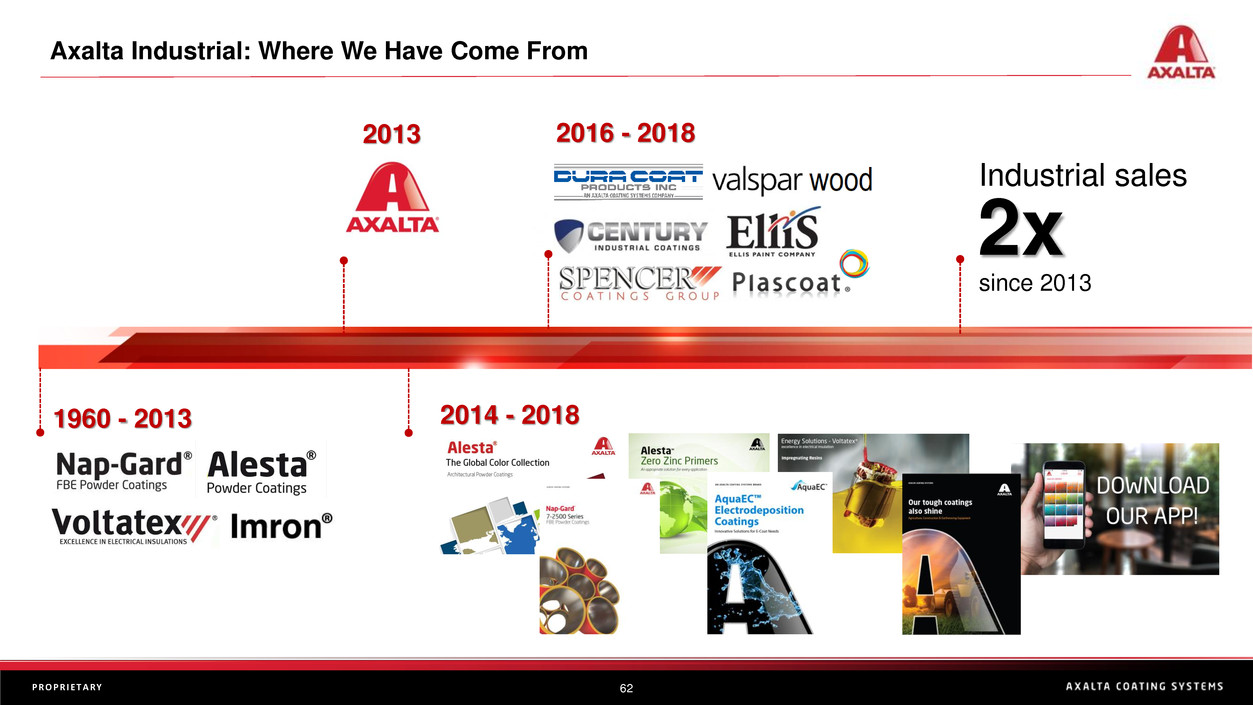
2016 - 2018
Axalta Industrial: Where We Have Come From
2013
1960 - 2013 2014 - 2018
Industrial sales
since 2013
2x
63P R O P R I E T A R Y
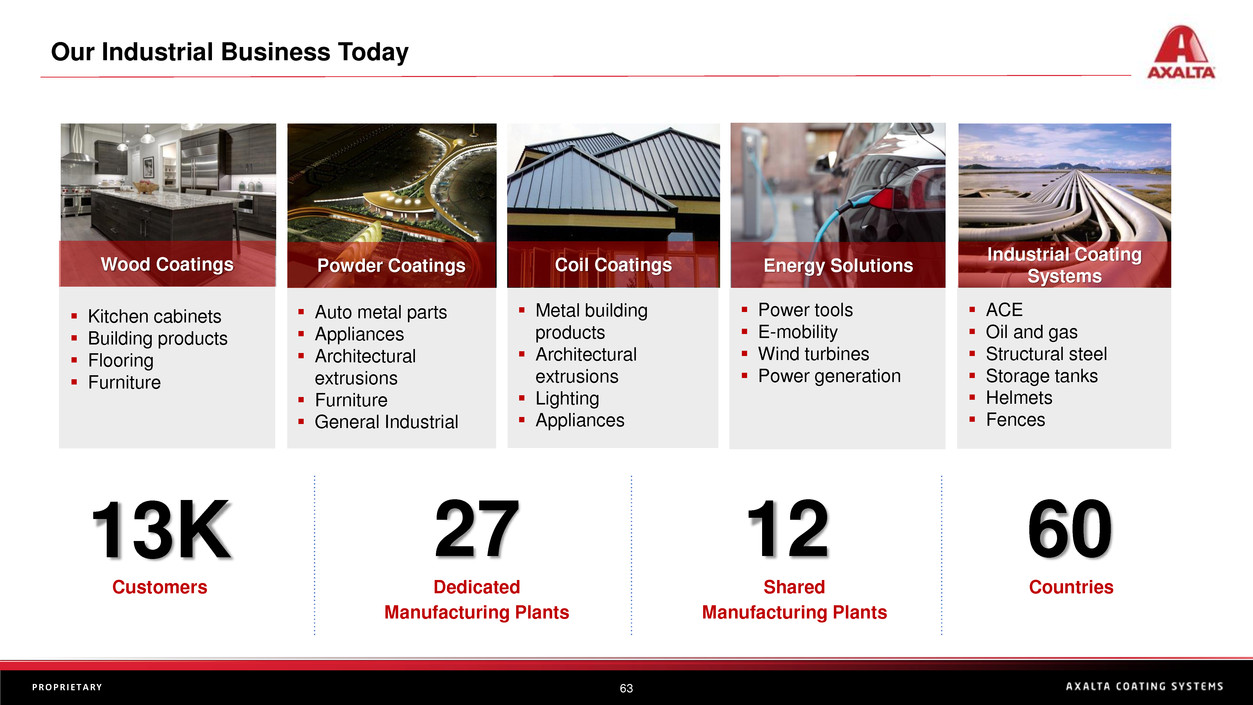
27
▪ Kitchen cabinets
▪ Building products
▪ Flooring
▪ Furniture
▪ Auto metal parts
▪ Appliances
▪ Architectural
extrusions
▪ Furniture
▪ General Industrial
▪ Metal building
products
▪ Architectural
extrusions
▪ Lighting
▪ Appliances
▪ Power tools
▪ E-mobility
▪ Wind turbines
▪ Power generation
▪ ACE
▪ Oil and gas
▪ Structural steel
▪ Storage tanks
▪ Helmets
▪ Fences
Wood Coatings Powder Coatings Coil Coatings Energy Solutions
Industrial Coating
Systems
Our Industrial Business Today
13K
Customers
60
Countries
12
Shared
Manufacturing Plants
Dedicated
Manufacturing Plants
64P R O P R I E T A R Y
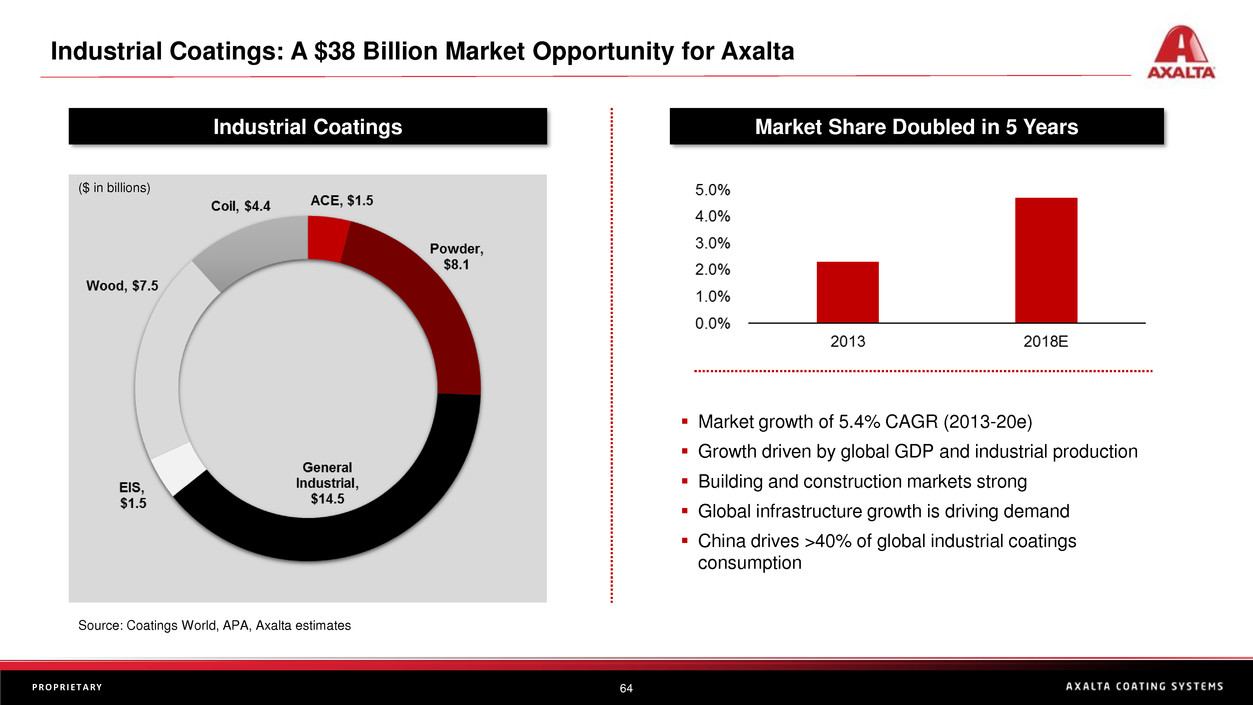
Market Share Doubled in 5 Years
Industrial Coatings: A $38 Billion Market Opportunity for Axalta
Source: Coatings World, APA, Axalta estimates
▪ Market growth of 5.4% CAGR (2013-20e)
▪ Growth driven by global GDP and industrial production
▪ Building and construction markets strong
▪ Global infrastructure growth is driving demand
▪ China drives >40% of global industrial coatings
consumption
Industrial Coatings
($ in billions)
65P R O P R I E T A R Y
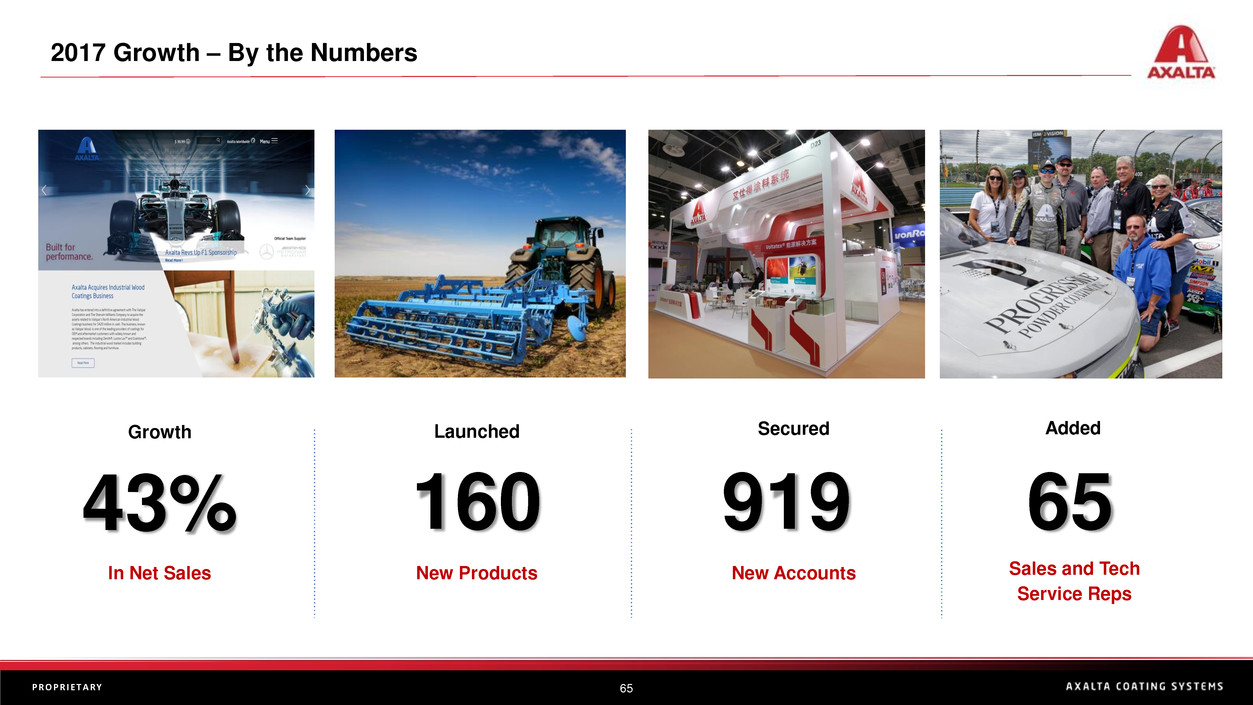
2017 Growth – By the Numbers
Growth
43%
In Net Sales
Added
65
Sales and Tech
Service Reps
Secured
919
New Accounts
Launched
160
New Products
66P R O P R I E T A R Y
Leading global supplier of thermoplastic powder coatings, based in the U.K.
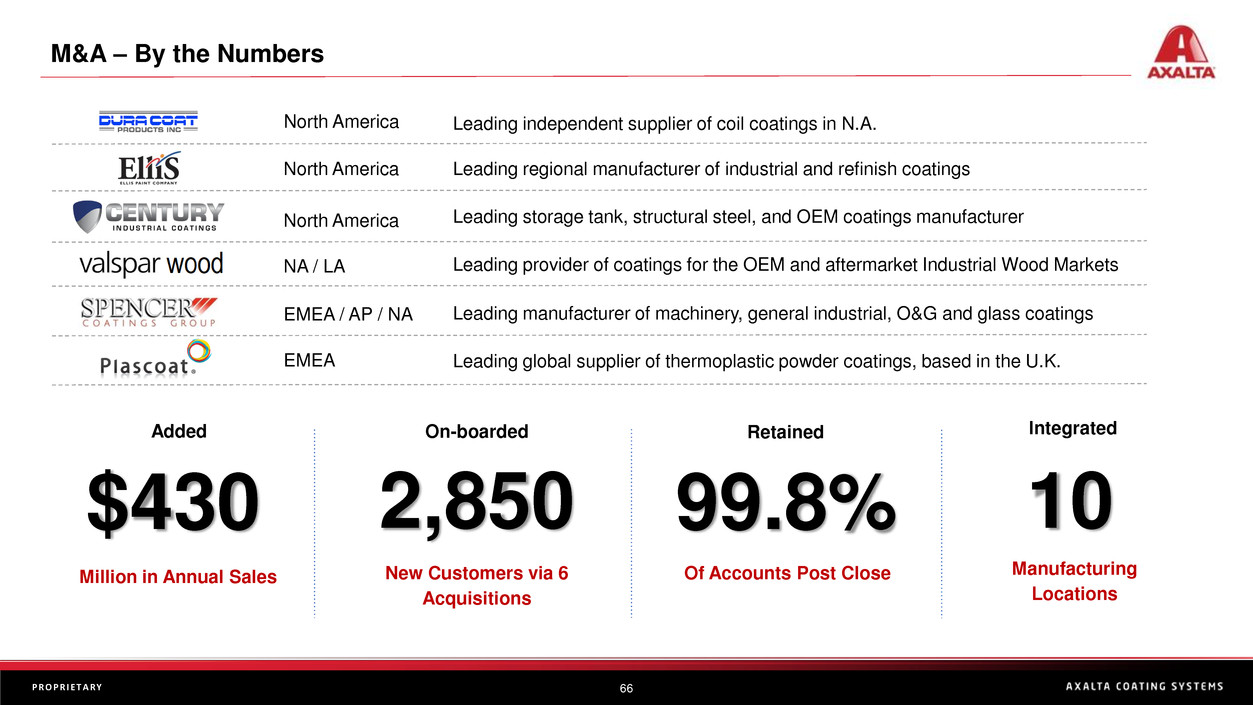
M&A – By the Numbers
Retained
99.8%
Of Accounts Post Close
Integrated
10
Manufacturing
Locations
Added
$430
Million in Annual Sales
On-boarded
2,850
New Customers via 6
Acquisitions
Leading independent supplier of coil coatings in N.A. North America
North America
North America
Leading regional manufacturer of industrial and refinish coatings
Leading storage tank, structural steel, and OEM coatings manufacturer
NA / LA Leading provider of coatings for the OEM and aftermarket Industrial Wood Markets
EMEA / AP / NA Leading manufacturer of machinery, general industrial, O&G and glass coatings
EMEA
67P R O P R I E T A R Y
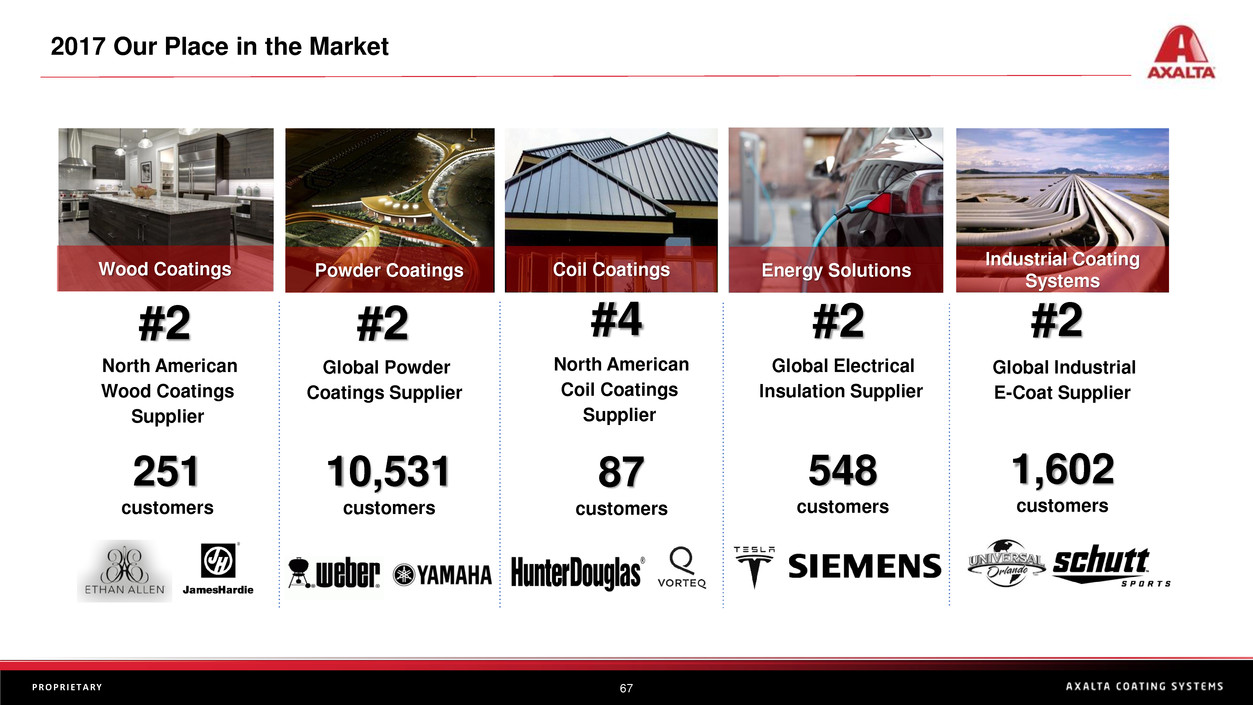
2017 Our Place in the Market
Wood Coatings Powder Coatings Coil Coatings Energy Solutions
Industrial Coating
Systems
#2
North American
Wood Coatings
Supplier
#2
Global Powder
Coatings Supplier
#4
North American
Coil Coatings
Supplier
#2
Global Electrical
Insulation Supplier
#2
Global Industrial
E-Coat Supplier
251
customers
10,531
customers
548
customers
1,602
customers
87
customers
68P R O P R I E T A R Y
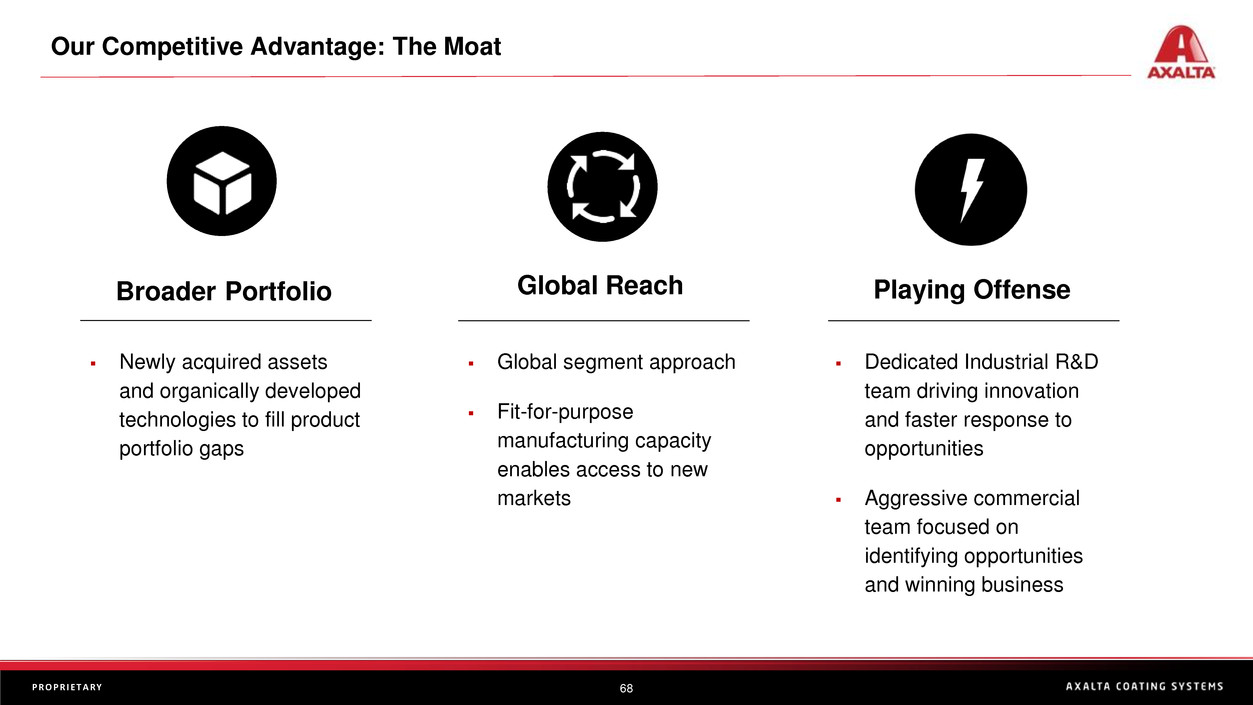
Broader Portfolio Global Reach Playing Offense
Our Competitive Advantage: The Moat
▪ Newly acquired assets
and organically developed
technologies to fill product
portfolio gaps
▪ Global segment approach
▪ Fit-for-purpose
manufacturing capacity
enables access to new
markets
▪ Dedicated Industrial R&D
team driving innovation
and faster response to
opportunities
▪ Aggressive commercial
team focused on
identifying opportunities
and winning business
69P R O P R I E T A R Y
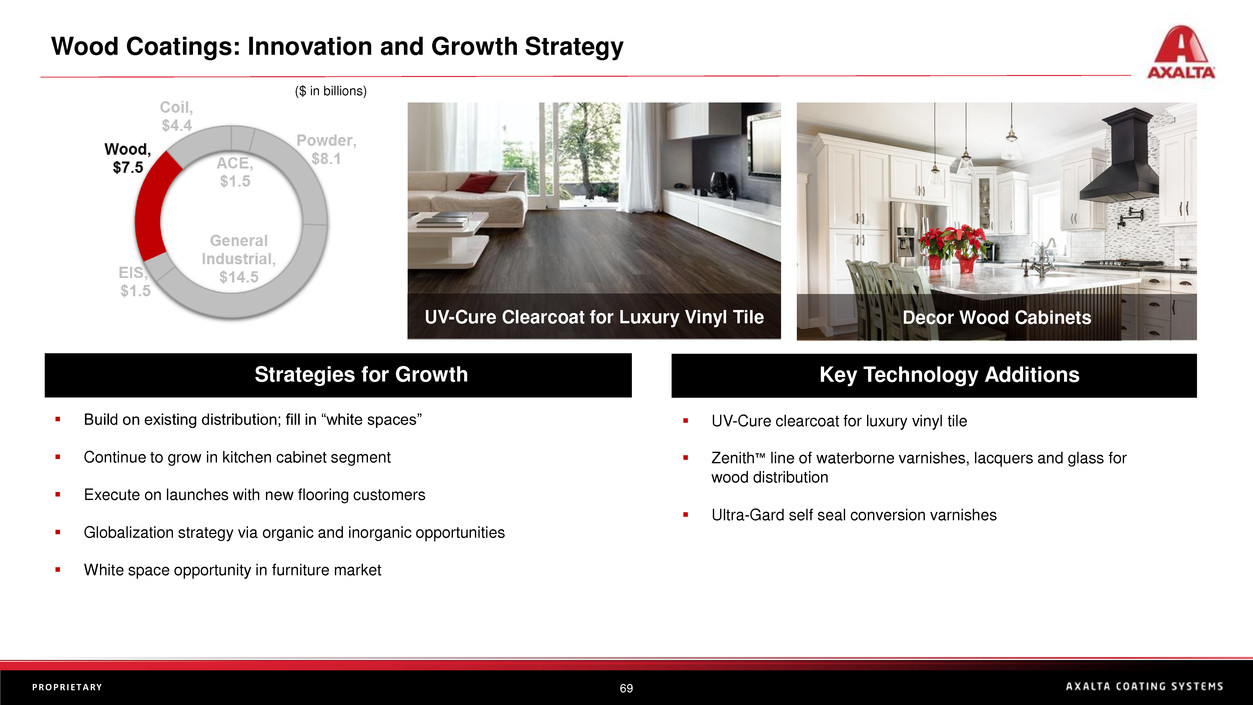
Wood Coatings: Innovation and Growth Strategy
UV-Cure Clearcoat for Luxury Vinyl Tile Decor Wood Cabinets
($ in billions)
▪ Build on existing distribution; fill in “white spaces”
▪ Continue to grow in kitchen cabinet segment
▪ Execute on launches with new flooring customers
▪ Globalization strategy via organic and inorganic opportunities
▪ White space opportunity in furniture market
▪ UV-Cure clearcoat for luxury vinyl tile
▪ Zenith™ line of waterborne varnishes, lacquers and glass for
wood distribution
▪ Ultra-Gard self seal conversion varnishes
Key Technologies Strategies for GrowthKey Technology AdditionsStrategies for Growth
70P R O P R I E T A R Y
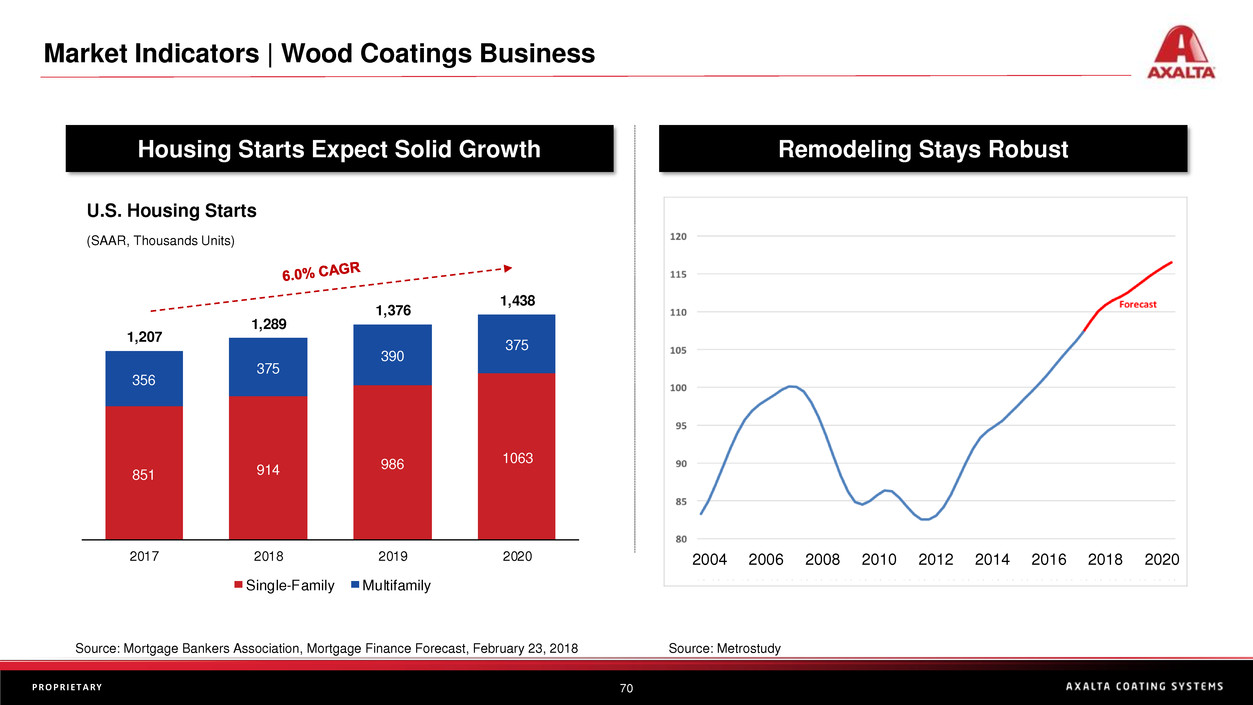
851 914
986 1063
356
375
390
375
1,207
1,289
1,376
1,438
2017 2018 2019 2020
Single-Family Multifamily
Source: Mortgage Bankers Association, Mortgage Finance Forecast, February 23, 2018
Housing Starts Expect Solid Growth Remodeling Stays Robust
Market Indicators | Wood Coatings Business
U.S. Housing Starts
(SAAR, Thousands Units)
Source: Metrostudy
2004 2006 2008 2010 2012 2014 2016 2018 2020
71P R O P R I E T A R Y
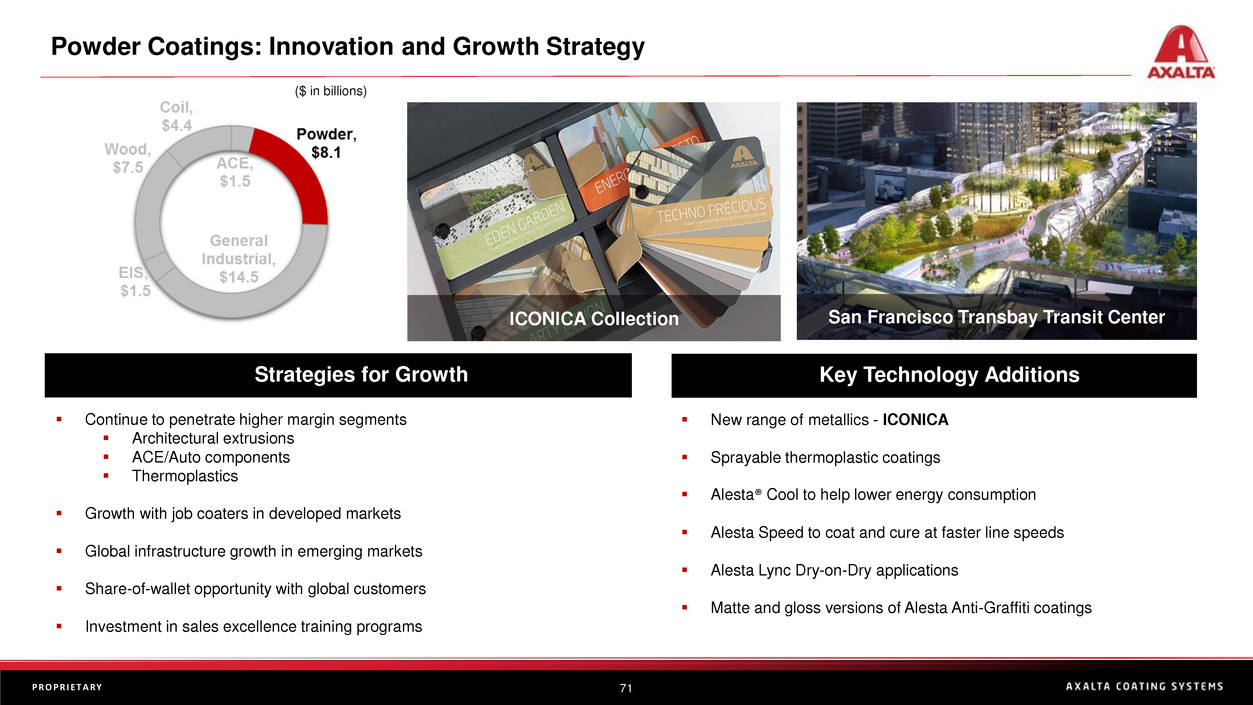
Powder Coatings: Innovation and Growth Strategy
ICONICA Collection San Francisco Transbay Transit Center
($ in billions)
▪ Continue to penetrate higher margin segments
▪ Architectural extrusions
▪ ACE/Auto components
▪ Thermoplastics
▪ Growth with job coaters in developed markets
▪ Global infrastructure growth in emerging markets
▪ Share-of-wallet opportunity with global customers
▪ Investment in sales excellence training programs
▪ New range of metallics - ICONICA
▪ Sprayable thermoplastic coatings
▪ Alesta® Cool to help lower energy consumption
▪ Alesta Speed to coat and cure at faster line speeds
▪ Alesta Lync Dry-on-Dry applications
▪ Matte and gloss versions of Alesta Anti-Graffiti coatings
Key Technologies Strategies for GrowthKey Technology AdditionsStrategies for Growth
72P R O P R I E T A R Y
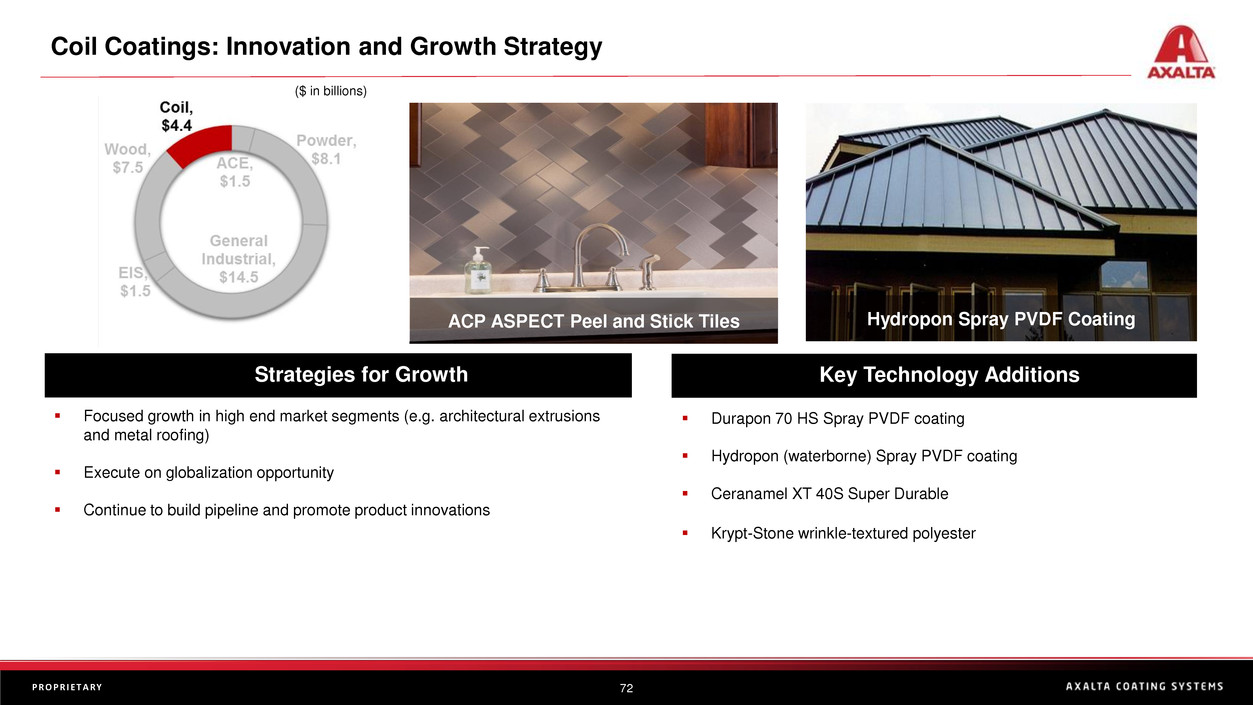
Coil Coatings: Innovation and Growth Strategy
ACP ASPECT Peel and Stick Tiles
($ in billions)
▪ Focused growth in high end market segments (e.g. architectural extrusions
and metal roofing)
▪ Execute on globalization opportunity
▪ Continue to build pipeline and promote product innovations
▪ Durapon 70 HS Spray PVDF coating
▪ Hydropon (waterborne) Spray PVDF coating
▪ Ceranamel XT 40S Super Durable
▪ Krypt-Stone wrinkle-textured polyester
Key Technologies Key Technology AdditionsStrategies for Growth
Key Technology AdditionsStrategies for Growth
Hydropon Spray PVDF Coating
73P R O P R I E T A R Y
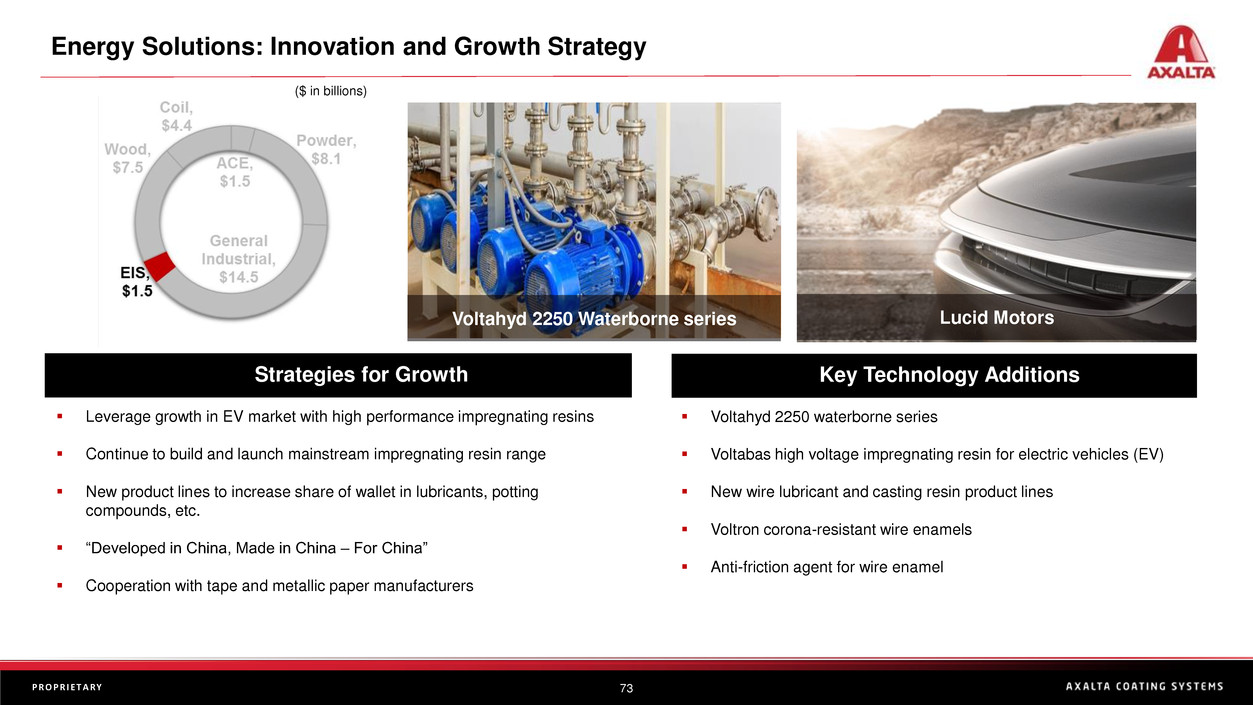
Energy Solutions: Innovation and Growth Strategy
Voltahyd 2250 Waterborne series Lucid Motors
($ in billions)
▪ Leverage growth in EV market with high performance impregnating resins
▪ Continue to build and launch mainstream impregnating resin range
▪ New product lines to increase share of wallet in lubricants, potting
compounds, etc.
▪ “Developed in China, Made in China – For China”
▪ Cooperation with tape and metallic paper manufacturers
▪ Voltahyd 2250 waterborne series
▪ Voltabas high voltage impregnating resin for electric vehicles (EV)
▪ New wire lubricant and casting resin product lines
▪ Voltron corona-resistant wire enamels
▪ Anti-friction agent for wire enamel
Strategies for GrowthStrategies for GrowthKey Technologies Key Technology AdditionsStrategies for Growth
74P R O P R I E T A R Y
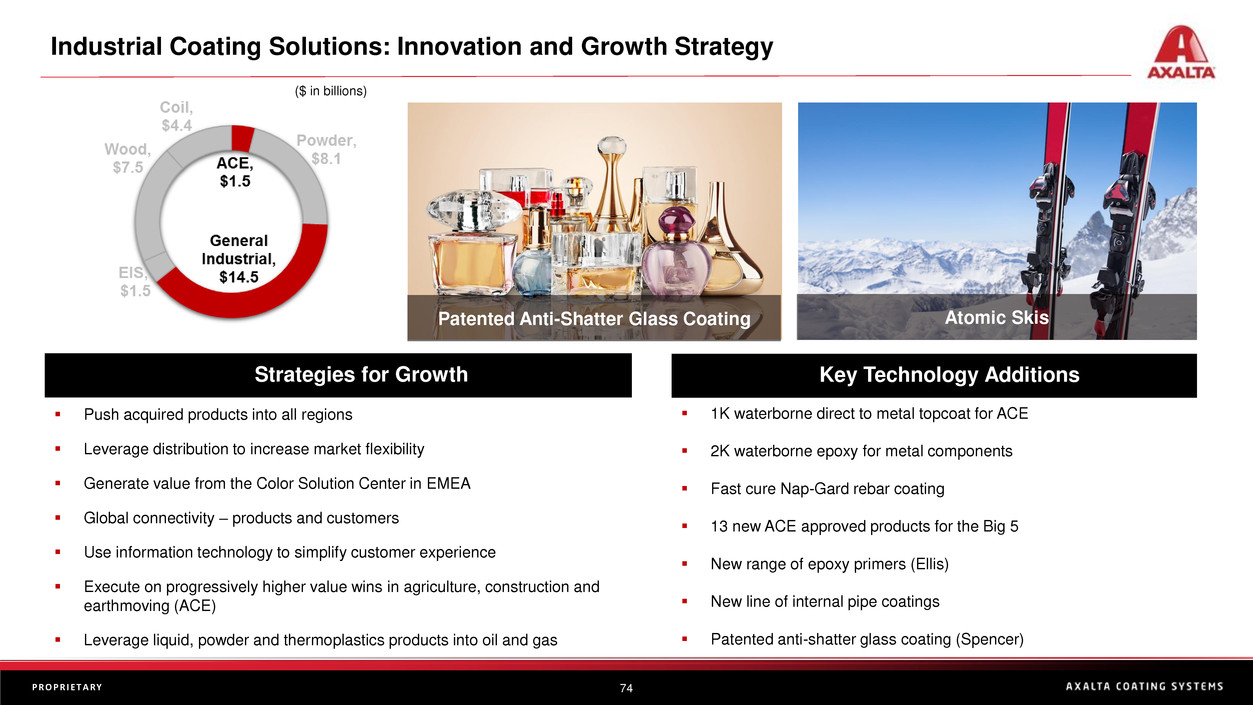
Industrial Coating Solutions: Innovation and Growth Strategy
Patented Anti-Shatter Glass Coating Atomic Skis
($ in billions)
▪ Push acquired products into all regions
▪ Leverage distribution to increase market flexibility
▪ Generate value from the Color Solution Center in EMEA
▪ Global connectivity – products and customers
▪ Use information technology to simplify customer experience
▪ Execute on progressively higher value wins in agriculture, construction and
earthmoving (ACE)
▪ Leverage liquid, powder and thermoplastics products into oil and gas
▪ 1K waterborne direct to metal topcoat for ACE
▪ 2K waterborne epoxy for metal components
▪ Fast cure Nap-Gard rebar coating
▪ 13 new ACE approved products for the Big 5
▪ New range of epoxy primers (Ellis)
▪ New line of internal pipe coatings
▪ Patented anti-shatter glass coating (Spencer)
Key Technologies Strategies for GrowthKey Technology AdditionsStrategies for Growth
75P R O P R I E T A R Y
Summary
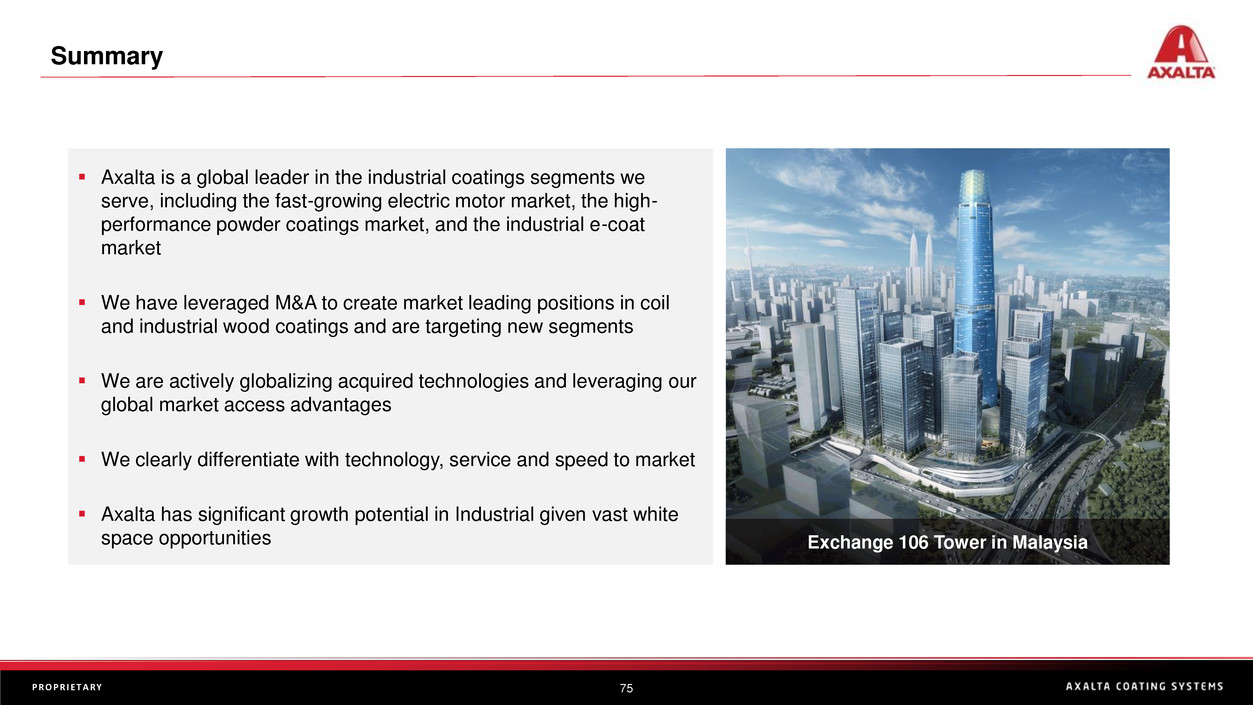
▪ Axalta is a global leader in the industrial coatings segments we
serve, including the fast-growing electric motor market, the high-
performance powder coatings market, and the industrial e-coat
market
▪ We have leveraged M&A to create market leading positions in coil
and industrial wood coatings and are targeting new segments
▪ We are actively globalizing acquired technologies and leveraging our
global market access advantages
▪ We clearly differentiate with technology, service and speed to market
▪ Axalta has significant growth potential in Industrial given vast white
space opportunities Exchange 106 Tower in Malaysia
Thank you!
Transportation Coatings
Steve Markevich
EVP, President, Transportation Coatings and Greater China
78P R O P R I E T A R Y
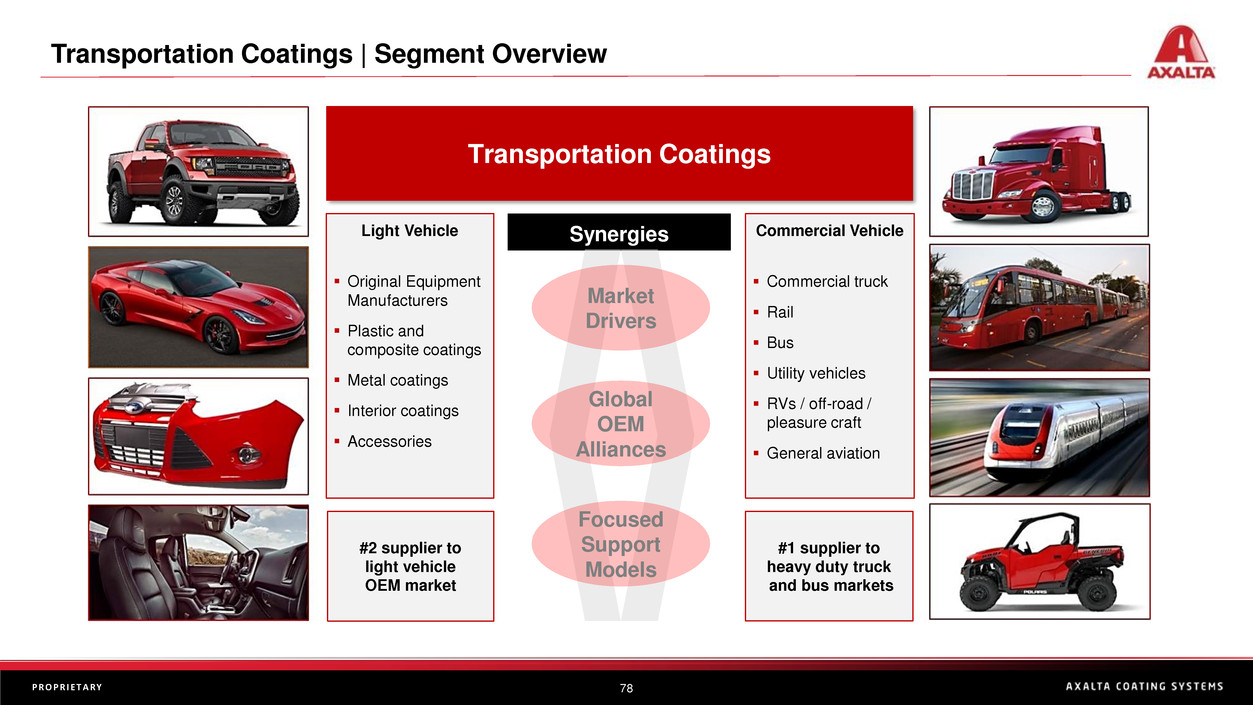
Transportation Coatings | Segment Overview
#2 supplier to
light vehicle
OEM market
Transportation Coatings
Light Vehicle
▪ Original Equipment
Manufacturers
▪ Plastic and
composite coatings
▪ Metal coatings
▪ Interior coatings
▪ Accessories
#1 supplier to
heavy duty truck
and bus markets
Commercial Vehicle
▪ Commercial truck
▪ Rail
▪ Bus
▪ Utility vehicles
▪ RVs / off-road /
pleasure craft
▪ General aviation
Synergies
Global
OEM
Alliances
Focused
Support
Models
Market
Drivers
79P R O P R I E T A R Y
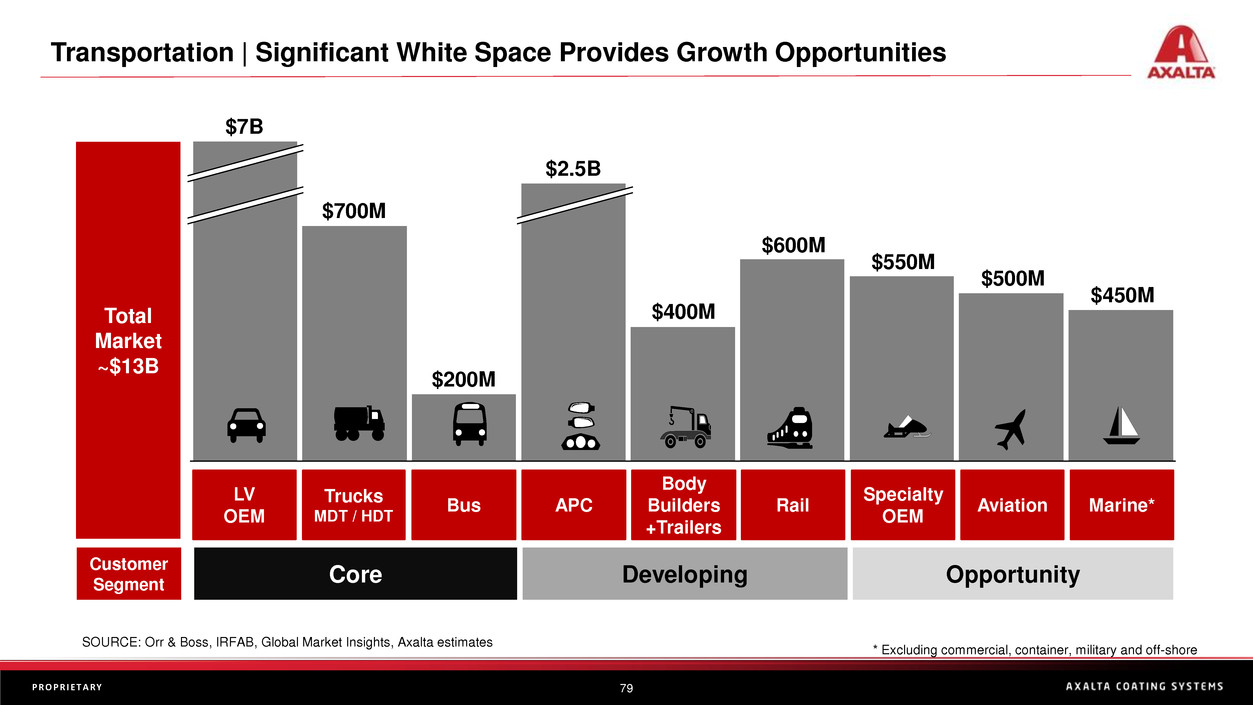
Transportation | Significant White Space Provides Growth Opportunities
~
Total
Market
~$13B
SOURCE: Orr & Boss, IRFAB, Global Market Insights, Axalta estimates
* Excluding commercial, container, military and off-shore
Core Developing Opportunity
Customer
Segment
$7B
$700M
$500M
$550M
$450M
$400M
$2.5B
$600M
$200M
LV
OEM
APC
Body
Builders
+Trailers
Rail
Specialty
OEM
Aviation Marine*
Trucks
MDT / HDT
Bus
80P R O P R I E T A R Y
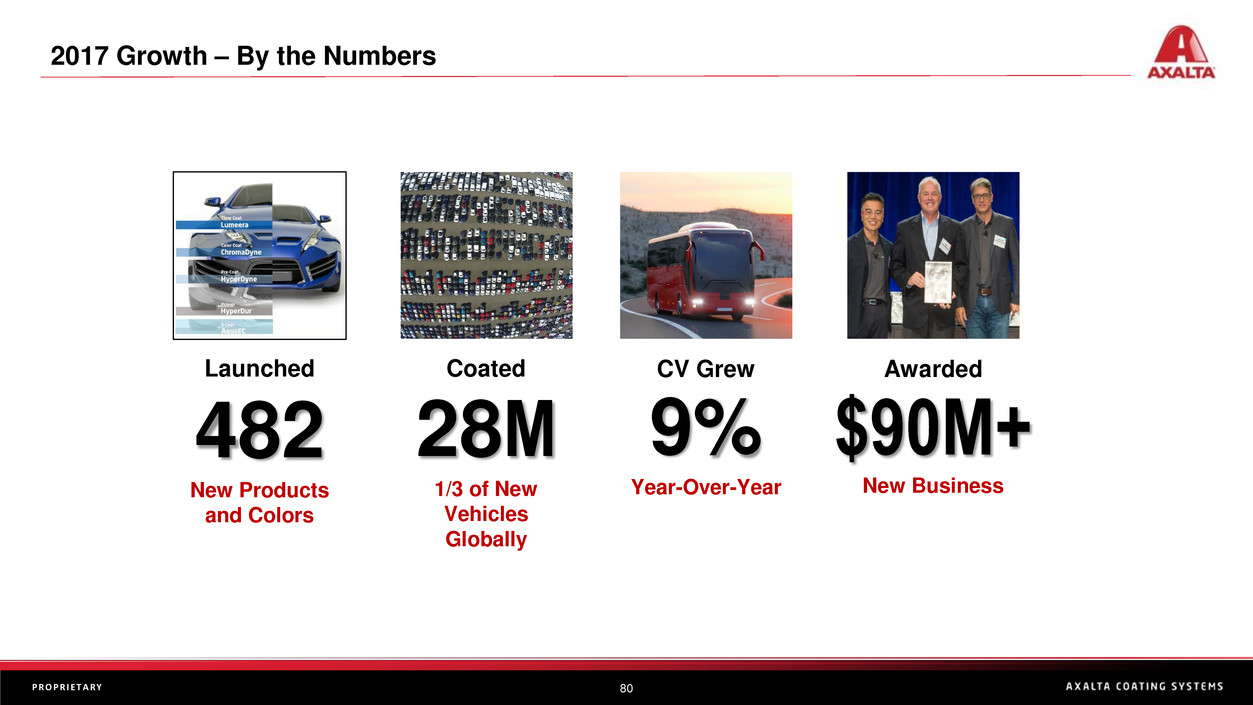
2017 Growth – By the Numbers
Launched Coated CV Grew Awarded
482
New Products
and Colors
28M
1/3 of New
Vehicles
Globally
9%
Year-Over-Year
$90M+
New Business
81P R O P R I E T A R Y
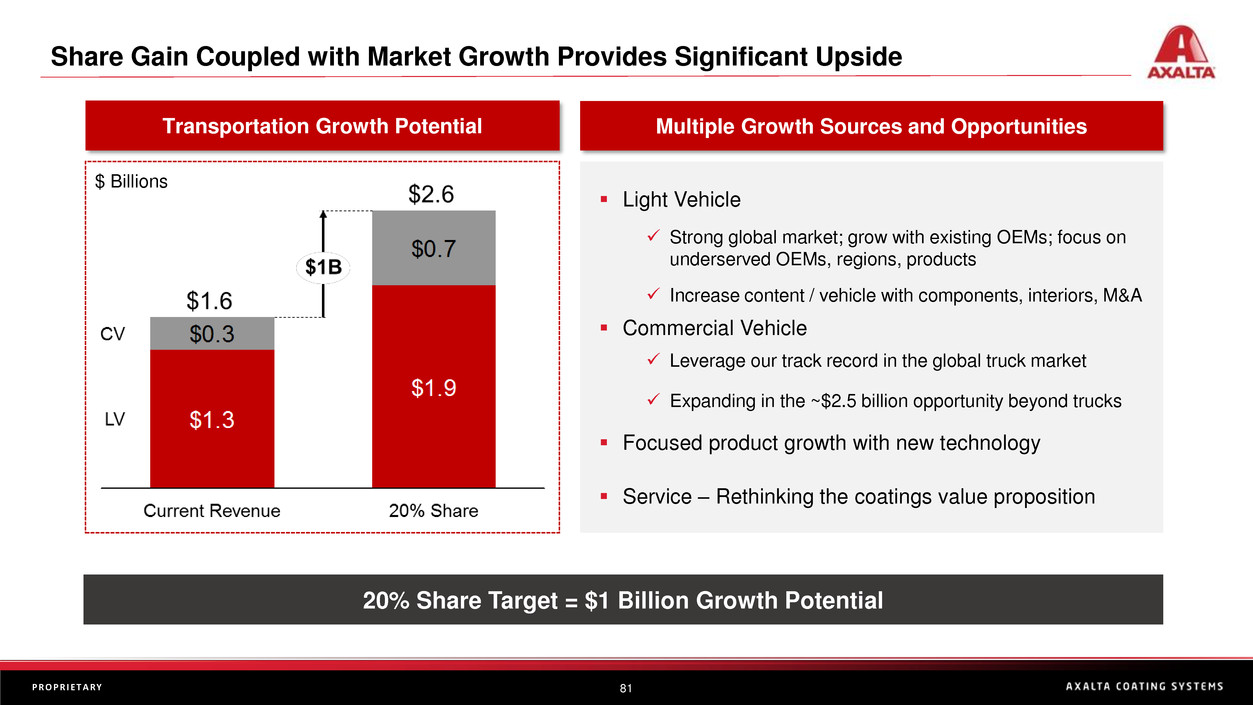
Share Gain Coupled with Market Growth Provides Significant Upside
▪ Light Vehicle
✓ Strong global market; grow with existing OEMs; focus on
underserved OEMs, regions, products
✓ Increase content / vehicle with components, interiors, M&A
▪ Commercial Vehicle
✓ Leverage our track record in the global truck market
✓ Expanding in the ~$2.5 billion opportunity beyond trucks
▪ Focused product growth with new technology
▪ Service – Rethinking the coatings value proposition
Multiple Growth Sources and OpportunitiesTransportation Growth Potential
20% Share Target = $1 Billion Growth Potential
$ Billions
82P R O P R I E T A R Y
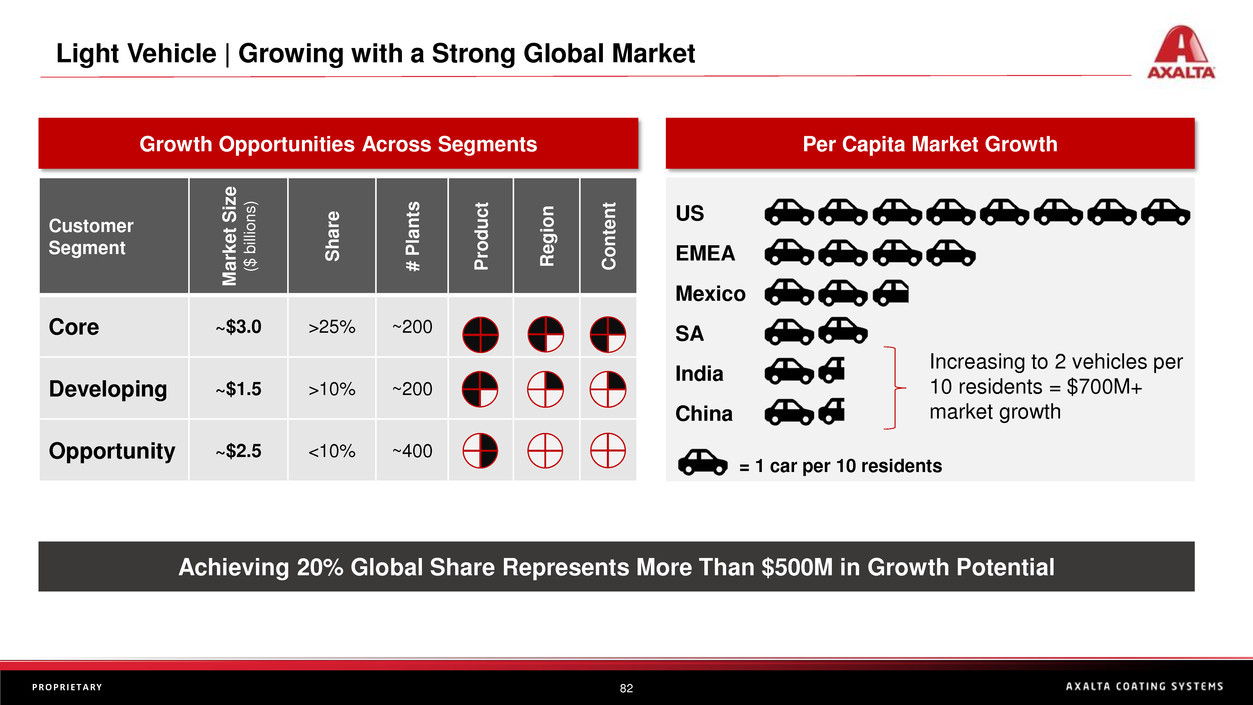
Light Vehicle | Growing with a Strong Global Market
US
EMEA
SA
China
Mexico
India
Per Capita Market Growth
Increasing to 2 vehicles per
10 residents = $700M+
market growth
= 1 car per 10 residents
Achieving 20% Global Share Represents More Than $500M in Growth Potential
Growth Opportunities Across Segments
Customer
Segment
M
a
rk
e
t
S
iz
e
($
b
ill
io
n
s
)
S
h
a
re
#
P
la
n
ts
P
ro
d
u
c
t
R
e
g
io
n
C
o
n
te
n
t
Core ~$3.0 >25% ~200
Developing ~$1.5 >10% ~200
Opportunity ~$2.5 <10% ~400
83P R O P R I E T A R Y
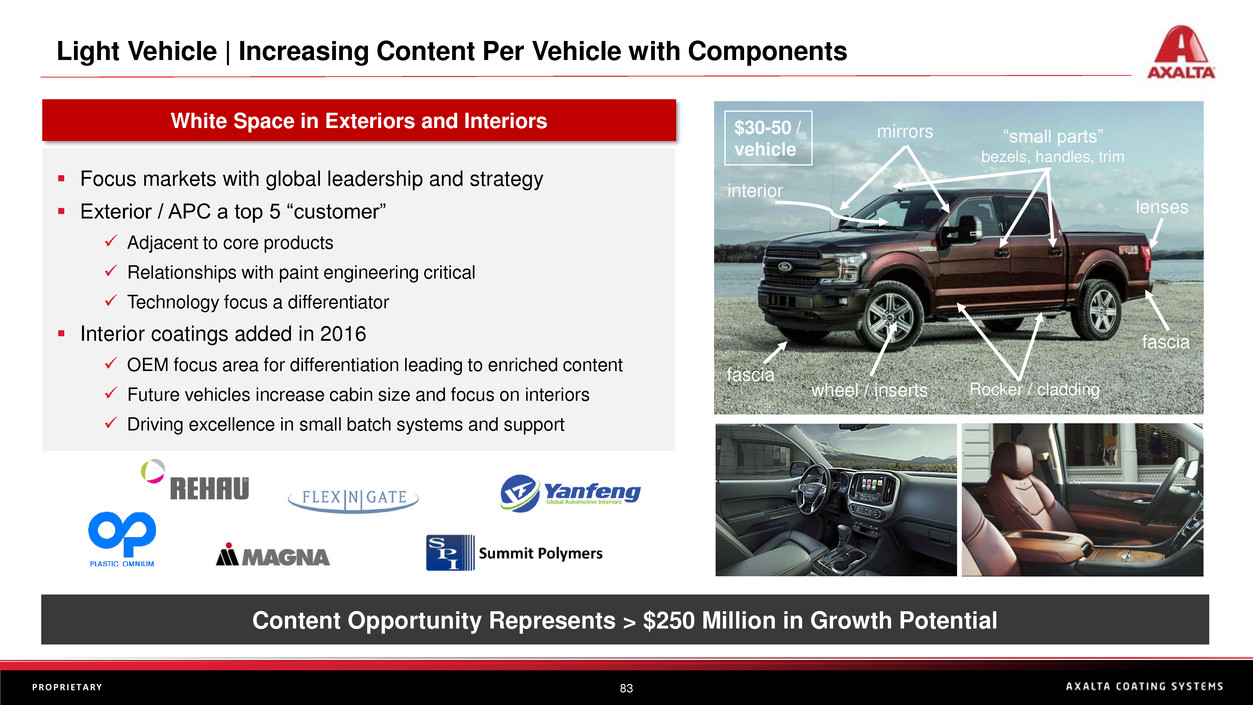
Light Vehicle | Increasing Content Per Vehicle with Components
▪ Focus markets with global leadership and strategy
▪ Exterior / APC a top 5 “customer”
✓ Adjacent to core products
✓ Relationships with paint engineering critical
✓ Technology focus a differentiator
▪ Interior coatings added in 2016
✓ OEM focus area for differentiation leading to enriched content
✓ Future vehicles increase cabin size and focus on interiors
✓ Driving excellence in small batch systems and support
mirrors
fascia
Rocker / cladding
interior
lenses
fascia
wheel / inserts
“small parts”
bezels, handles, trim
Content Opportunity Represents > $250 Million in Growth Potential
White Space in Exteriors and Interiors $30-50 /
vehicle
84P R O P R I E T A R Y
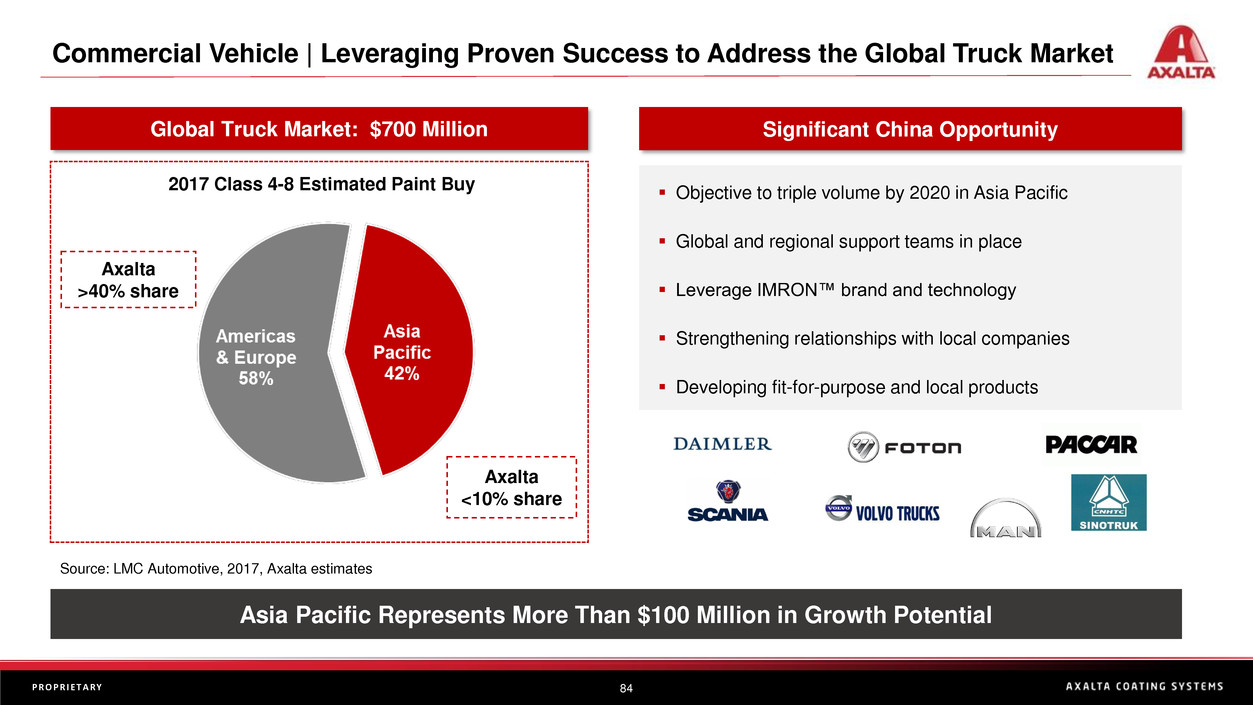
Global Truck Market: $700 Million Significant China Opportunity
2017 Class 4-8 Estimated Paint Buy
Source: LMC Automotive, 2017, Axalta estimates
Commercial Vehicle | Leveraging Proven Success to Address the Global Truck Market
Axalta
>40% share
Axalta
<10% share
▪ Objective to triple volume by 2020 in Asia Pacific
▪ Global and regional support teams in place
▪ Leverage IMRON™ brand and technology
▪ Strengthening relationships with local companies
▪ Developing fit-for-purpose and local products
Asia Pacific Represents More Than $100 Million in Growth Potential
85P R O P R I E T A R Y
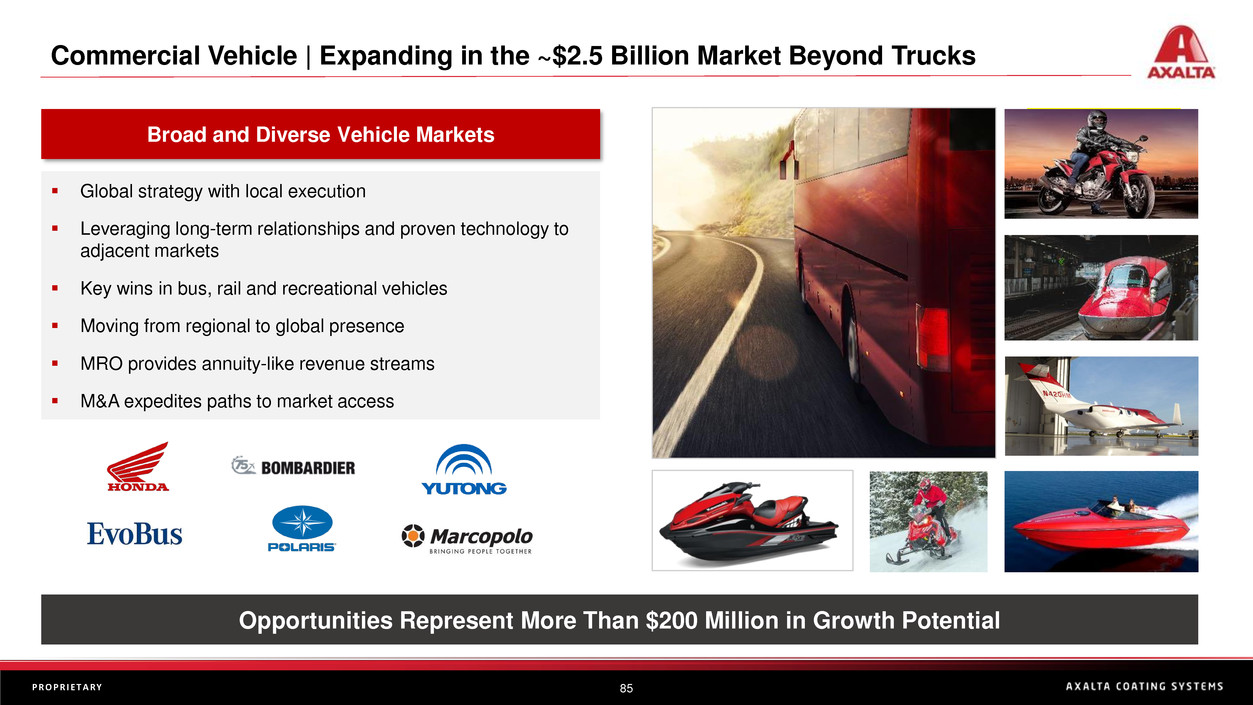
Commercial Vehicle | Expanding in the ~$2.5 Billion Market Beyond Trucks
▪ Global strategy with local execution
▪ Leveraging long-term relationships and proven technology to
adjacent markets
▪ Key wins in bus, rail and recreational vehicles
▪ Moving from regional to global presence
▪ MRO provides annuity-like revenue streams
▪ M&A expedites paths to market access
Motorcycle
pic (honda)
Opportunities Represent More Than $200 Million in Growth Potential
Broad and Diverse Vehicle Markets
86P R O P R I E T A R Y
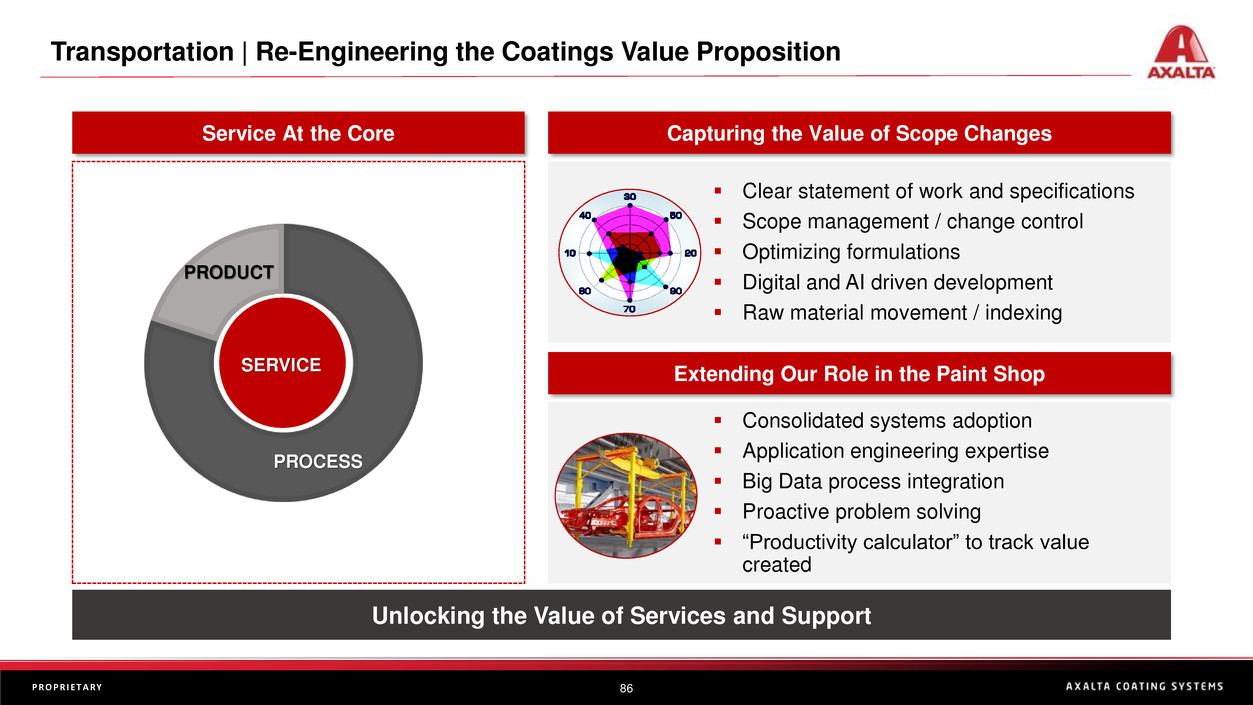
Transportation | Re-Engineering the Coatings Value Proposition
Capturing the Value of Scope Changes
Unlocking the Value of Services and Support
SERVICE
PROCESS
PRODUCT
▪ Clear statement of work and specifications
▪ Scope management / change control
▪ Optimizing formulations
▪ Digital and AI driven development
▪ Raw material movement / indexing
▪ Consolidated systems adoption
▪ Application engineering expertise
▪ Big Data process integration
▪ Proactive problem solving
▪ “Productivity calculator” to track value
created
Service At the Core
Extending Our Role in the Paint Shop
87P R O P R I E T A R Y
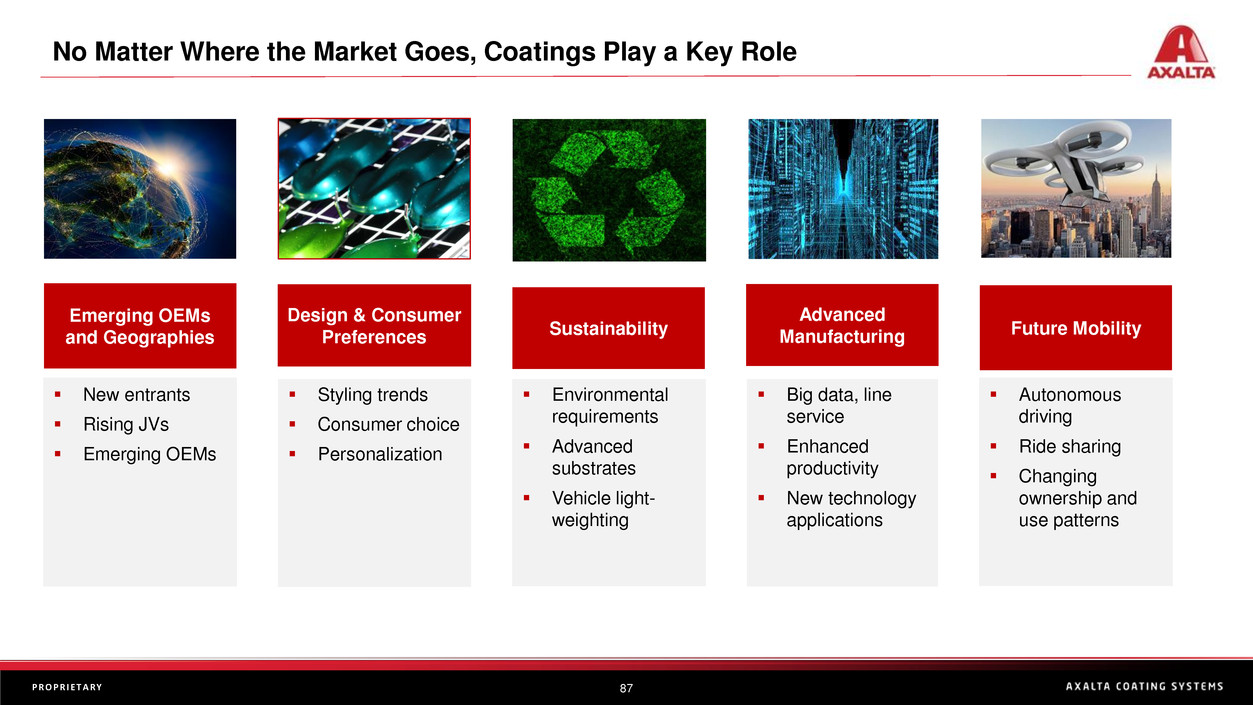
▪ Autonomous
driving
▪ Ride sharing
▪ Changing
ownership and
use patterns
Future Mobility
Emerging OEMs
and Geographies
Advanced
ManufacturingSustainability
Design & Consumer
Preferences
▪ New entrants
▪ Rising JVs
▪ Emerging OEMs
▪ Big data, line
service
▪ Enhanced
productivity
▪ New technology
applications
▪ Environmental
requirements
▪ Advanced
substrates
▪ Vehicle light-
weighting
▪ Styling trends
▪ Consumer choice
▪ Personalization
No Matter Where the Market Goes, Coatings Play a Key Role
88P R O P R I E T A R Y
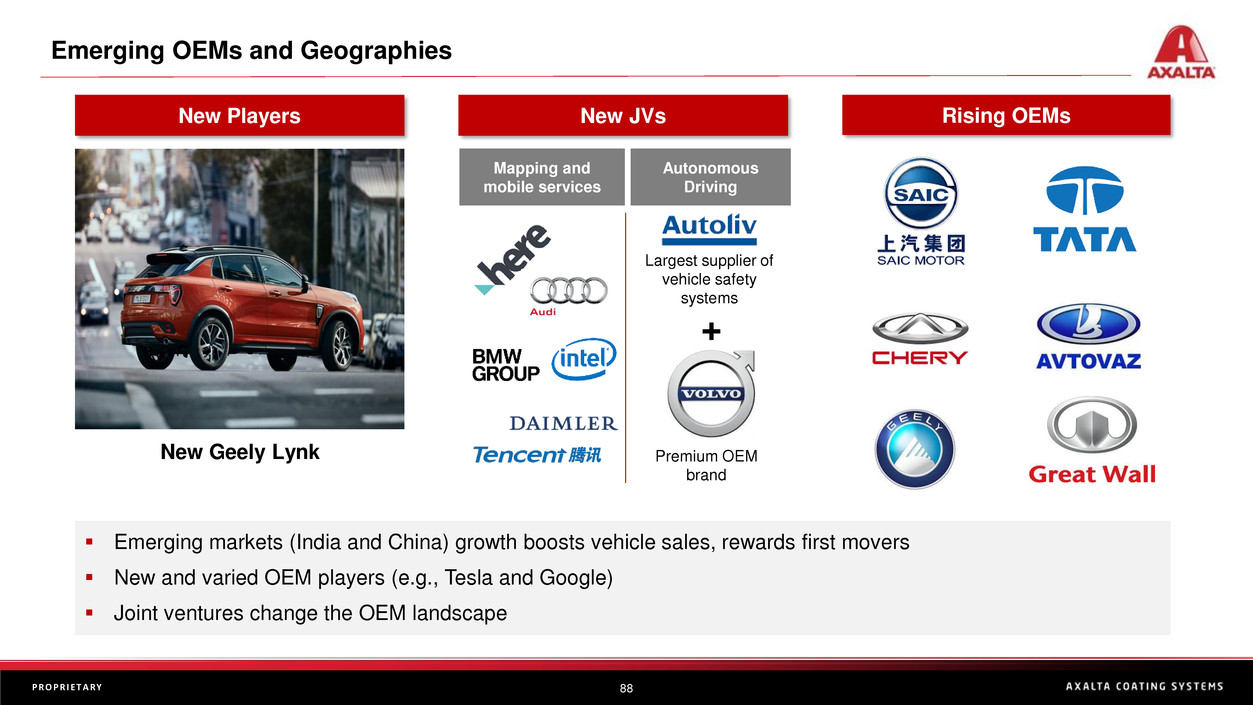
▪ Emerging markets (India and China) growth boosts vehicle sales, rewards first movers
▪ New and varied OEM players (e.g., Tesla and Google)
▪ Joint ventures change the OEM landscape
New Players New JVs
+
Largest supplier of
vehicle safety
systems
Premium OEM
brand
Autonomous
Driving
Mapping and
mobile services
Rising OEMs
Emerging OEMs and Geographies
New Geely Lynk
89P R O P R I E T A R Y
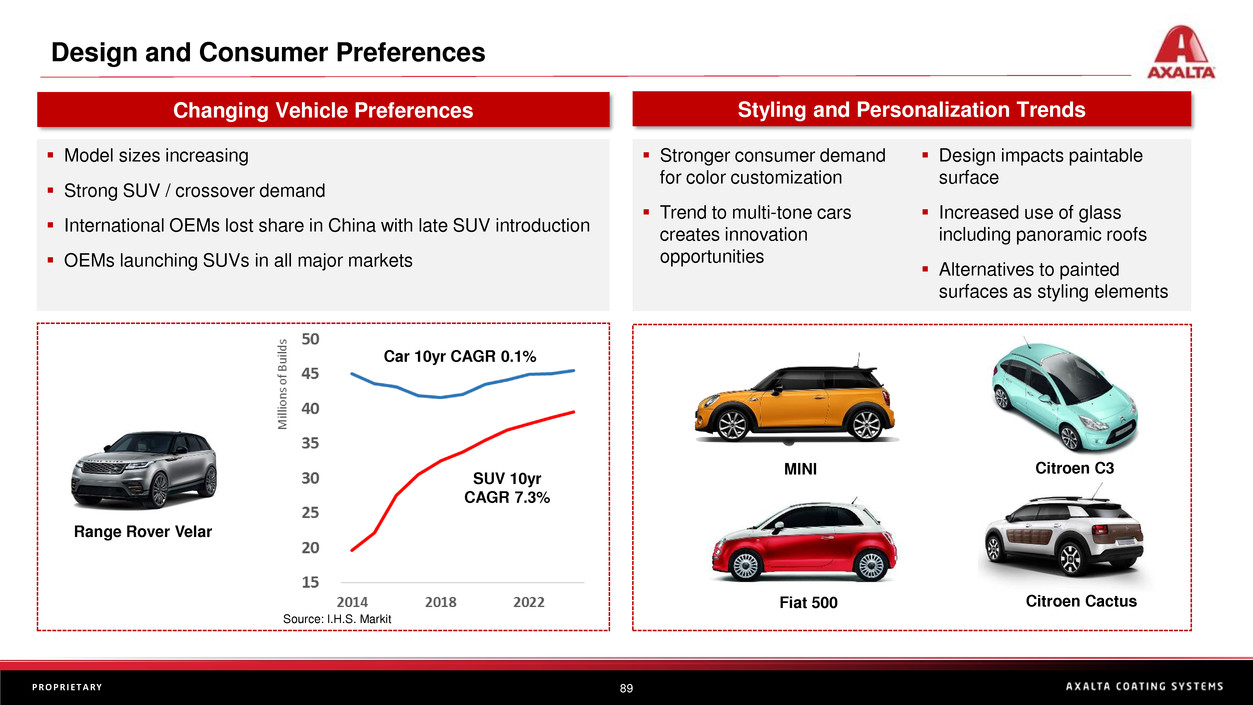
▪ Model sizes increasing
▪ Strong SUV / crossover demand
▪ International OEMs lost share in China with late SUV introduction
▪ OEMs launching SUVs in all major markets
Range Rover Velar
Changing Vehicle Preferences
Source: I.H.S. Markit
Styling and Personalization Trends
▪ Design impacts paintable
surface
▪ Increased use of glass
including panoramic roofs
▪ Alternatives to painted
surfaces as styling elements
▪ Stronger consumer demand
for color customization
▪ Trend to multi-tone cars
creates innovation
opportunities
Fiat 500
MINI
Citroen Cactus
Citroen C3
Design and Consumer Preferences
SUV 10yr
CAGR 7.3%
Car 10yr CAGR 0.1%
90P R O P R I E T A R Y
Source: I.H.S. Markit
Market Drivers
▪ New corrosion challenges
▪ Multiple substrate uniformity
▪ Plastics heat distortion
▪ Regulations for environment, health and safety
▪ Coatings for higher voltage and frequency electrical
components
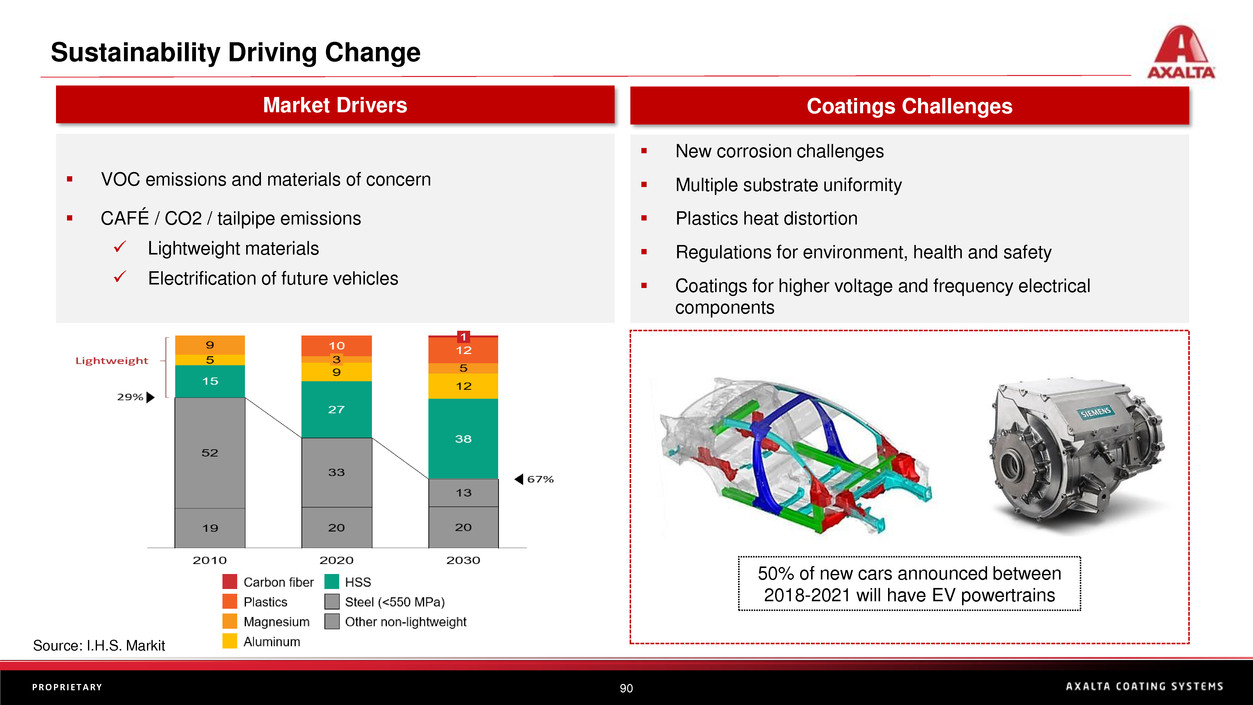
▪ VOC emissions and materials of concern
▪ CAFÉ / CO2 / tailpipe emissions
✓ Lightweight materials
✓ Electrification of future vehicles
Coatings Challenges
50% of new cars announced between
2018-2021 will have EV powertrains
Sustainability Driving Change
91P R O P R I E T A R Y
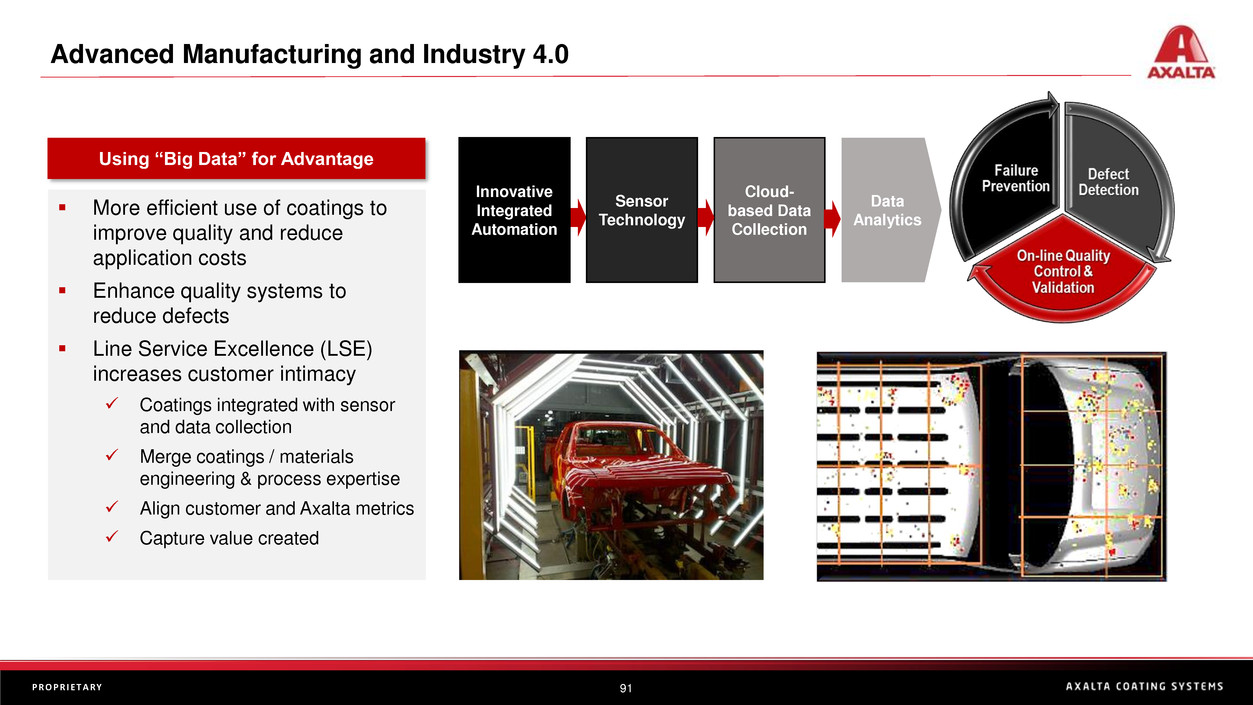
Data
Analytics
Innovative
Integrated
Automation
Sensor
Technology
Cloud-
based Data
Collection
Advanced Manufacturing and Industry 4.0
Using “Big Data” for Advantage
▪ More efficient use of coatings to
improve quality and reduce
application costs
▪ Enhance quality systems to
reduce defects
▪ Line Service Excellence (LSE)
increases customer intimacy
✓ Coatings integrated with sensor
and data collection
✓ Merge coatings / materials
engineering & process expertise
✓ Align customer and Axalta metrics
✓ Capture value created
92P R O P R I E T A R Y
Autonomous Driving Ride Sharing
Future Mobility | Pushing Autonomy and Shared Mobility
2018
Color of the Year
StarLite
▪ Higher utilization, shorter vehicle life
▪ Fleet owners and private owners
▪ Frequent cleaning and replace / refresh options
▪ Service providers differentiate via color and branding
▪ Interior focus – clean, safe, comfortable environment
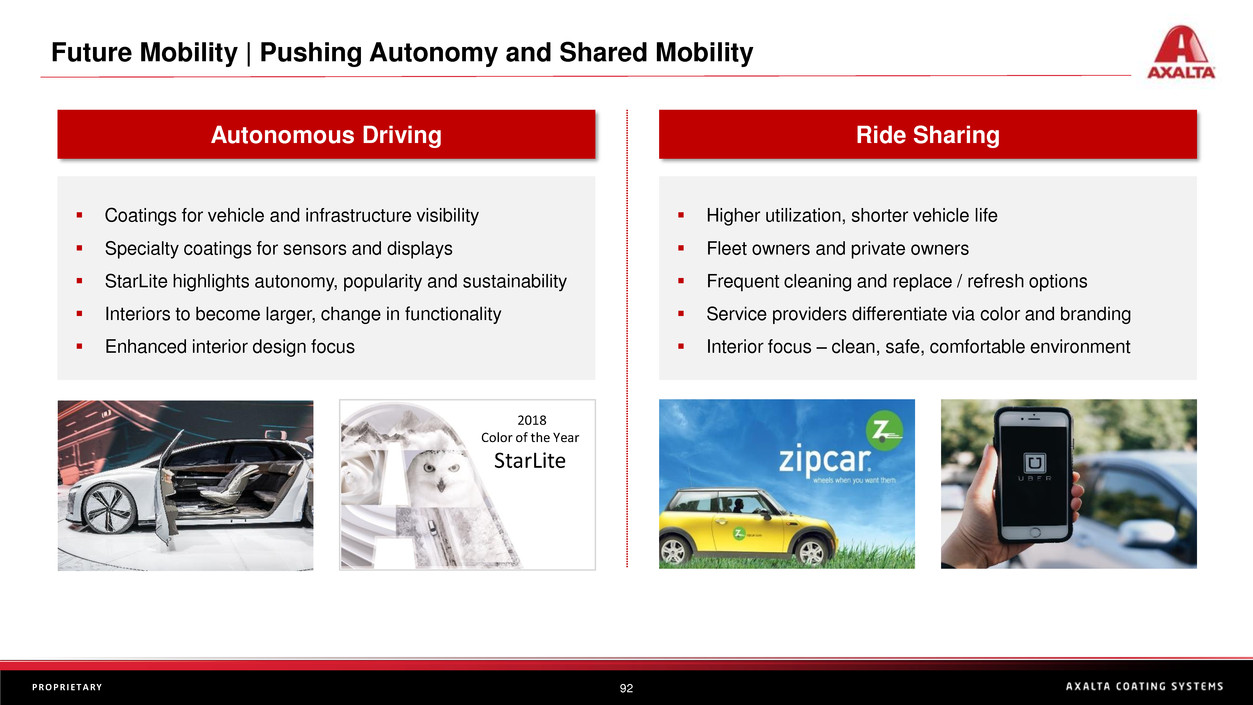
▪ Coatings for vehicle and infrastructure visibility
▪ Specialty coatings for sensors and displays
▪ StarLite highlights autonomy, popularity and sustainability
▪ Interiors to become larger, change in functionality
▪ Enhanced interior design focus
93P R O P R I E T A R Y
Summary
93
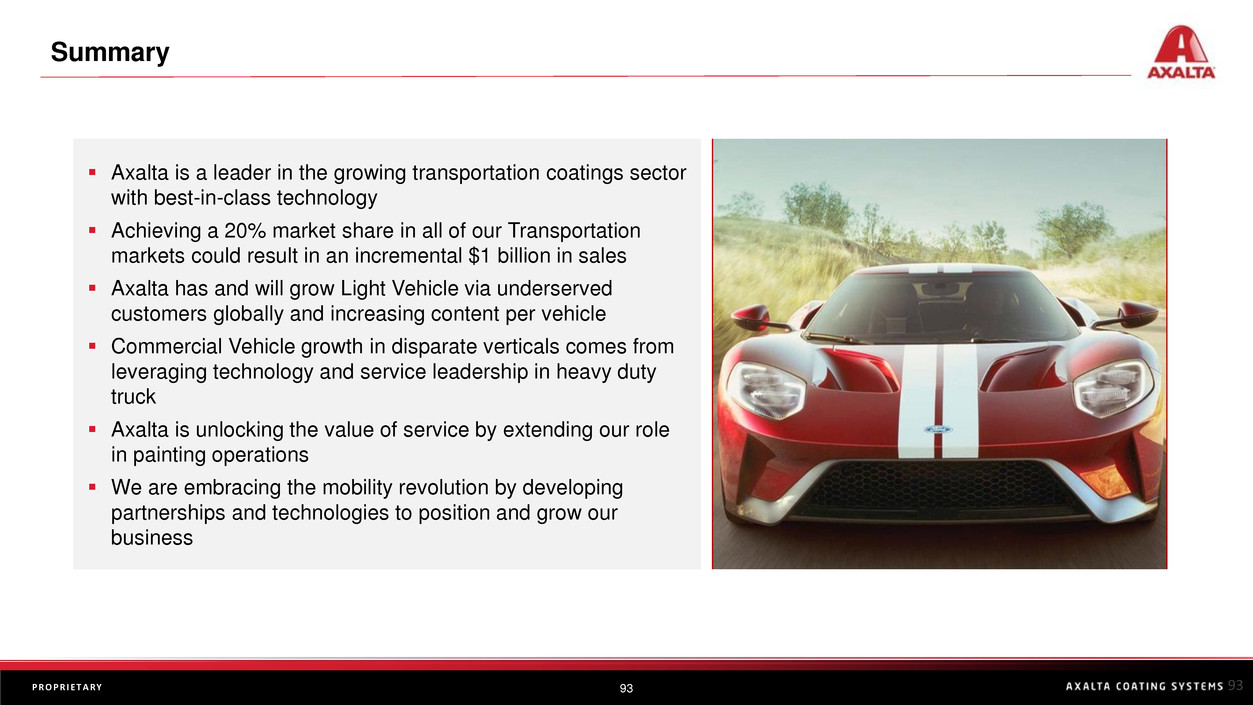
▪ Axalta is a leader in the growing transportation coatings sector
with best-in-class technology
▪ Achieving a 20% market share in all of our Transportation
markets could result in an incremental $1 billion in sales
▪ Axalta has and will grow Light Vehicle via underserved
customers globally and increasing content per vehicle
▪ Commercial Vehicle growth in disparate verticals comes from
leveraging technology and service leadership in heavy duty
truck
▪ Axalta is unlocking the value of service by extending our role
in painting operations
▪ We are embracing the mobility revolution by developing
partnerships and technologies to position and grow our
business
Thank you!
Operations, Procurement & Supply Chain
Dan Key
SVP, Operations, Procurement & Supply Chain
96P R O P R I E T A R Y
Kuala Lumpur
Savli
Jiading
Changchun
Gebze
Bulle
Guntramsdorf
Landshut
Wuppertal
Västervik
Darlington
Mechelen
Montbrison
Guarulhos
TlalnepantlaOcoyoacac
Monterrey
Ft. Madison
Hilliard
Front Royal
Ajax
Mt. Clemens
Riverside
Buenos Aires
Amatitlan
Port Elizabeth
Chengdu
Huangshan
Shangdong
Qingpu
Dongguan
Cikarang
Orrville
Taipei
Bangplee
Moscow
Shah Alam
Cartagena de Indias
Houston
Cornwall
High Point
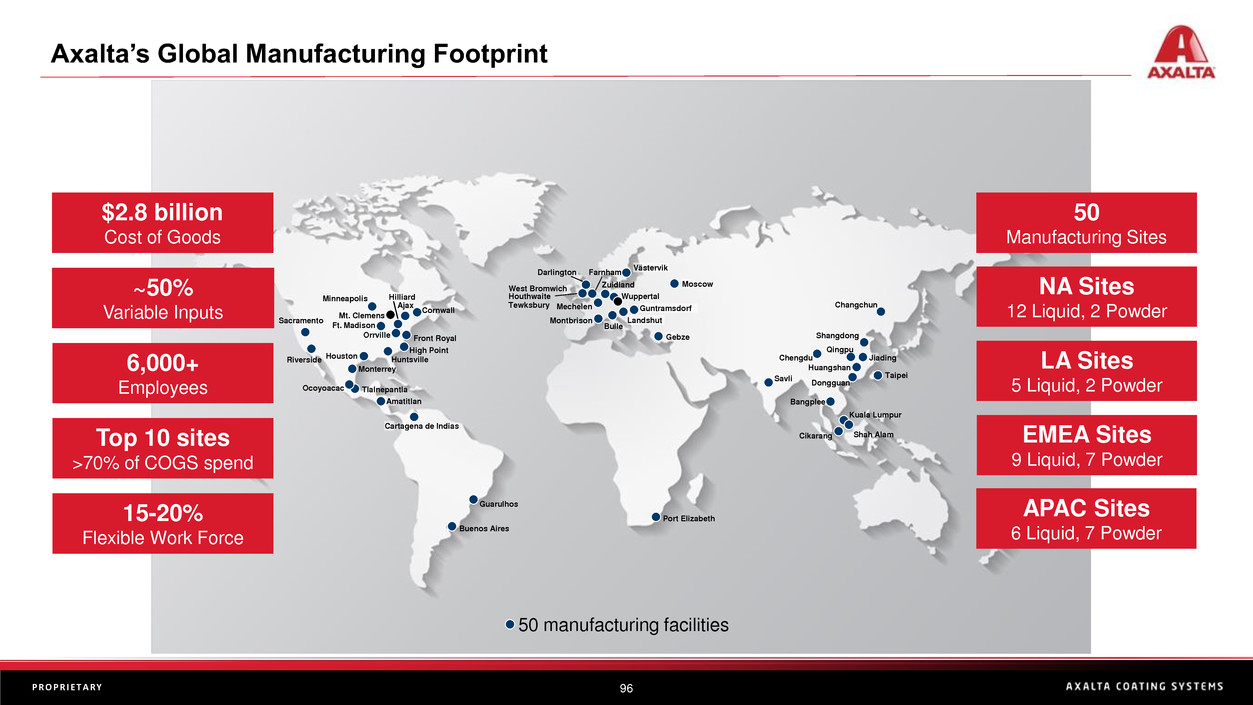
Axalta’s Global Manufacturing Footprint
96
50 manufacturing facilities
6,000+
Employees
50
Manufacturing Sites
Top 10 sites
>70% of COGS spend
LA Sites
5 Liquid, 2 Powder
NA Sites
12 Liquid, 2 Powder
$2.8 billion
Cost of Goods
~50%
Variable Inputs
EMEA Sites
9 Liquid, 7 Powder
APAC Sites
6 Liquid, 7 Powder
15-20%
Flexible Work Force
Houthwaite
West Bromwich
Tewksbury
Zuidland
Farnham
Huntsville
Sacramento
Minneapolis
97P R O P R I E T A R Y
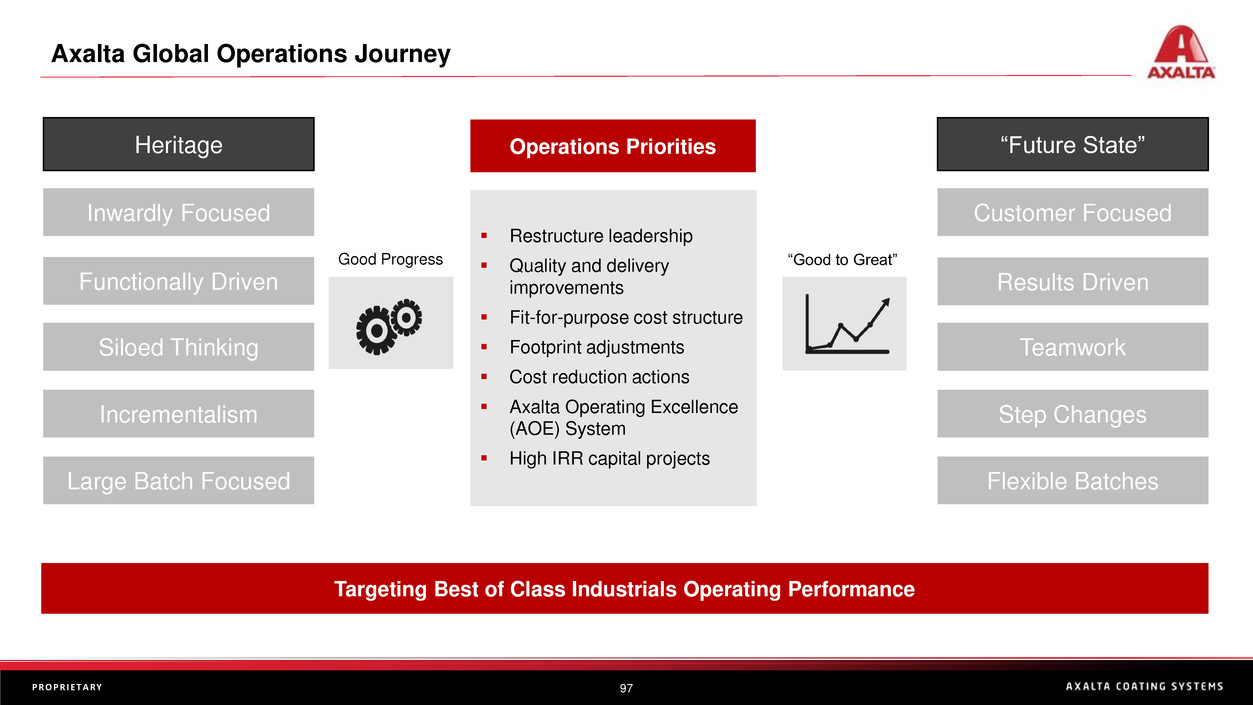
Axalta Global Operations Journey
Heritage “Future State”
Inwardly Focused Customer Focused
Functionally Driven Results Driven
Siloed Thinking Teamwork
Incrementalism Step Changes
Large Batch Focused Flexible Batches
Operations Priorities
▪ Restructure leadership
▪ Quality and delivery
improvements
▪ Fit-for-purpose cost structure
▪ Footprint adjustments
▪ Cost reduction actions
▪ Axalta Operating Excellence
(AOE) System
▪ High IRR capital projects
“Good to Great”Good Progress
Targeting Best of Class Industrials Operating Performance
98P R O P R I E T A R Y
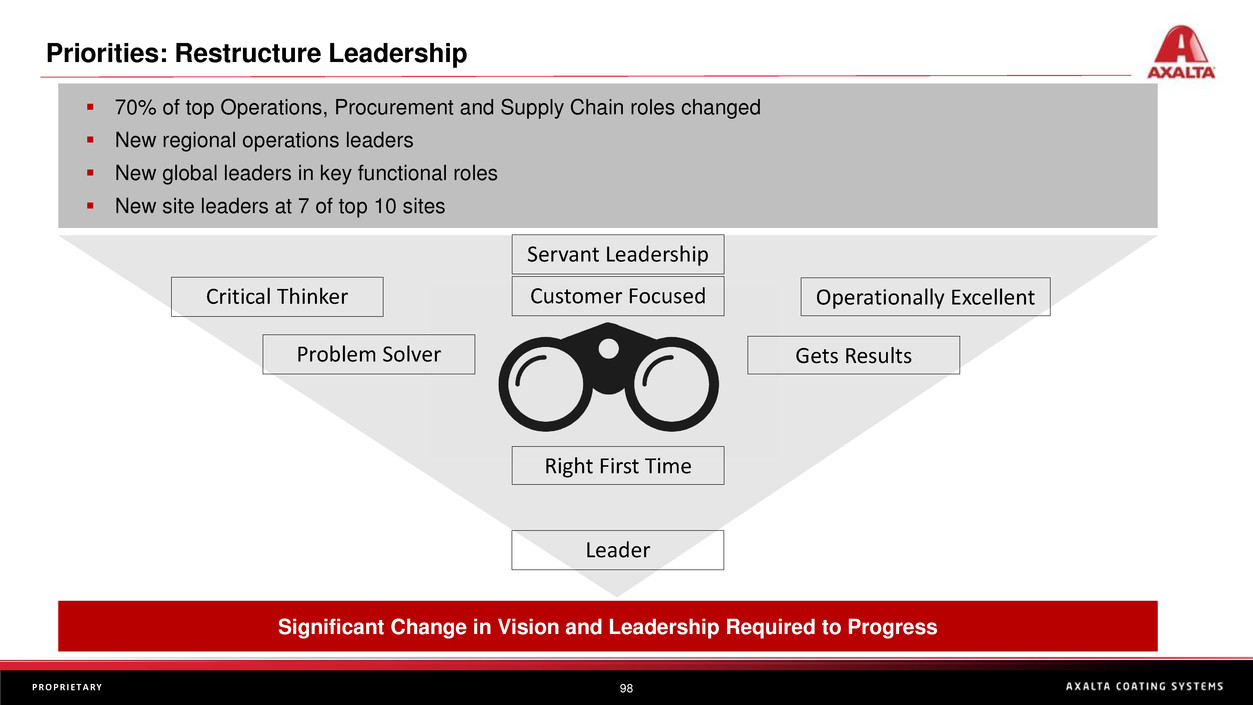
Priorities: Restructure Leadership
▪ 70% of top Operations, Procurement and Supply Chain roles changed
▪ New regional operations leaders
▪ New global leaders in key functional roles
▪ New site leaders at 7 of top 10 sites
Significant Change in Vision and Leadership Required to Progress
Servant Leadership
Customer Focused Operationally Excellent
Leader
Problem Solver Gets Results
Critical Thinker
Right First Time
99P R O P R I E T A R Y
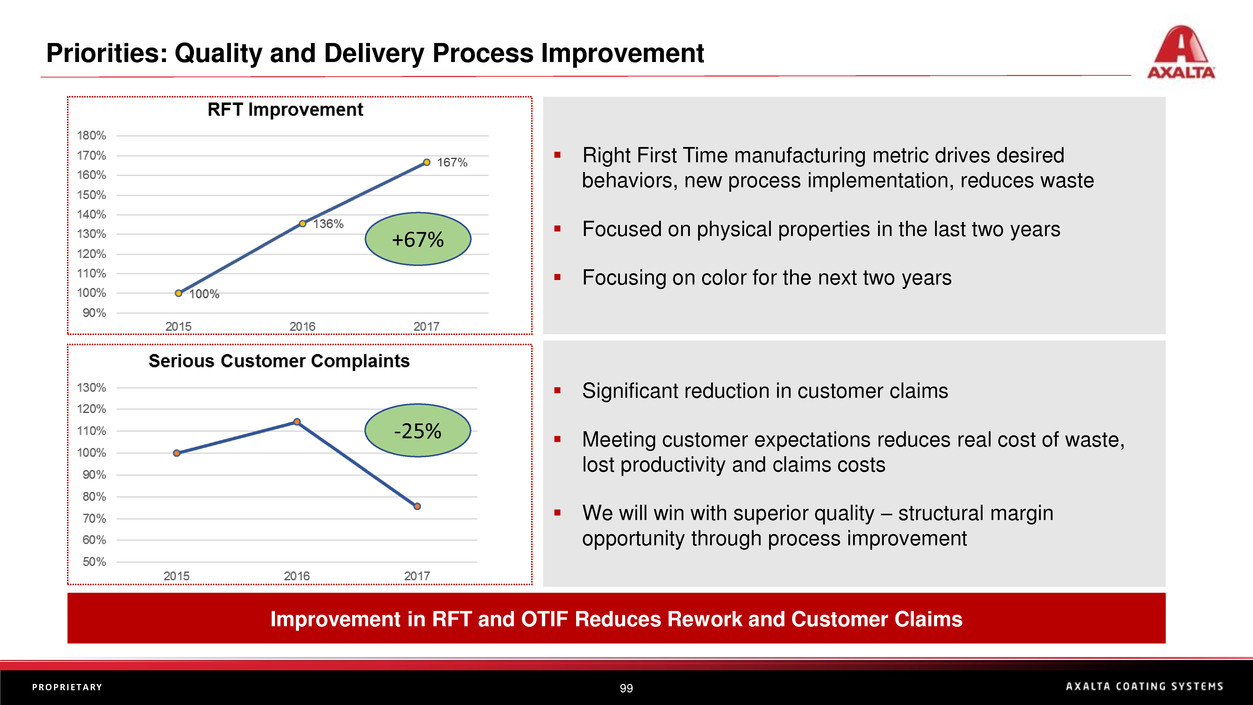
Priorities: Quality and Delivery Process Improvement
Improvement in RFT and OTIF Reduces Rework and Customer Claims
▪ Right First Time manufacturing metric drives desired
behaviors, new process implementation, reduces waste
▪ Focused on physical properties in the last two years
▪ Focusing on color for the next two years
▪ Significant reduction in customer claims
▪ Meeting customer expectations reduces real cost of waste,
lost productivity and claims costs
▪ We will win with superior quality – structural margin
opportunity through process improvement
+67%
-25%
100P R O P R I E T A R Y
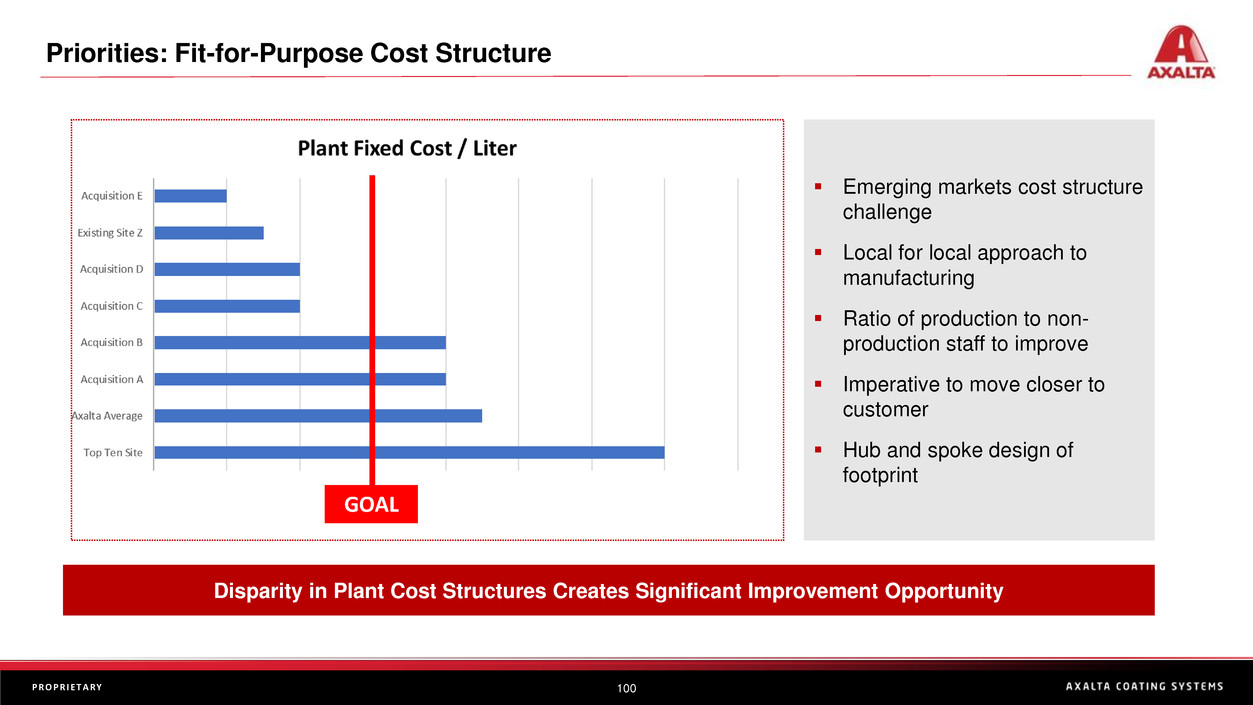
Priorities: Fit-for-Purpose Cost Structure
Disparity in Plant Cost Structures Creates Significant Improvement Opportunity
▪ Emerging markets cost structure
challenge
▪ Local for local approach to
manufacturing
▪ Ratio of production to non-
production staff to improve
▪ Imperative to move closer to
customer
▪ Hub and spoke design of
footprint
GOAL
101P R O P R I E T A R Y
Priorities: Footprint Adjustments
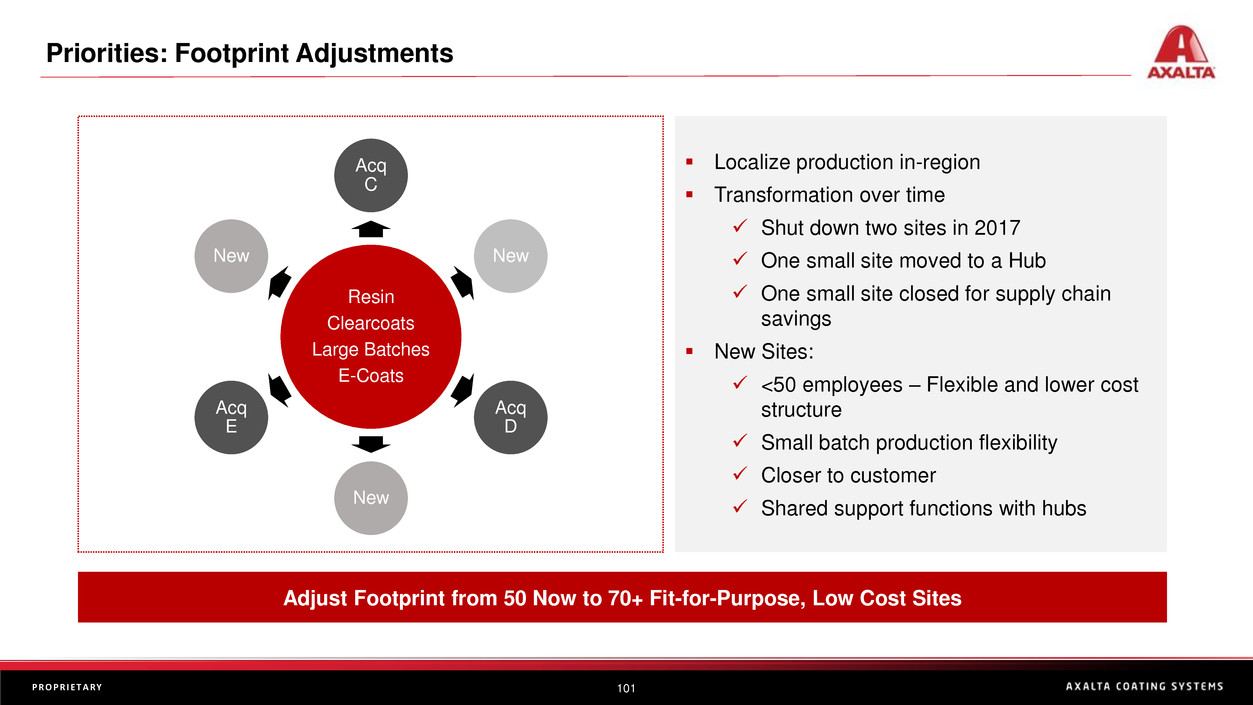
Adjust Footprint from 50 Now to 70+ Fit-for-Purpose, Low Cost Sites
▪ Localize production in-region
▪ Transformation over time
✓ Shut down two sites in 2017
✓ One small site moved to a Hub
✓ One small site closed for supply chain
savings
▪ New Sites:
✓ <50 employees – Flexible and lower cost
structure
✓ Small batch production flexibility
✓ Closer to customer
✓ Shared support functions with hubs
Resin
Clearcoats
Large Batches
E-Coats
Acq
C
New
Acq
D
New
Acq
E
New
102P R O P R I E T A R Y
Priorities: Cost Reduction Actions
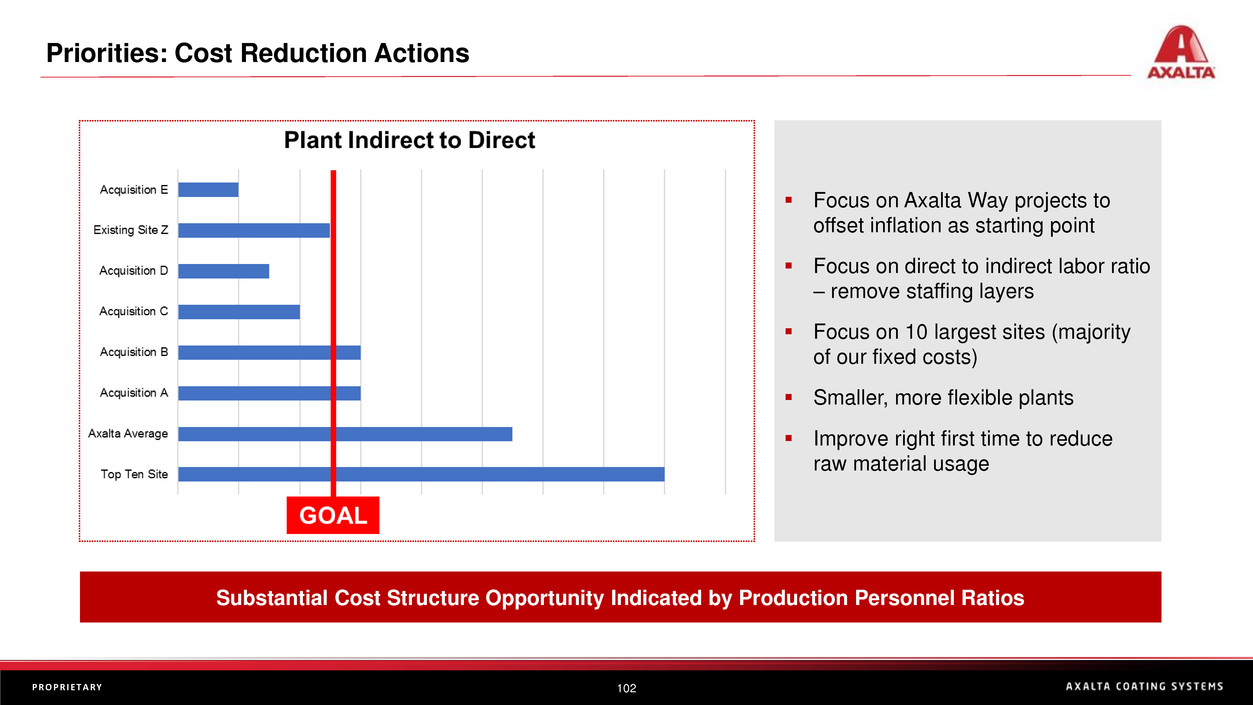
Substantial Cost Structure Opportunity Indicated by Production Personnel Ratios
▪ Focus on Axalta Way projects to
offset inflation as starting point
▪ Focus on direct to indirect labor ratio
– remove staffing layers
▪ Focus on 10 largest sites (majority
of our fixed costs)
▪ Smaller, more flexible plants
▪ Improve right first time to reduce
raw material usage
103P R O P R I E T A R Y
Priorities: Axalta Operating Excellence (AOE)
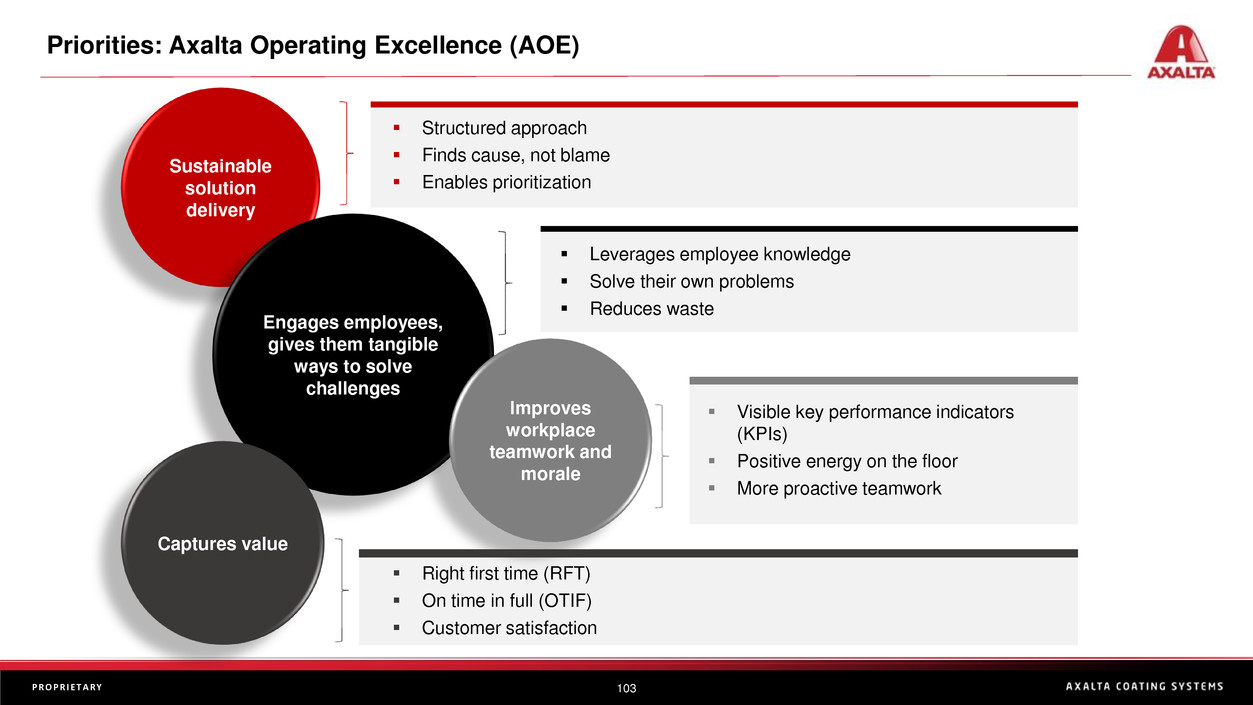
▪ Structured approach
▪ Finds cause, not blame
▪ Enables prioritization
Sustainable
solution
delivery
▪ Leverages employee knowledge
▪ Solve their own problems
▪ Reduces waste
Engages employees,
gives them tangible
ways to solve
challenges
Improves
workplace
teamwork and
morale
▪ Visible key performance indicators
(KPIs)
▪ Positive energy on the floor
▪ More proactive teamwork
Captures value
▪ Right first time (RFT)
▪ On time in full (OTIF)
▪ Customer satisfaction
104P R O P R I E T A R Y
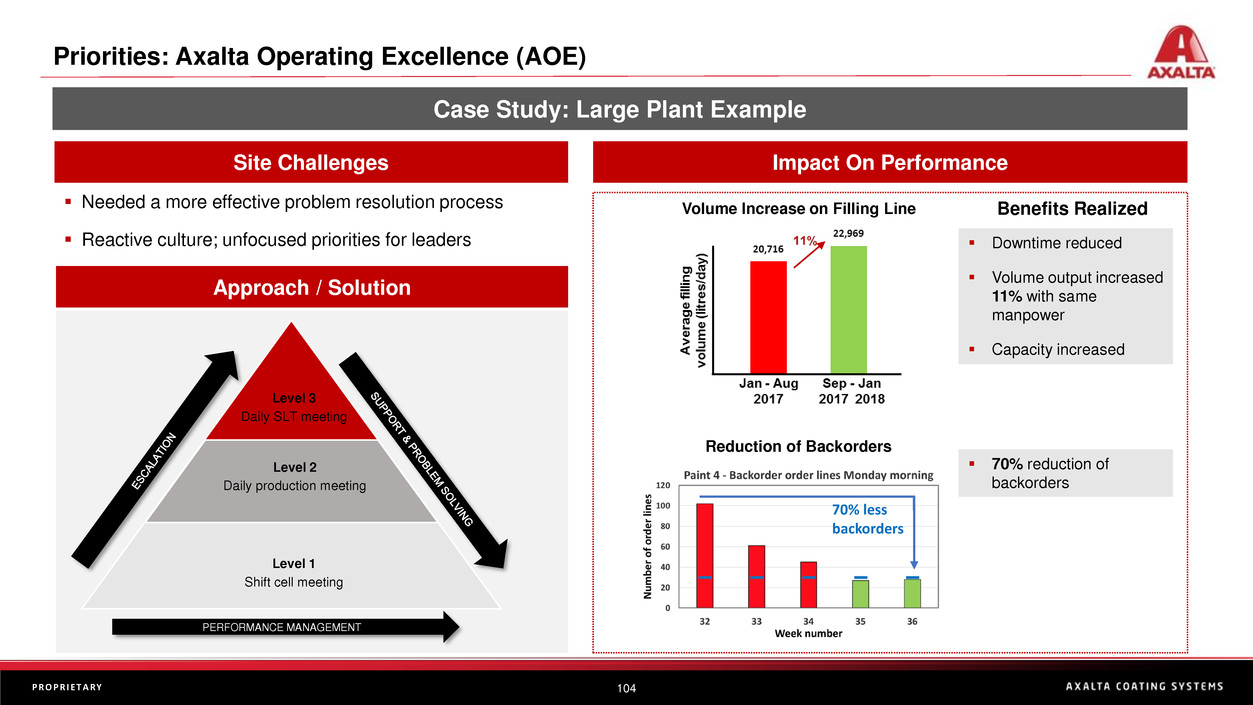
Site Challenges
Priorities: Axalta Operating Excellence (AOE)
Volume Increase on Filling Line▪ Needed a more effective problem resolution process
▪ Reactive culture; unfocused priorities for leaders ▪ Downtime reduced
▪ Volume output increased
11% with same
manpower
▪ Capacity increased
Benefits Realized
Case Study: Large Plant Example
70% less
backorders
Reduction of Backorders
Level 1
Shift cell meeting
Level 2
Daily production meeting
Level 3
Daily SLT meeting
PERFORMANCE MANAGEMENT
▪ 70% reduction of
backorders
Approach / Solution
Impact On Performance
105P R O P R I E T A R Y
Site Challenges
Priorities: Axalta Operating Excellence (AOE)
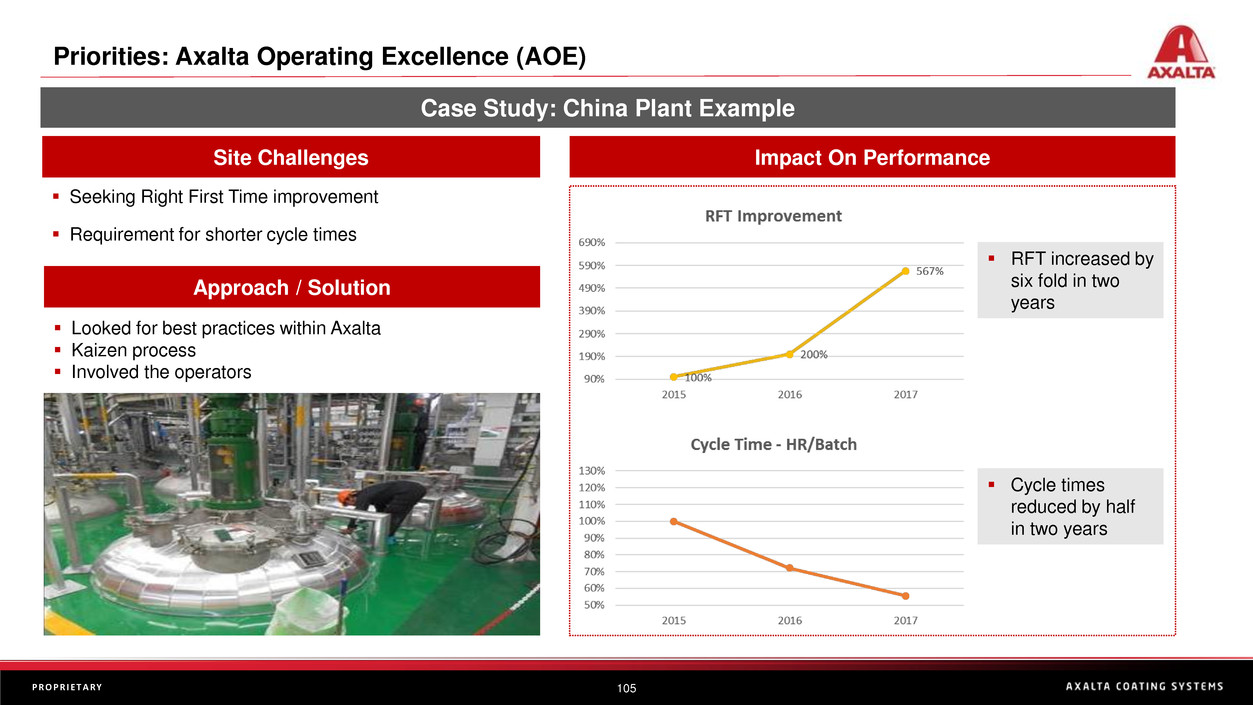
▪ Seeking Right First Time improvement
▪ Requirement for shorter cycle times
▪ RFT increased by
six fold in two
years
Case Study: China Plant Example
Approach / Solution
Impact On Performance
▪ Looked for best practices within Axalta
▪ Kaizen process
▪ Involved the operators
▪ Cycle times
reduced by half
in two years
106P R O P R I E T A R Y
Priorities: High Internal Rate of Return Capital Projects
Approving High IRR Capital Projects to Reduce Complexity and Improve Productivity
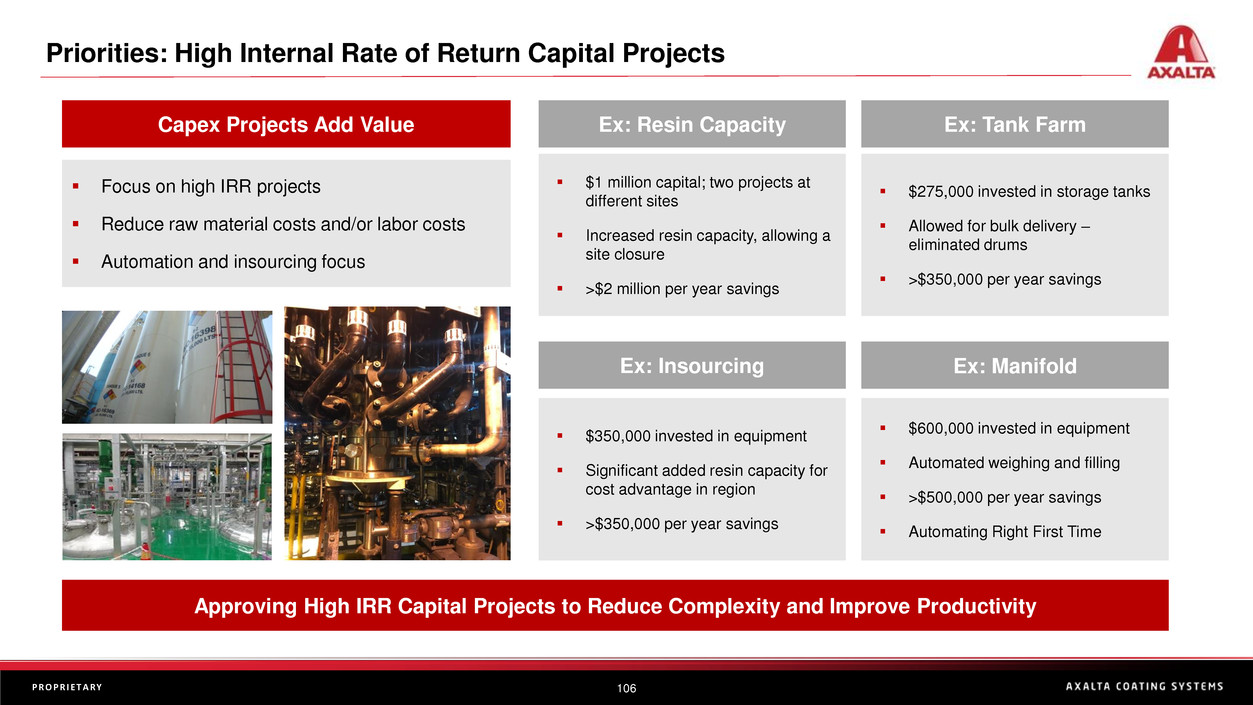
▪ Focus on high IRR projects
▪ Reduce raw material costs and/or labor costs
▪ Automation and insourcing focus
Capex Projects Add Value Ex: Resin Capacity Ex: Tank Farm
Ex: Insourcing
▪ $1 million capital; two projects at
different sites
▪ Increased resin capacity, allowing a
site closure
▪ >$2 million per year savings
▪ $275,000 invested in storage tanks
▪ Allowed for bulk delivery –
eliminated drums
▪ >$350,000 per year savings
▪ $350,000 invested in equipment
▪ Significant added resin capacity for
cost advantage in region
▪ >$350,000 per year savings
Ex: Manifold
▪ $600,000 invested in equipment
▪ Automated weighing and filling
▪ >$500,000 per year savings
▪ Automating Right First Time
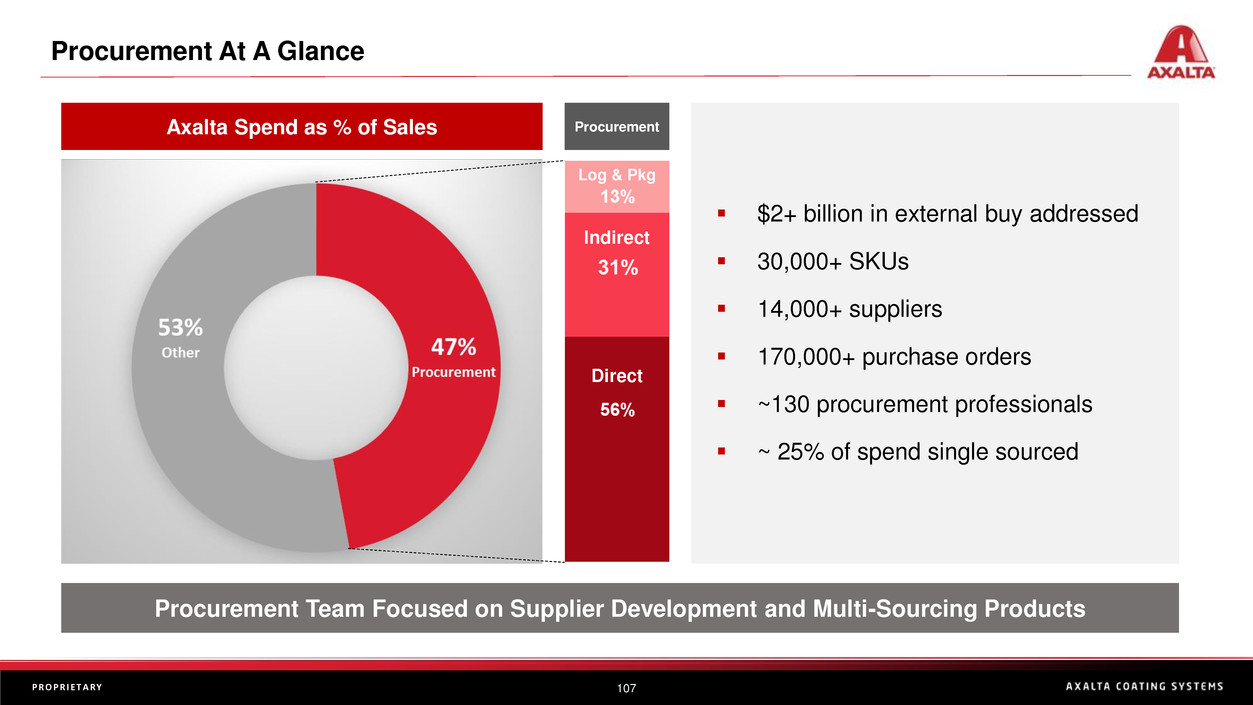
107P R O P R I E T A R Y
Procurement At A Glance
Procurement Team Focused on Supplier Development and Multi-Sourcing Products
Logistics & Packaging
13%
Indirect 24%
Direct Materials
63%
Axalta Spend as % of Sales
▪ $2+ billion in external buy addressed
▪ 30,000+ SKUs
▪ 14,000+ suppliers
▪ 170,000+ purchase orders
▪ ~130 procurement professionals
▪ ~ 25% of spend single sourced
Direct
Log & Pkg
Indirect
Procurement
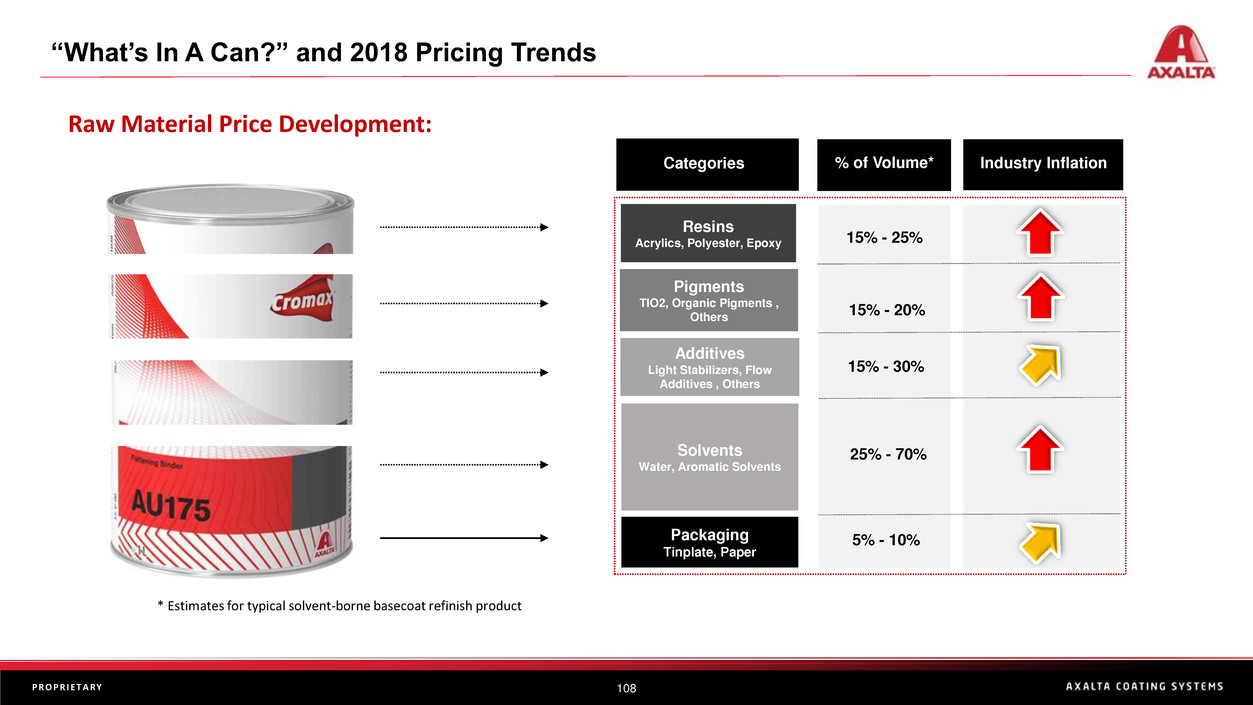
108P R O P R I E T A R Y
“What’s In A Can?” and 2018 Pricing Trends
High S.D.
% of Volume*Categories Industry Inflation
Packaging
Tinplate, Paper
15% - 25%
Resins
Acrylics, Polyester, Epoxy
15% - 20%
Pigments
TIO2, Organic Pigments ,
Others
15% - 30%
Additives
Light Stabilizers, Flow
Additives , Others
25% - 70%Solvents
Water, Aromatic Solvents
* Estimates for typical solvent-borne basecoat refinish product
Raw Material Price Development:
5% - 10%
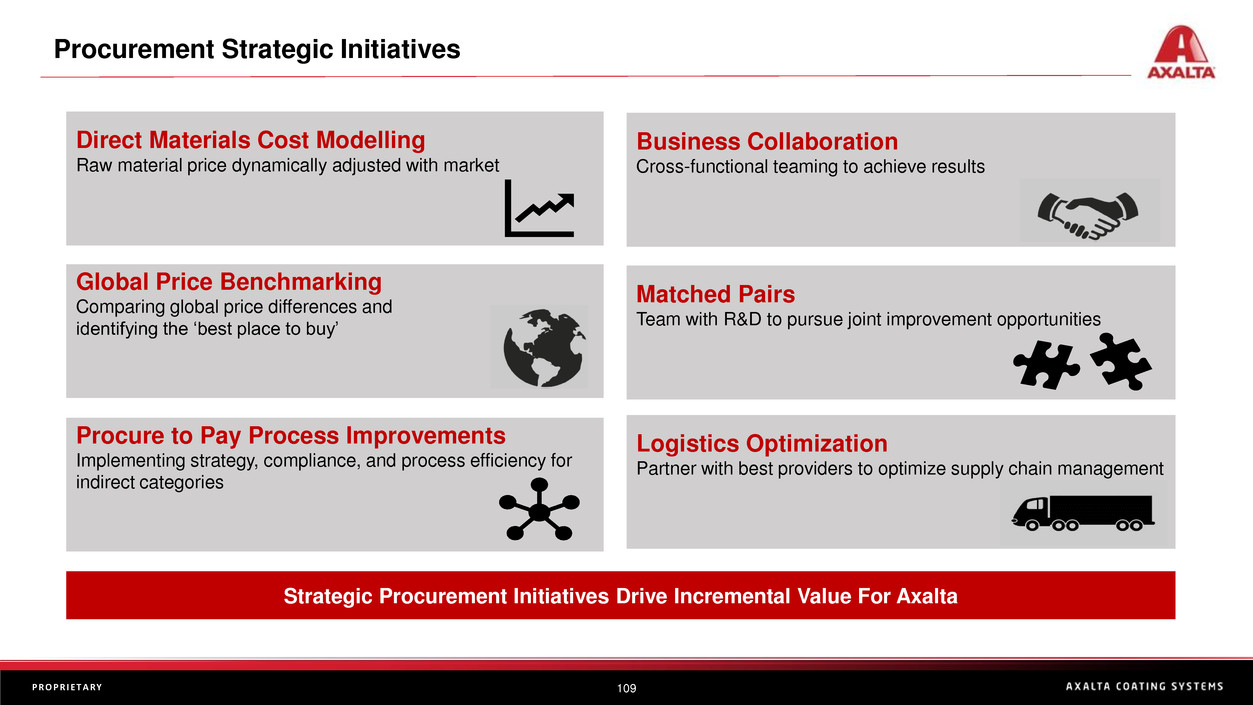
109P R O P R I E T A R Y
Procurement Strategic Initiatives
Strategic Procurement Initiatives Drive Incremental Value For Axalta
Direct Materials Cost Modelling
Raw material price dynamically adjusted with market
Global Price Benchmarking
Comparing global price differences and
identifying the ‘best place to buy’
Procure to Pay Process Improvements
Implementing strategy, compliance, and process efficiency for
indirect categories
Business Collaboration
Cross-functional teaming to achieve results
Matched Pairs
Team with R&D to pursue joint improvement opportunities
Logistics Optimization
Partner with best providers to optimize supply chain management
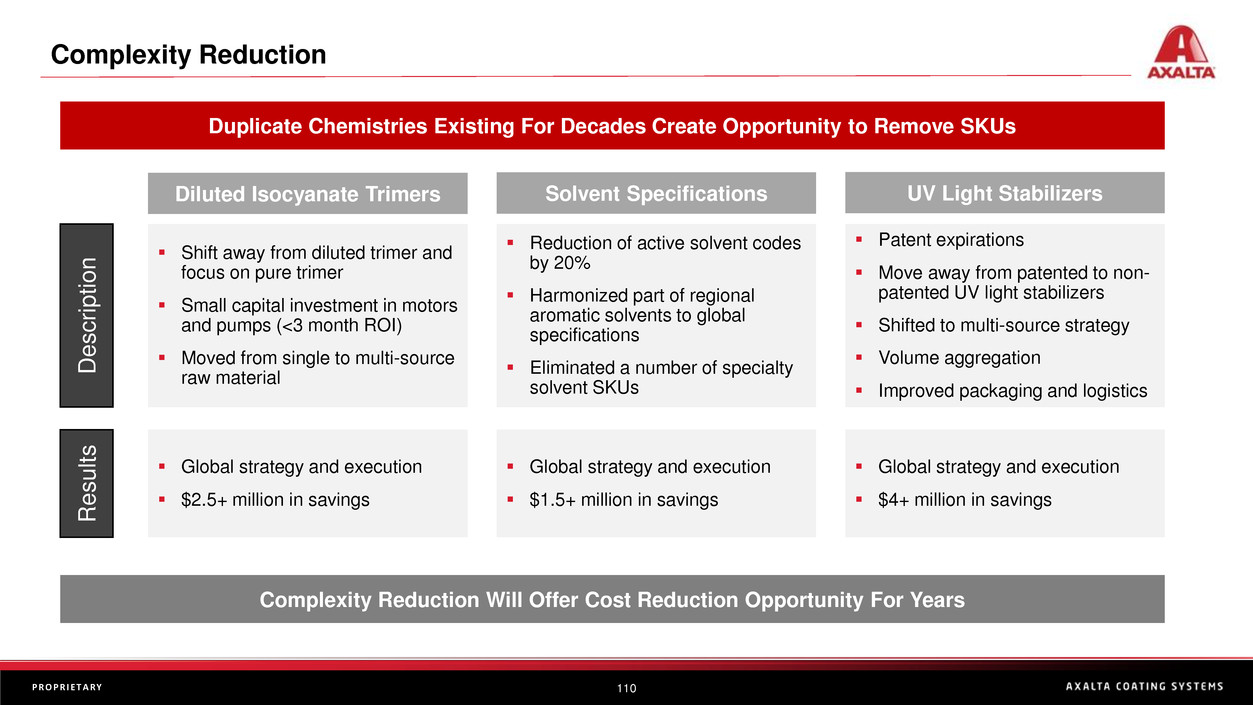
110P R O P R I E T A R Y
Complexity Reduction
Diluted Isocyanate Trimers
▪ Shift away from diluted trimer and
focus on pure trimer
▪ Small capital investment in motors
and pumps (<3 month ROI)
▪ Moved from single to multi-source
raw material
Solvent Specifications
▪ Reduction of active solvent codes
by 20%
▪ Harmonized part of regional
aromatic solvents to global
specifications
▪ Eliminated a number of specialty
solvent SKUs
UV Light Stabilizers
▪ Patent expirations
▪ Move away from patented to non-
patented UV light stabilizers
▪ Shifted to multi-source strategy
▪ Volume aggregation
▪ Improved packaging and logistics
▪ Global strategy and execution
▪ $2.5+ million in savings
▪ Global strategy and execution
▪ $1.5+ million in savings
▪ Global strategy and execution
▪ $4+ million in savings
D
e
scri
p
tio
n
R
e
su
lt
s
Complexity Reduction Will Offer Cost Reduction Opportunity For Years
Duplicate Chemistries Existing For Decades Create Opportunity to Remove SKUs
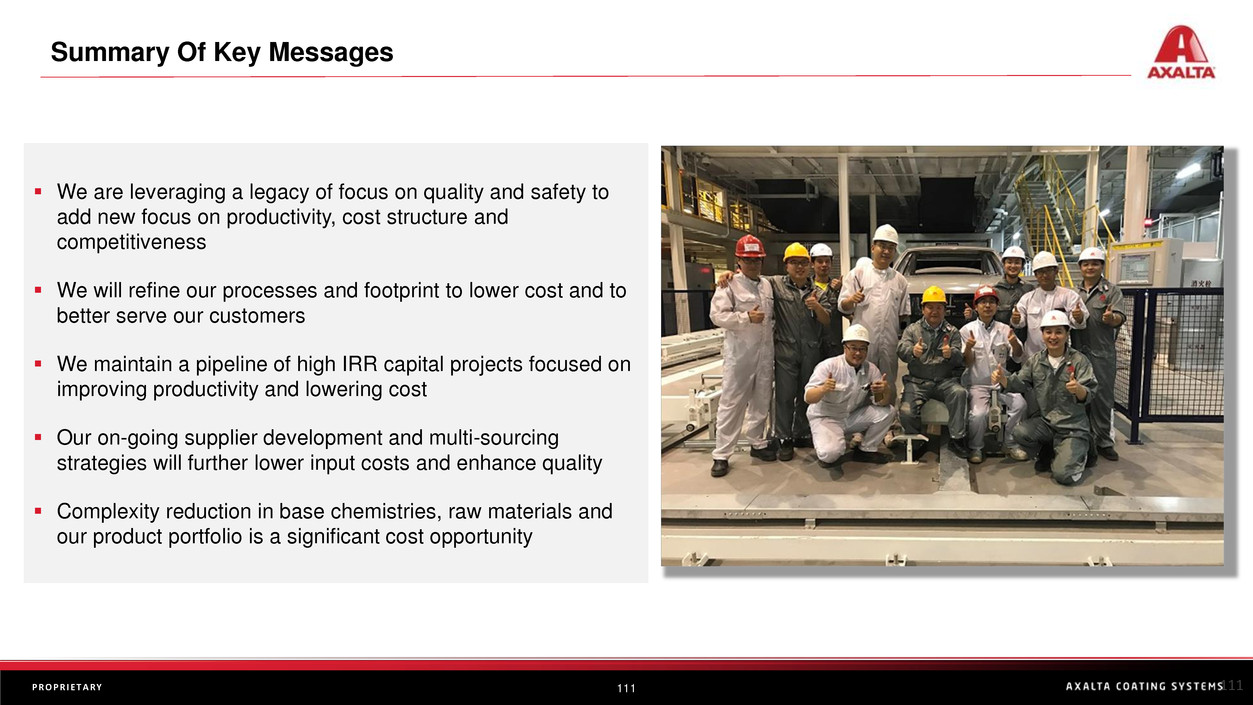
111P R O P R I E T A R Y
Summary Of Key Messages
111
▪ We are leveraging a legacy of focus on quality and safety to
add new focus on productivity, cost structure and
competitiveness
▪ We will refine our processes and footprint to lower cost and to
better serve our customers
▪ We maintain a pipeline of high IRR capital projects focused on
improving productivity and lowering cost
▪ Our on-going supplier development and multi-sourcing
strategies will further lower input costs and enhance quality
▪ Complexity reduction in base chemistries, raw materials and
our product portfolio is a significant cost opportunity
Thank You!
Appendix
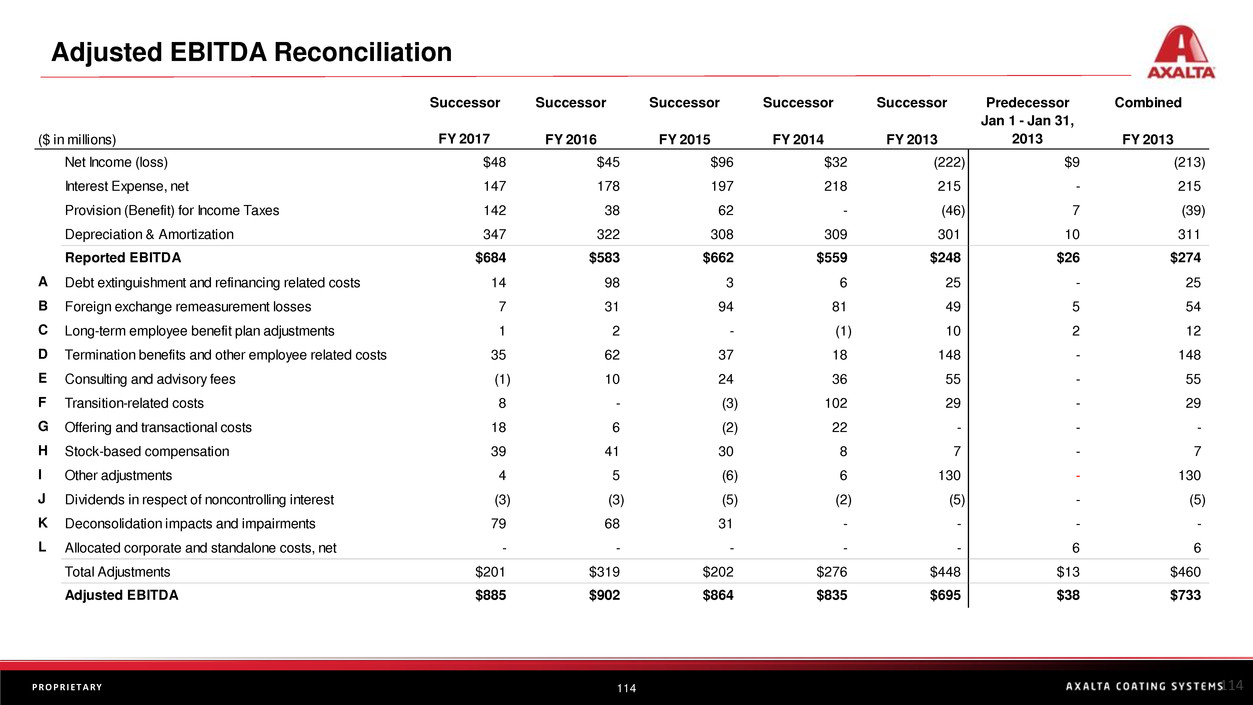
114P R O P R I E T A R Y
Adjusted EBITDA Reconciliation
114
Successor Successor Successor Successor Successor Predecessor Combined
($ in millions) FY 2017 FY 2016 FY 2015 FY 2014 FY 2013
Jan 1 - Jan 31,
2013 FY 2013
Net Income (loss) $48 $45 $96 $32 (222) $9 (213)
Interest Expense, net 147 178 197 218 215 - 215
Provision (Benefit) for Income Taxes 142 38 62 - (46) 7 (39)
Depreciation & Amortization 347 322 308 309 301 10 311
Reported EBITDA $684 $583 $662 $559 $248 $26 $274
A Debt extinguishment and refinancing related costs 14 98 3 6 25 - 25
B Foreign exchange remeasurement losses 7 31 94 81 49 5 54
C Long-term employee benefit plan adjustments 1 2 - (1) 10 2 12
D Termination benefits and other employee related costs 35 62 37 18 148 - 148
E Consulting and advisory fees (1) 10 24 36 55 - 55
F Transition-related costs 8 - (3) 102 29 - 29
G Offering and transactional costs 18 6 (2) 22 - - -
H Stock-based compensation 39 41 30 8 7 - 7
I Other adjustments 4 5 (6) 6 130 - 130
J Dividends in respect of noncontrolling interest (3) (3) (5) (2) (5) - (5)
K Deconsolidation impacts and impairments 79 68 31 - - - -
L Allocated corporate and standalone costs, net - - - - - 6 6
Total Adjustments $201 $319 $202 $276 $448 $13 $460
Adjusted EBITDA $885 $902 $864 $835 $695 $38 $733
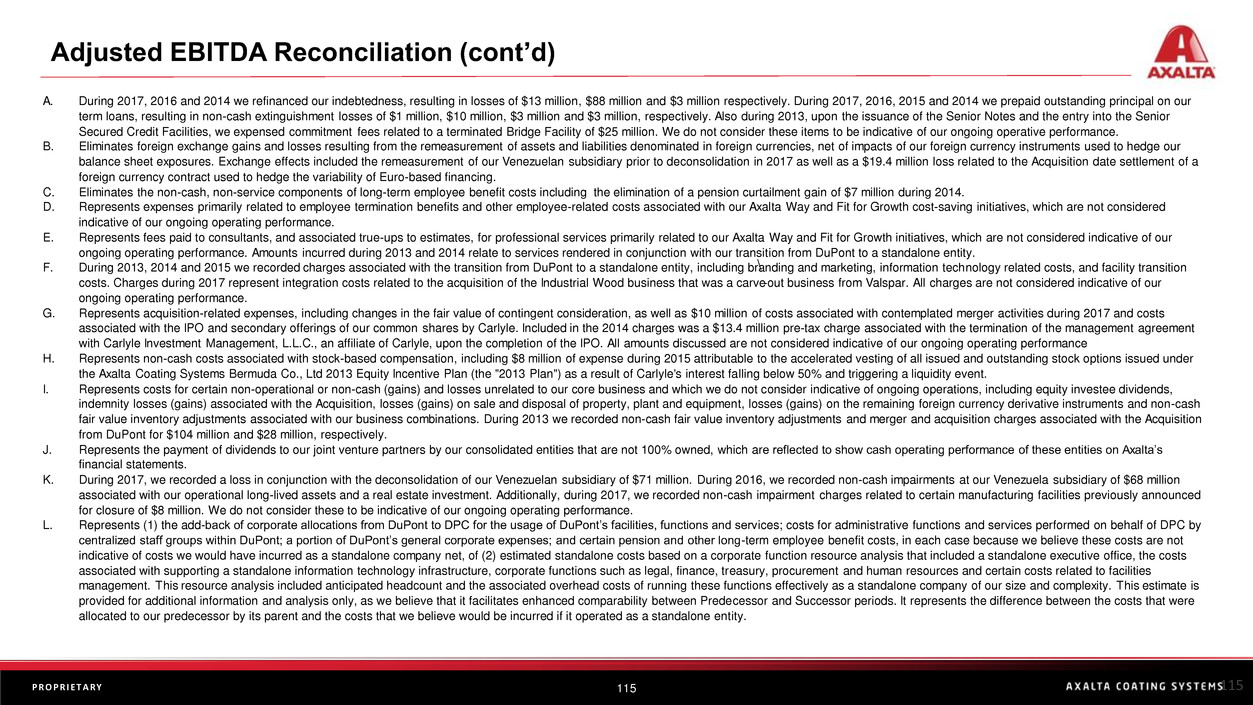
115P R O P R I E T A R Y
Adjusted EBITDA Reconciliation (cont’d)
115
\
A. During 2017, 2016 and 2014 we refinanced our indebtedness, resulting in losses of $13 million, $88 million and $3 million respectively. During 2017, 2016, 2015 and 2014 we prepaid outstanding principal on our
term loans, resulting in non-cash extinguishment losses of $1 million, $10 million, $3 million and $3 million, respectively. Also during 2013, upon the issuance of the Senior Notes and the entry into the Senior
Secured Credit Facilities, we expensed commitment fees related to a terminated Bridge Facility of $25 million. We do not consider these items to be indicative of our ongoing operative performance.
B. Eliminates foreign exchange gains and losses resulting from the remeasurement of assets and liabilities denominated in foreign currencies, net of impacts of our foreign currency instruments used to hedge our
balance sheet exposures. Exchange effects included the remeasurement of our Venezuelan subsidiary prior to deconsolidation in 2017 as well as a $19.4 million loss related to the Acquisition date settlement of a
foreign currency contract used to hedge the variability of Euro-based financing.
C. Eliminates the non-cash, non-service components of long-term employee benefit costs including the elimination of a pension curtailment gain of $7 million during 2014.
D. Represents expenses primarily related to employee termination benefits and other employee-related costs associated with our Axalta Way and Fit for Growth cost-saving initiatives, which are not considered
indicative of our ongoing operating performance.
E. Represents fees paid to consultants, and associated true-ups to estimates, for professional services primarily related to our Axalta Way and Fit for Growth initiatives, which are not considered indicative of our
ongoing operating performance. Amounts incurred during 2013 and 2014 relate to services rendered in conjunction with our transition from DuPont to a standalone entity.
F. During 2013, 2014 and 2015 we recorded charges associated with the transition from DuPont to a standalone entity, including branding and marketing, information technology related costs, and facility transition
costs. Charges during 2017 represent integration costs related to the acquisition of the Industrial Wood business that was a carve-out business from Valspar. All charges are not considered indicative of our
ongoing operating performance.
G. Represents acquisition-related expenses, including changes in the fair value of contingent consideration, as well as $10 million of costs associated with contemplated merger activities during 2017 and costs
associated with the IPO and secondary offerings of our common shares by Carlyle. Included in the 2014 charges was a $13.4 million pre-tax charge associated with the termination of the management agreement
with Carlyle Investment Management, L.L.C., an affiliate of Carlyle, upon the completion of the IPO. All amounts discussed are not considered indicative of our ongoing operating performance
H. Represents non-cash costs associated with stock-based compensation, including $8 million of expense during 2015 attributable to the accelerated vesting of all issued and outstanding stock options issued under
the Axalta Coating Systems Bermuda Co., Ltd 2013 Equity Incentive Plan (the "2013 Plan") as a result of Carlyle's interest falling below 50% and triggering a liquidity event.
I. Represents costs for certain non-operational or non-cash (gains) and losses unrelated to our core business and which we do not consider indicative of ongoing operations, including equity investee dividends,
indemnity losses (gains) associated with the Acquisition, losses (gains) on sale and disposal of property, plant and equipment, losses (gains) on the remaining foreign currency derivative instruments and non-cash
fair value inventory adjustments associated with our business combinations. During 2013 we recorded non-cash fair value inventory adjustments and merger and acquisition charges associated with the Acquisition
from DuPont for $104 million and $28 million, respectively.
J. Represents the payment of dividends to our joint venture partners by our consolidated entities that are not 100% owned, which are reflected to show cash operating performance of these entities on Axalta’s
financial statements.
K. During 2017, we recorded a loss in conjunction with the deconsolidation of our Venezuelan subsidiary of $71 million. During 2016, we recorded non-cash impairments at our Venezuela subsidiary of $68 million
associated with our operational long-lived assets and a real estate investment. Additionally, during 2017, we recorded non-cash impairment charges related to certain manufacturing facilities previously announced
for closure of $8 million. We do not consider these to be indicative of our ongoing operating performance.
L. Represents (1) the add-back of corporate allocations from DuPont to DPC for the usage of DuPont’s facilities, functions and services; costs for administrative functions and services performed on behalf of DPC by
centralized staff groups within DuPont; a portion of DuPont’s general corporate expenses; and certain pension and other long-term employee benefit costs, in each case because we believe these costs are not
indicative of costs we would have incurred as a standalone company net, of (2) estimated standalone costs based on a corporate function resource analysis that included a standalone executive office, the costs
associated with supporting a standalone information technology infrastructure, corporate functions such as legal, finance, treasury, procurement and human resources and certain costs related to facilities
management. This resource analysis included anticipated headcount and the associated overhead costs of running these functions effectively as a standalone company of our size and complexity. This estimate is
provided for additional information and analysis only, as we believe that it facilitates enhanced comparability between Predecessor and Successor periods. It represents the difference between the costs that were
allocated to our predecessor by its parent and the costs that we believe would be incurred if it operated as a standalone entity.