EXHIBIT 99.1
Published on August 7, 2019
Exhibit 99.1 Axalta Coating Systems Ltd. Investor Presentation Third Quarter 2019 Sensitivity: Business Internal
Legal Notices Forward-Looking Statements This presentation and the oral remarks made in connection herewith may contain “forward-looking statements” within the meaning of the U.S. Private Securities Litigation Reform Act of 1995, including those relating to our 2019 goals and financial projections, which include net sales, net sales excluding FX, Adjusted EBIT, depreciation and amortization, Adjusted EBITDA, interest expense, tax rate, as adjusted, Adjusted EPS, free cash flow, capital expenditures, diluted shares outstanding, impacts from acquisitions and divestitures, FX impacts, pricing actions, cost savings, product launches, share buybacks, and related assumptions. Any forward-looking statements involve risks, uncertainties and assumptions. These statements often include words such as “believe,” “expect,” “anticipate,” “intend,” “plan,” “estimate,” “target,” “project,” “forecast,” “seek,” “will,” “may,” “should,” “could,” “would,” or similar expressions. These statements are based on certain assumptions that we have made in light of our experience in the industry and our perceptions of historical trends, current conditions, expected future developments and other factors we believe are appropriate under the circumstances as of the date hereof. Although we believe that the assumptions and analysis underlying these statements are reasonable as of the date hereof, investors are cautioned not to place undue reliance on these statements. We do not have any obligation to and do not intend to update any forward-looking statements included herein, which speak only as of the date hereof. You should understand that these statements are not guarantees of future performance or results. Actual results could differ materially from those described in any forward-looking statements contained herein or the oral remarks made in connection herewith as a result of a variety of factors, including known and unknown risks and uncertainties, many of which are beyond our control including, but not limited to, the risks and uncertainties described in "Non-GAAP Financial Measures," and "Forward-Looking Statements" as well as "Risk Factors" in our Annual Report on Form 10-K for the year ended December 31, 2018 and our Quarterly Report on Form 10-Q for the quarters ended March 31, 2019 and June 30, 2019. Non-GAAP Financial Measures The historical financial information included in this presentation includes financial information that is not presented in accordance with generally accepted accounting principles in the United States (“GAAP”), including net sales excluding FX, Adjusted Net Income, Adjusted EPS, EBITDA, Adjusted EBITDA, EBIT, Adjusted EBIT, Free Cash Flow, tax rate, as adjusted, Net Debt, Net Operating Profit After Tax (NOPAT), and Return on Invested Capital (ROIC). Management uses these non-GAAP financial measures in the analysis of our financial and operating performance because they assist in the evaluation of underlying trends in our business. Adjusted EBITDA, Adjusted EBIT and Adjusted EPS consist of EBITDA, EBIT and Diluted EPS, respectively, adjusted for (i) certain non-cash items included within net income, (ii) certain items Axalta does not believe are indicative of ongoing operating performance or (iii) certain nonrecurring, unusual or infrequent items that have not occurred within the last two years or we believe are not reasonably likely to recur within the next two years. We believe that making such adjustments provides investors meaningful information to understand our operating results and ability to analyze financial and business trends on a period-to-period basis. Adjusted net income shows the adjusted value of net income attributable to controlling interests after removing the items that are determined by management to be items that we do not consider indicative of our ongoing operating performance unusual or nonrecurring in nature. Our use of the terms net sales excluding FX, Adjusted Net Income, Adjusted EPS, EBITDA, Adjusted EBITDA, EBIT, Adjusted EBIT, Free Cash Flow, tax rate, as adjusted, Net Debt, NOPAT, and ROIC may differ from that of others in our industry. Net sales excluding FX, Adjusted Net Income, Adjusted EPS, EBITDA, Adjusted EBITDA , EBIT, Adjusted EBIT and Free Cash Flow should not be considered as alternatives to net sales, net income, operating income or any other performance measures derived in accordance with GAAP as measures of operating performance or operating cash flows or as measures of liquidity. Net sales excluding FX, Adjusted Net Income, Adjusted EPS, EBITDA, Adjusted EBITDA, EBIT, Adjusted EBIT, Free Cash Flow, tax rate, as adjusted, Net Debt, NOPAT, and ROIC have important limitations as analytical tools and should be considered in conjunction with, and not as substitutes for, our results as reported under GAAP. This presentation includes a reconciliation of certain non-GAAP financial measures with the most directly comparable financial measures calculated in accordance with GAAP. Axalta does not provide a reconciliation for non-GAAP estimates for net sales excluding FX, Adjusted EPS, Adjusted EBITDA, Adjusted EBIT, Free Cash Flow or tax rate, as adjusted, on a forward-looking basis because the information necessary to calculate a meaningful or accurate estimation of reconciling items is not available without unreasonable effort. For example, such reconciling items include the impact of foreign currency exchange gains or losses, gains or losses that are unusual or nonrecurring in nature, as well as discrete taxable events. We cannot estimate or project those items and they may have a substantial and unpredictable impact on our GAAP results. Constant Currency Constant currency or ex-FX percentages are calculated by excluding the change in average exchange rates between the current and comparable period by currency denomination exposure of the comparable period amount. Segment Financial Measures Our primary measure of segment operating performance, as determined in accordance with GAAP, is Adjusted EBIT, which is a key metric that is used by management to evaluate business performance in comparison to budgets, forecasts and prior year financial results, providing a measure that management believes reflects Axalta’s core operating performance. A reconciliation of this non-GAAP financial measure with the most directly comparable financial measure calculated in accordance with GAAP is not required. Defined Terms All capitalized terms contained within this presentation have been previously defined in our filings with the United States Securities and Exchange Commission. Rounding Due to rounding the tables presented may not foot. PROPRIETARY Sensitivity: Business Internal 2
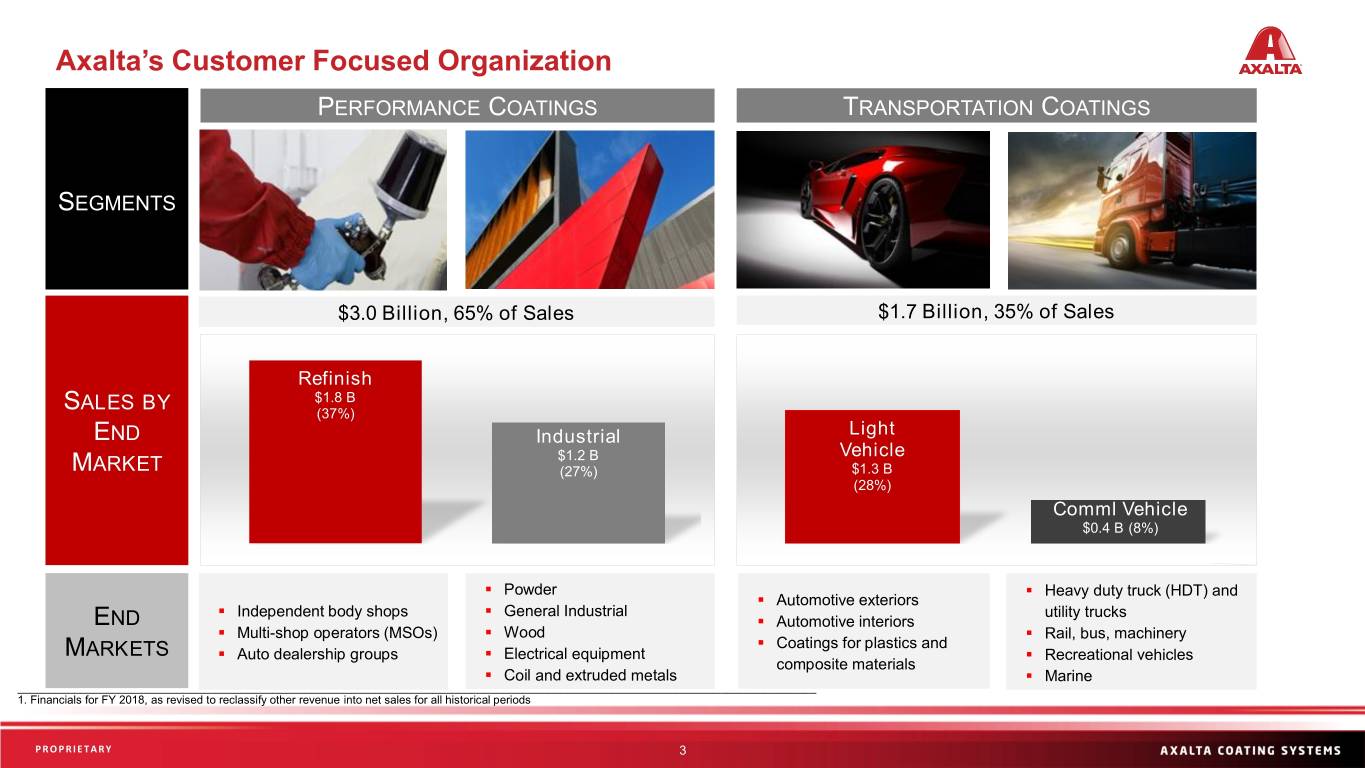
Axalta’s Customer Focused Organization PERFORMANCE COATINGS TRANSPORTATION COATINGS SEGMENTS $3.0 Billion, 65% of Sales $1.7 Billion, 35% of Sales Refinish ALES BY $1.8 B S (37%) END Industrial Light $1.2 B Vehicle MARKET (27%) $1.3 B (28%) Comml Vehicle $0.4 B (8%) ▪ Powder ▪ Heavy duty truck (HDT) and ▪ Automotive exteriors ▪ Independent body shops ▪ General Industrial utility trucks END ▪ Automotive interiors ▪ Multi-shop operators (MSOs) ▪ Wood ▪ Rail, bus, machinery ▪ Coatings for plastics and MARKETS ▪ Auto dealership groups ▪ Electrical equipment ▪ Recreational vehicles composite materials ▪ Coil and extruded metals ▪ Marine _____________________________________________________________________________________________________________________________ 1. Financials for FY 2018, as revised to reclassify other revenue into net sales for all historical periods PROPRIETARY Sensitivity: Business Internal 3
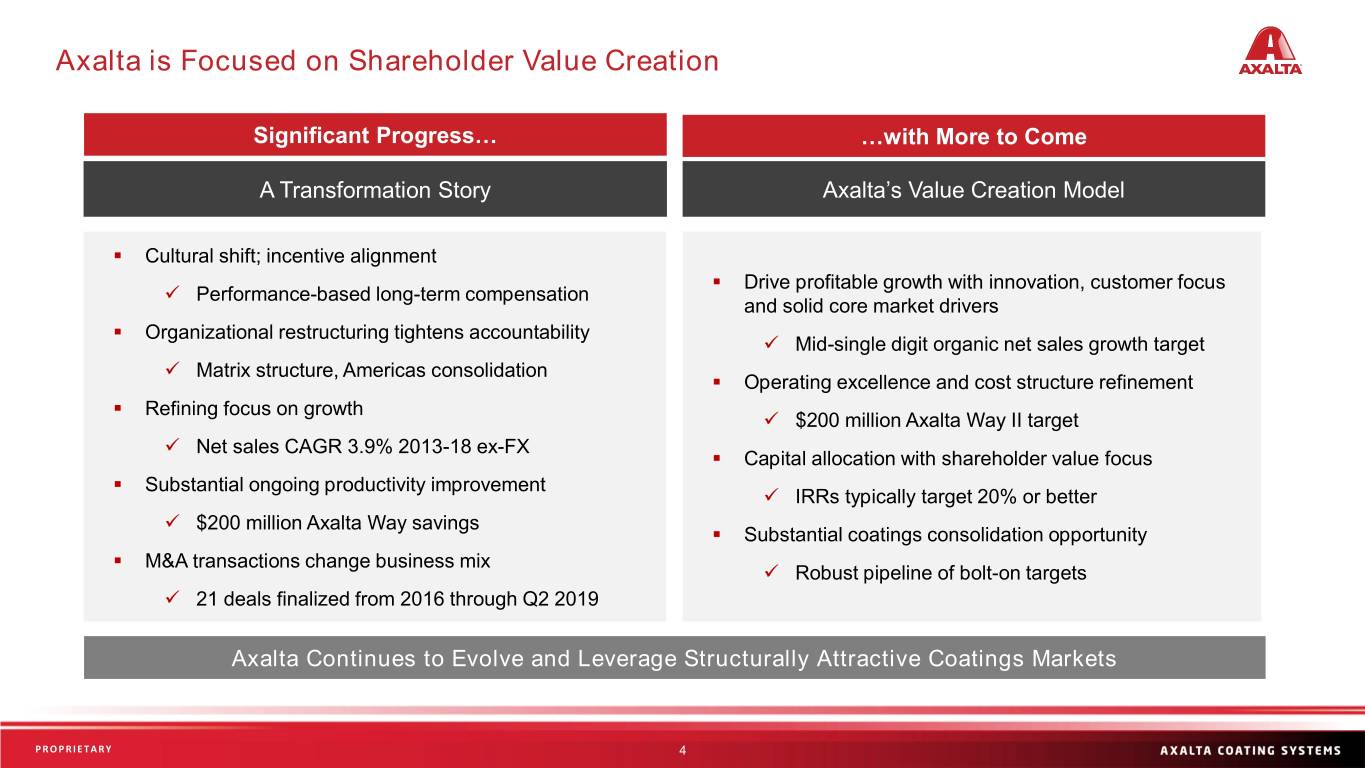
Axalta is Focused on Shareholder Value Creation Significant Progress… …with More to Come A Transformation Story Axalta’s Value Creation Model ▪ Cultural shift; incentive alignment ▪ Drive profitable growth with innovation, customer focus ✓ Performance-based long-term compensation and solid core market drivers ▪ Organizational restructuring tightens accountability ✓ Mid-single digit organic net sales growth target ✓ Matrix structure, Americas consolidation ▪ Operating excellence and cost structure refinement ▪ Refining focus on growth ✓ $200 million Axalta Way II target ✓ Net sales CAGR 3.9% 2013-18 ex-FX ▪ Capital allocation with shareholder value focus ▪ Substantial ongoing productivity improvement ✓ IRRs typically target 20% or better ✓ $200 million Axalta Way savings ▪ Substantial coatings consolidation opportunity ▪ M&A transactions change business mix ✓ Robust pipeline of bolt-on targets ✓ 21 deals finalized from 2016 through Q2 2019 Axalta Continues to Evolve and Leverage Structurally Attractive Coatings Markets PROPRIETARY Sensitivity: Business Internal 4
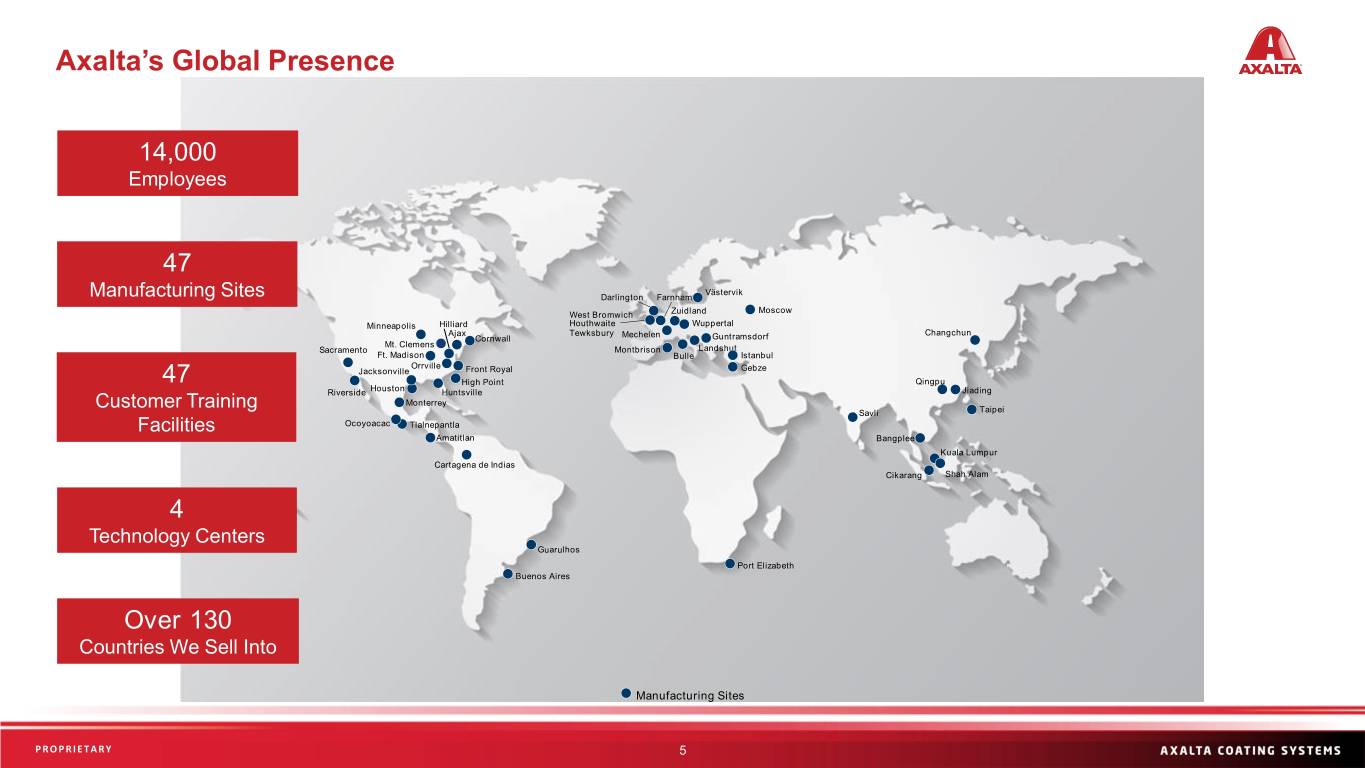
Axalta’s Global Presence 14,000 Employees 47 Västervik Manufacturing Sites Darlington Farnham Moscow West Bromwich Zuidland Minneapolis Hilliard Houthwaite Wuppertal Ajax Tewksbury Changchun Cornwall Mechelen Guntramsdorf Mt. Clemens Sacramento Montbrison Landshut Ft. Madison Bulle Istanbul Orrville Jacksonville Front Royal Gebze 47 High Point Qingpu Riverside Houston Huntsville Jiading Customer Training Monterrey Savli Taipei Facilities Ocoyoacac Tlalnepantla Amatitlan Bangplee Kuala Lumpur Cartagena de Indias Cikarang Shah Alam 4 Technology Centers Guarulhos Port Elizabeth Buenos Aires Over 130 Countries We Sell Into Manufacturing Sites PROPRIETARY 5 Sensitivity: Business Internal 5
Why Invest in Axalta Today? Strong Free Focused End- Consolidation ROIC Growth Significant Axalta Way Cash Flow Markets, Opportunity Focus, China Growth Driving Generation and Structural with Proven Shareholder Opportunity Productivity Allocation Volume Growth M&A Strategy Value Alignment Process PROPRIETARY Sensitivity: Business Internal 6
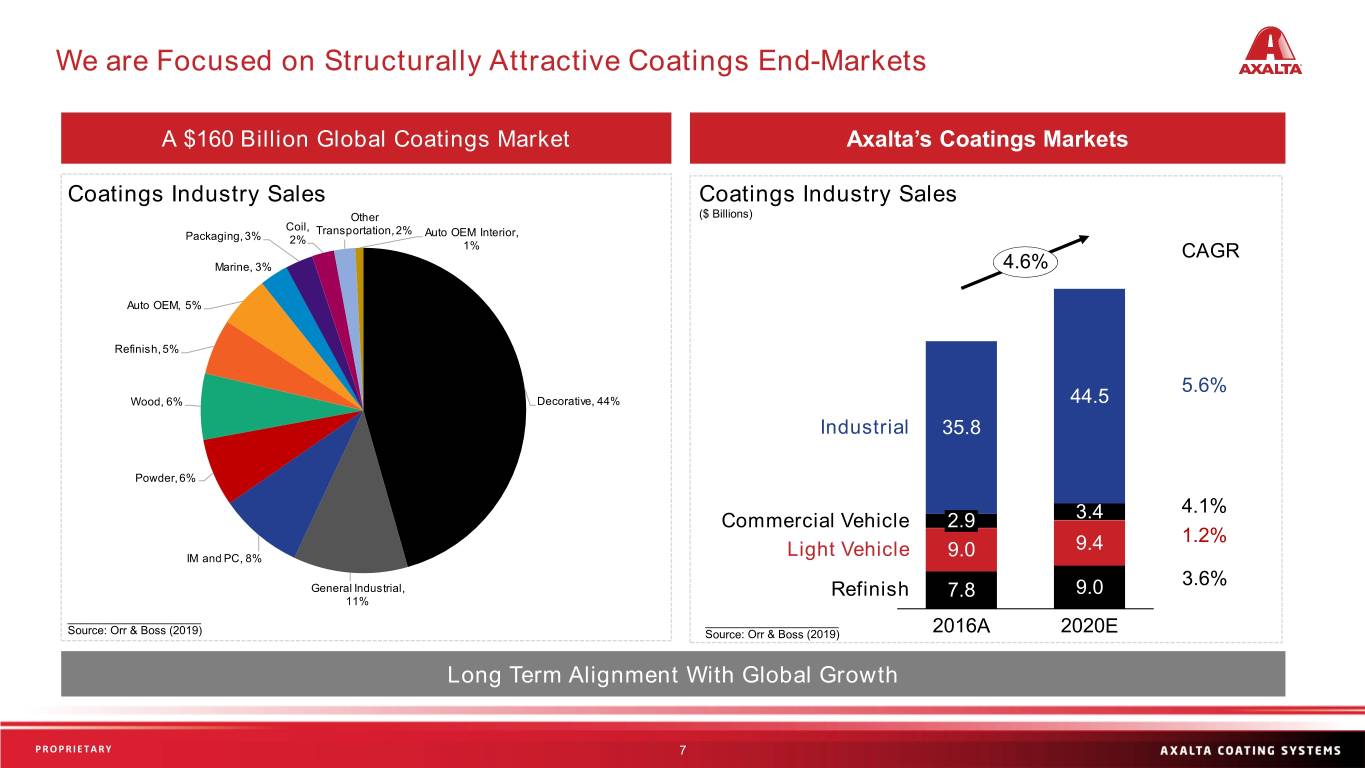
We are Focused on Structurally Attractive Coatings End-Markets A $160 Billion Global Coatings Market Axalta’s Coatings Markets Coatings Industry Sales Coatings Industry Sales Other ($ Billions) Coil, Transportation, 2% Auto OEM Interior, Packaging, 3% 2% 1% CAGR Marine, 3% 4.6% Auto OEM, 5% Refinish, 5% 5.6% Wood, 6% Decorative, 44% 44.5 Industrial 35.8 Powder, 6% 4.1% Commercial Vehicle 2.9 3.4 9.4 1.2% IM and PC, 8% Light Vehicle 9.0 3.6% General Industrial, Refinish 7.8 9.0 11% _____________________ _____________________ Source: Orr & Boss (2019) Source: Orr & Boss (2019) 2016A 2020E Long Term Alignment With Global Growth PROPRIETARY Sensitivity: Business Internal 7
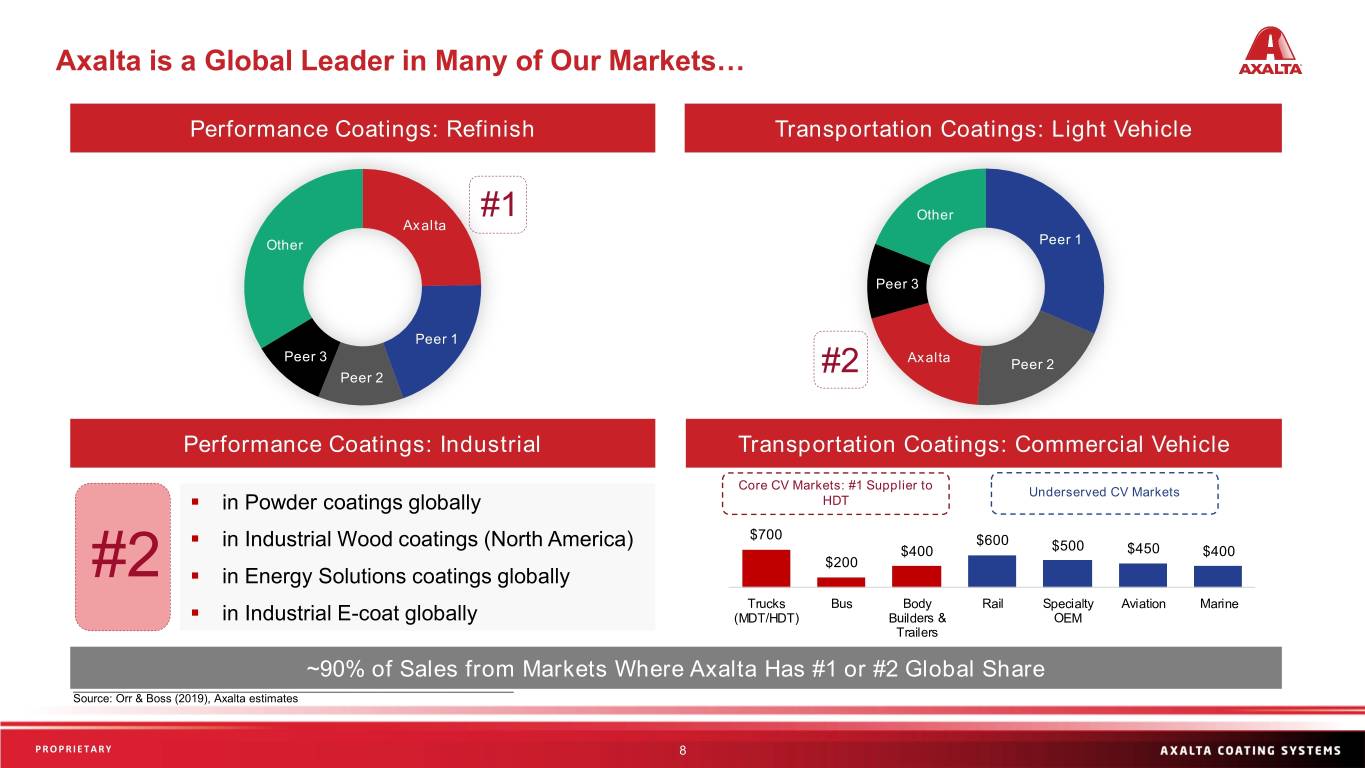
Axalta is a Global Leader in Many of Our Markets… Performance Coatings: Refinish Transportation Coatings: Light Vehicle #1 Other Axalta Other Peer 1 Peer 3 Peer 1 Peer 3 Axalta Peer 2 Peer 2 #2 Performance Coatings: Industrial Transportation Coatings: Commercial Vehicle Core CV Markets: #1 Supplier to Underserved CV Markets ▪ in Powder coatings globally HDT ▪ in Industrial Wood coatings (North America) $700 $600 $400 $500 $450 $400 $200 #2 ▪ in Energy Solutions coatings globally Trucks Bus Body Rail Specialty Aviation Marine ▪ in Industrial E-coat globally (MDT/HDT) Builders & OEM Trailers ~90% of Sales from Markets Where Axalta Has #1 or #2 Global Share _____________________________________________________________________ Source: Orr & Boss (2019), Axalta estimates PROPRIETARY Sensitivity: Business Internal 8
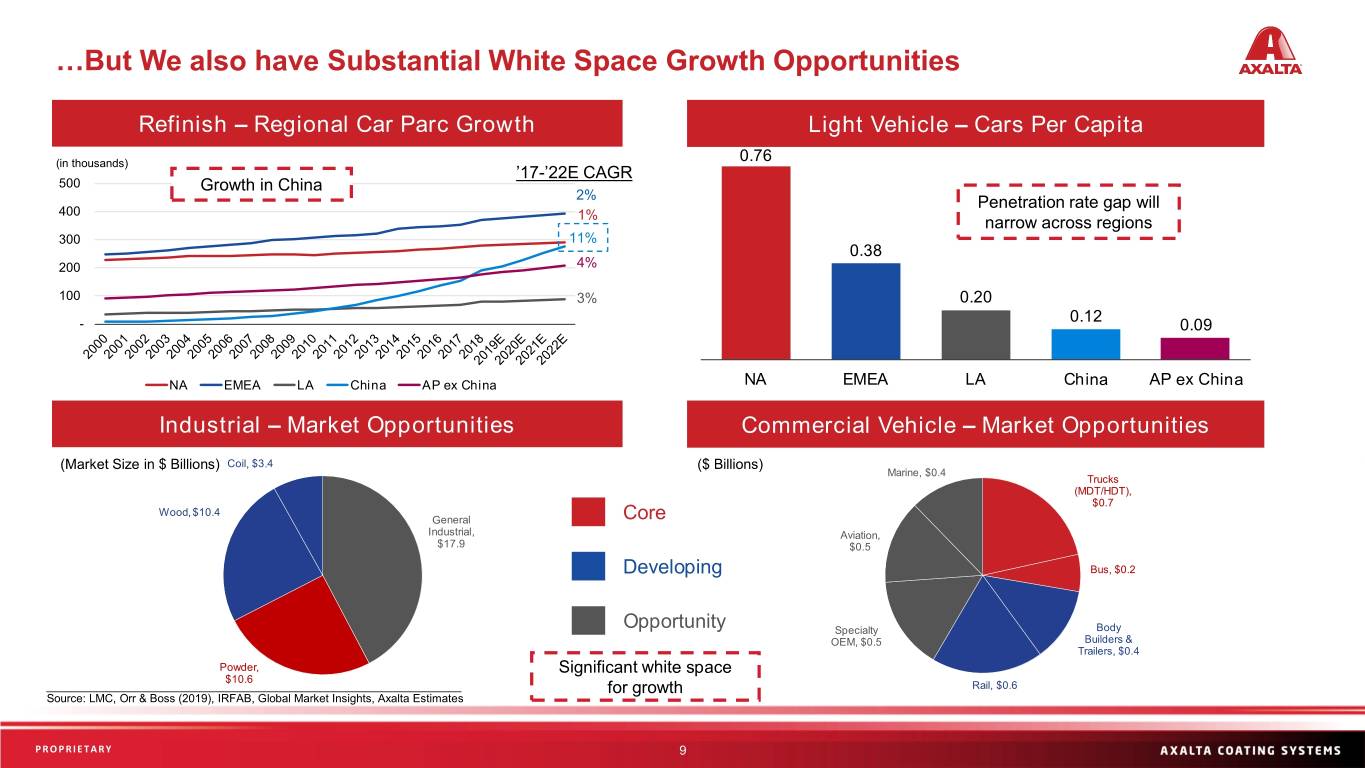
…But We also have Substantial White Space Growth Opportunities Refinish – Regional Car Parc Growth Light Vehicle – Cars Per Capita (in thousands) 0.76 ’17-’22E CAGR 500 Growth in China 2% Penetration rate gap will 400 1% narrow across regions 300 11% 0.38 200 4% 100 3% 0.20 0.12 - 0.09 NA EMEA LA China AP ex China NA EMEA LA China AP ex China Industrial – Market Opportunities Commercial Vehicle – Market Opportunities (Market Size in $ Billions) Coil, $3.4 ($ Billions) Marine, $0.4 Trucks (MDT/HDT), $0.7 Wood, $10.4 General Core Industrial, Aviation, $17.9 $0.5 Developing Bus, $0.2 Opportunity Specialty Body OEM, $0.5 Builders & Trailers, $0.4 Powder, Significant white space $10.6 _________________________________________________________________ for growth Rail, $0.6 Source: LMC, Orr & Boss (2019), IRFAB, Global Market Insights, Axalta Estimates PROPRIETARY Sensitivity: Business Internal 9
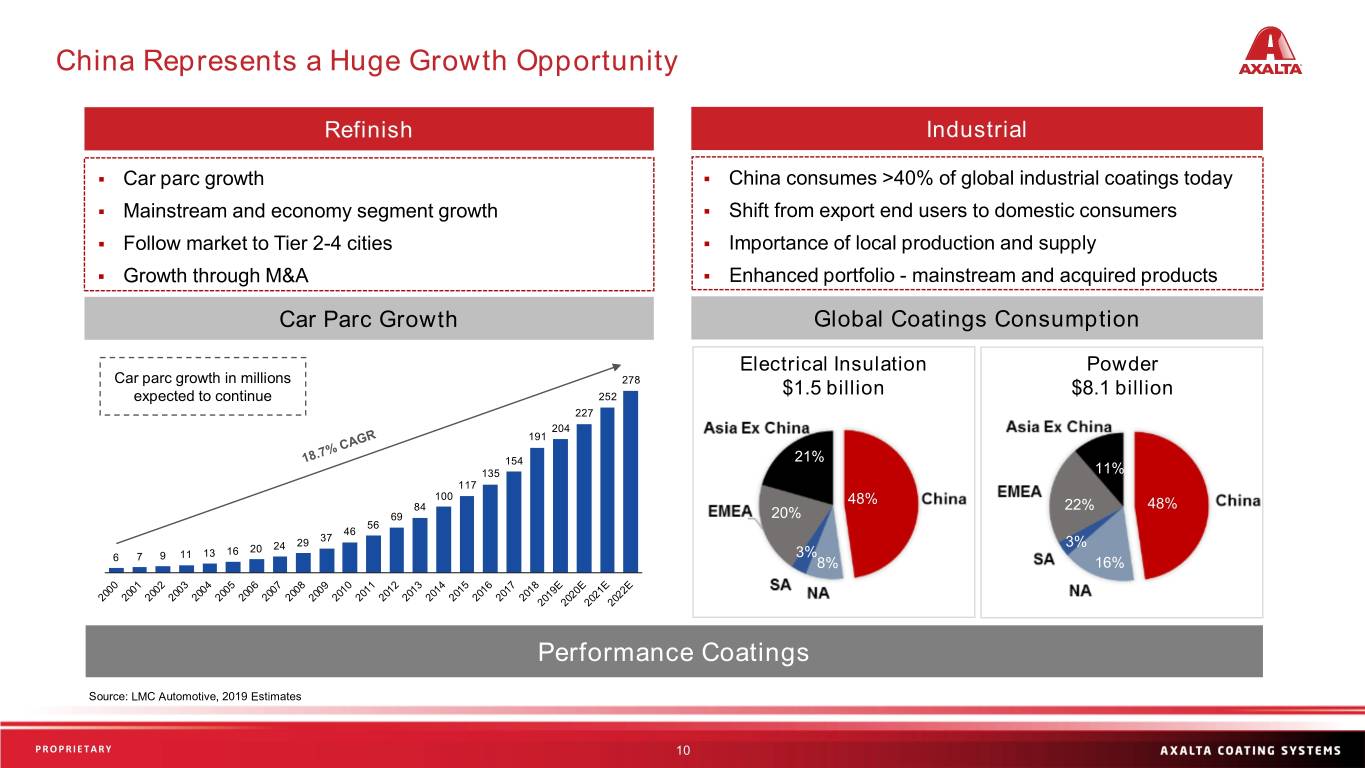
China Represents a Huge Growth Opportunity Refinish Industrial ▪ Car parc growth ▪ China consumes >40% of global industrial coatings today ▪ Mainstream and economy segment growth ▪ Shift from export end users to domestic consumers ▪ Follow market to Tier 2-4 cities ▪ Importance of local production and supply ▪ Growth through M&A ▪ Enhanced portfolio - mainstream and acquired products Car Parc Growth Global Coatings Consumption Electrical Insulation Powder Car parc growth in millions 278 expected to continue 252 $1.5 billion $8.1 billion 227 204 191 154 21% 135 11% 117 100 48% 84 22% 48% 69 20% 56 46 29 37 20 24 3% 11 13 16 3% 6 7 9 8% 16% Performance Coatings Source: LMC Automotive, 2019 Estimates PROPRIETARY Sensitivity: Business Internal 10
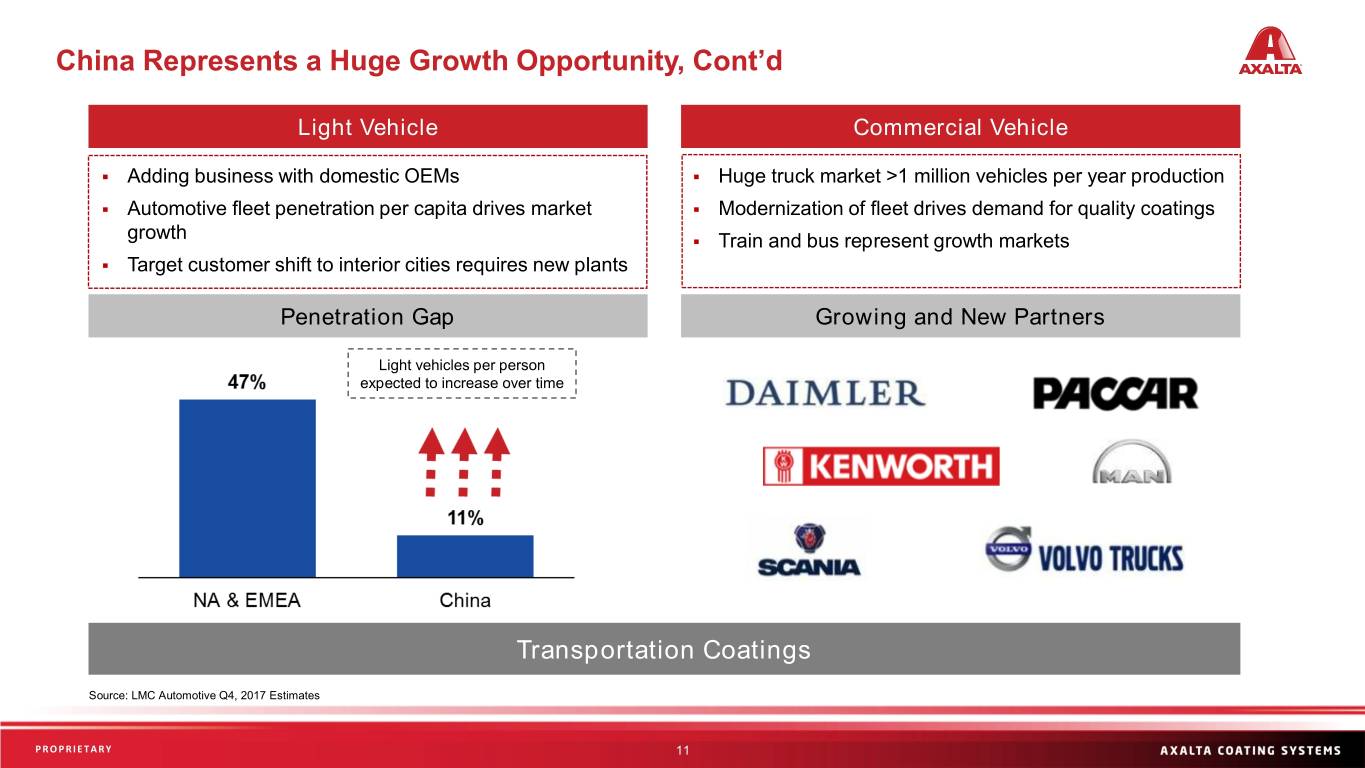
China Represents a Huge Growth Opportunity, Cont’d Light Vehicle Commercial Vehicle ▪ Adding business with domestic OEMs ▪ Huge truck market >1 million vehicles per year production ▪ Automotive fleet penetration per capita drives market ▪ Modernization of fleet drives demand for quality coatings growth ▪ Train and bus represent growth markets ▪ Target customer shift to interior cities requires new plants Penetration Gap Growing and New Partners Light vehicles per person expected to increase over time Transportation Coatings Source: LMC Automotive Q4, 2017 Estimates PROPRIETARY Sensitivity: Business Internal 11
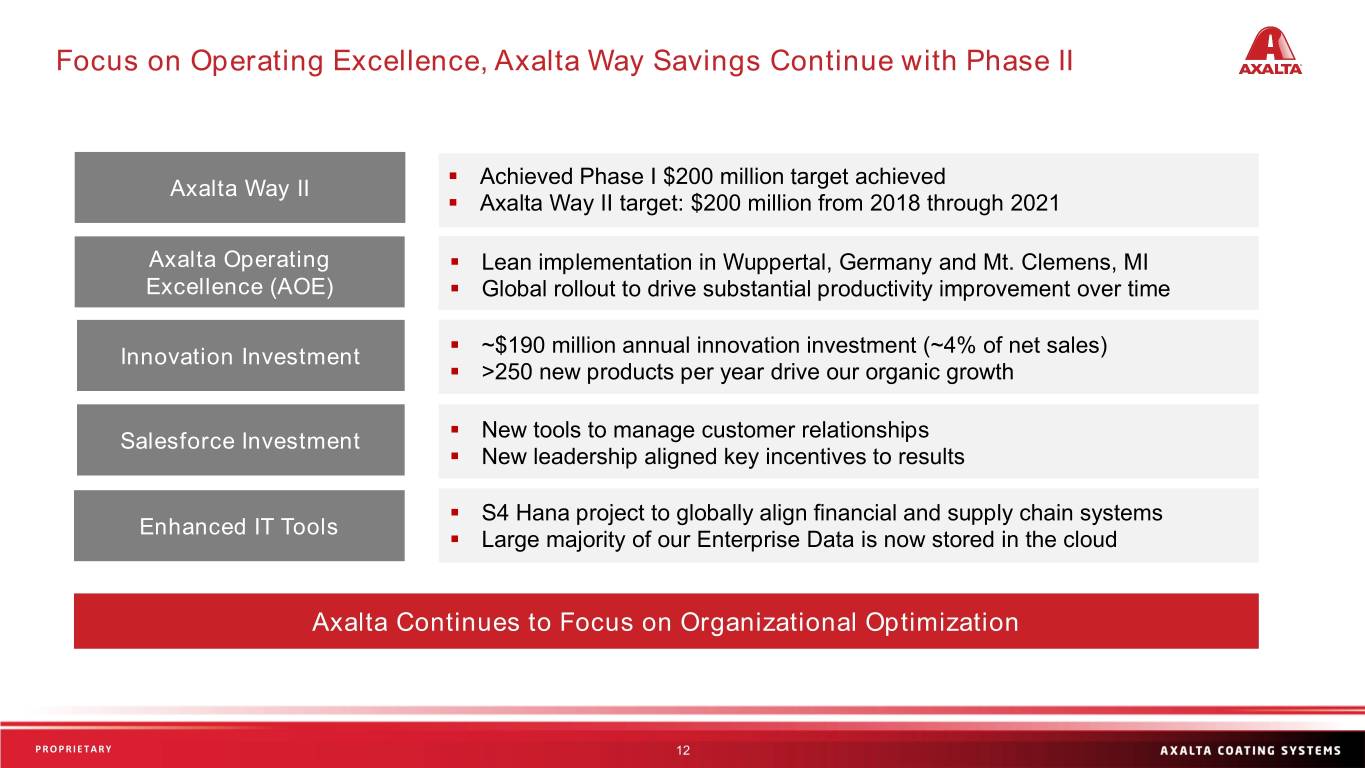
Focus on Operating Excellence, Axalta Way Savings Continue with Phase II ▪ Achieved Phase I $200 million target achieved Axalta Way II ▪ Axalta Way II target: $200 million from 2018 through 2021 Axalta Operating ▪ Lean implementation in Wuppertal, Germany and Mt. Clemens, MI Excellence (AOE) ▪ Global rollout to drive substantial productivity improvement over time ~$190 million annual innovation investment (~4% of net sales) Innovation Investment ▪ ▪ >250 new products per year drive our organic growth Salesforce Investment ▪ New tools to manage customer relationships ▪ New leadership aligned key incentives to results ▪ S4 Hana project to globally align financial and supply chain systems Enhanced IT Tools ▪ Large majority of our Enterprise Data is now stored in the cloud Axalta Continues to Focus on Organizational Optimization PROPRIETARY Sensitivity: Business Internal 12
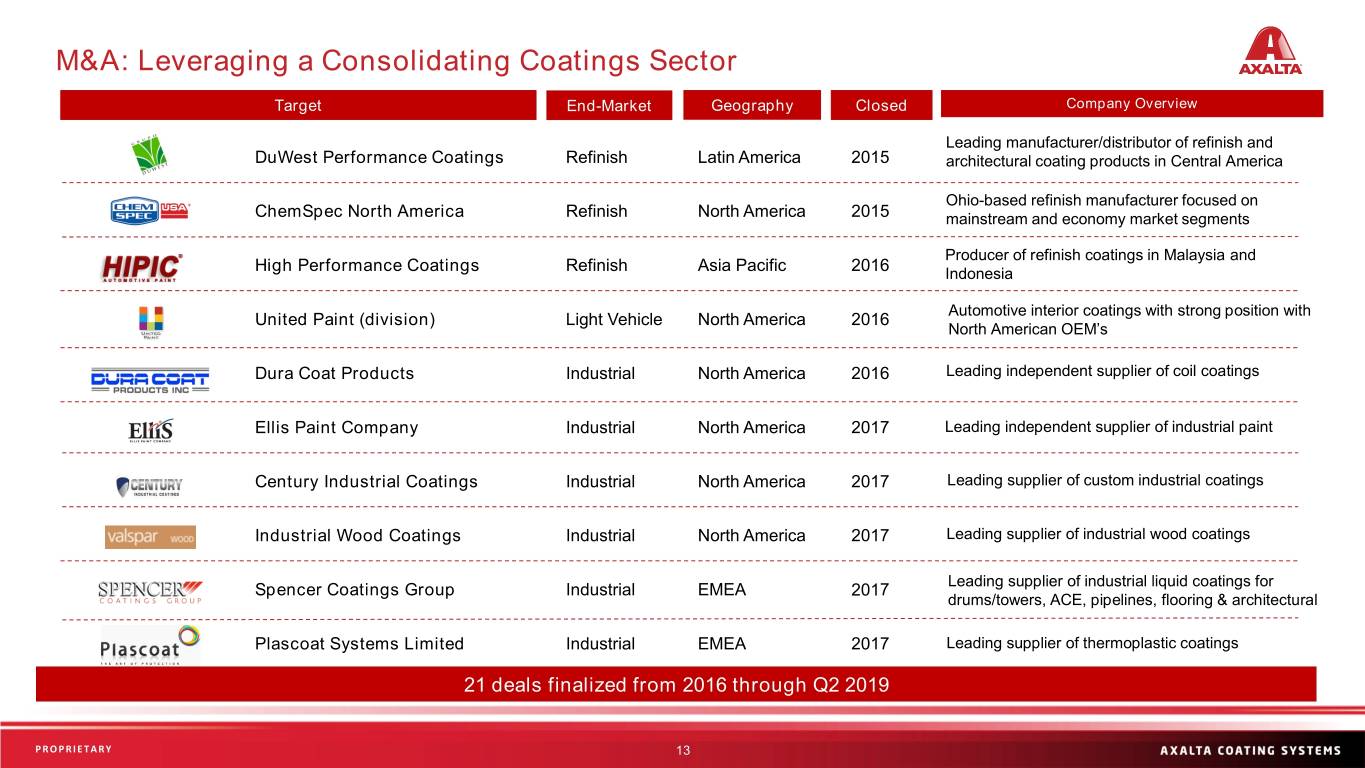
M&A: Leveraging a Consolidating Coatings Sector Target End-Market Geography Closed Company Overview Leading manufacturer/distributor of refinish and DuWest Performance Coatings Refinish Latin America 2015 architectural coating products in Central America Ohio-based refinish manufacturer focused on ChemSpec North America Refinish North America 2015 mainstream and economy market segments Producer of refinish coatings in Malaysia and High Performance Coatings Refinish Asia Pacific 2016 Indonesia Automotive interior coatings with strong position with United Paint (division) Light Vehicle North America 2016 North American OEM’s Dura Coat Products Industrial North America 2016 Leading independent supplier of coil coatings Ellis Paint Company Industrial North America 2017 Leading independent supplier of industrial paint Century Industrial Coatings Industrial North America 2017 Leading supplier of custom industrial coatings Industrial Wood Coatings Industrial North America 2017 Leading supplier of industrial wood coatings Leading supplier of industrial liquid coatings for Spencer Coatings Group Industrial EMEA 2017 drums/towers, ACE, pipelines, flooring & architectural Plascoat Systems Limited Industrial EMEA 2017 Leading supplier of thermoplastic coatings 21 deals finalized from 2016 through Q2 2019 PROPRIETARY Sensitivity: Business Internal 13
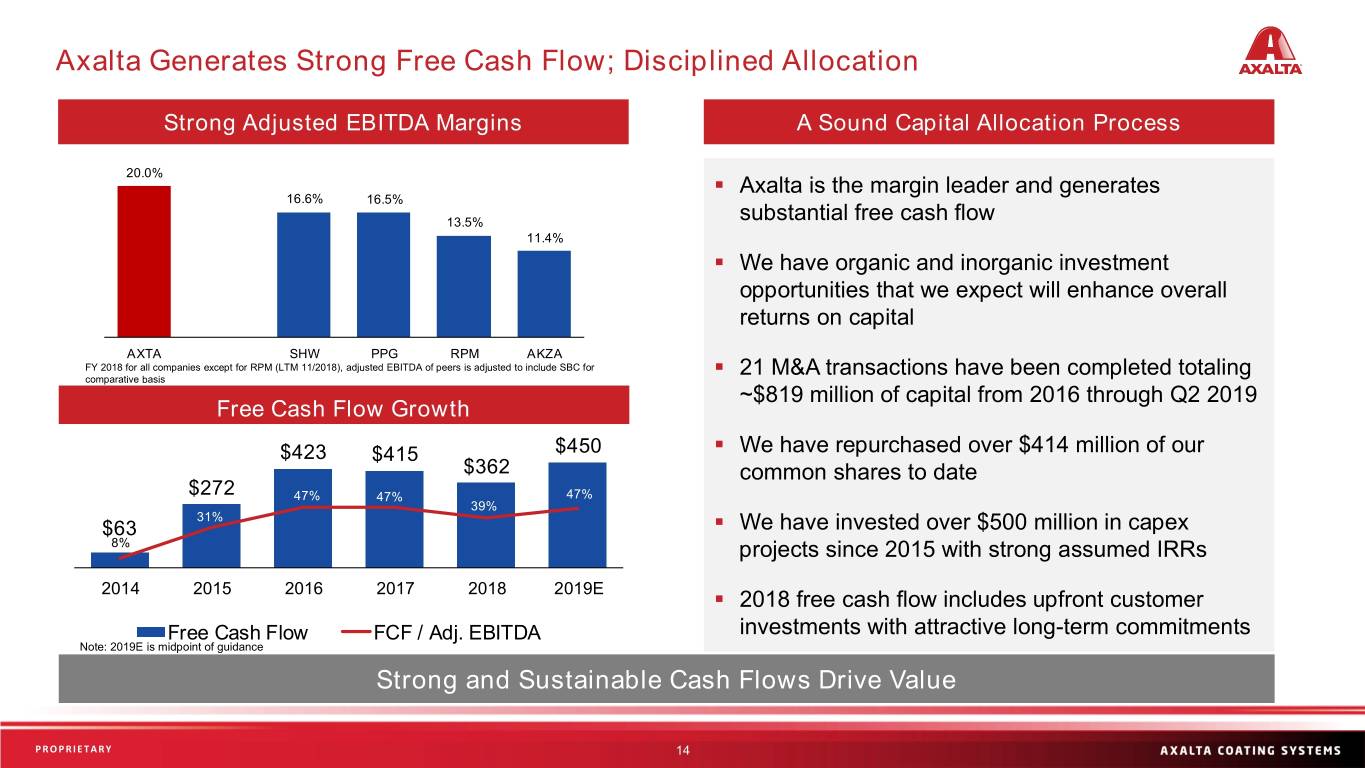
Axalta Generates Strong Free Cash Flow; Disciplined Allocation Strong Adjusted EBITDA Margins A Sound Capital Allocation Process 20.0% ▪ Axalta is the margin leader and generates 16.6% 16.5% 13.5% substantial free cash flow 11.4% ▪ We have organic and inorganic investment opportunities that we expect will enhance overall returns on capital AXTA SHW PPG RPM AKZA FY 2018 for all companies except for RPM (LTM 11/2018), adjusted EBITDA of peers is adjusted to include SBC for ▪ 21 M&A transactions have been completed totaling comparative basis ~$819 million of capital from 2016 through Q2 2019 Free Cash Flow Growth 100% $500 $423 $450 ▪ We have repurchased over $414 million of our $415 80% $400 $362 common shares to date 60% $300 $272 47% 47% 47% 39% 31% 40% $200 $63 ▪ We have invested over $500 million in capex $100 8% 20% projects since 2015 with strong assumed IRRs $0 0% 2014 2015 2016 2017 2018 2019E ▪ 2018 free cash flow includes upfront customer Free Cash Flow FCF / Adj. EBITDA investments with attractive long-term commitments Note: 2019E is midpoint of guidance Strong and Sustainable Cash Flows Drive Value PROPRIETARY Sensitivity: Business Internal 14
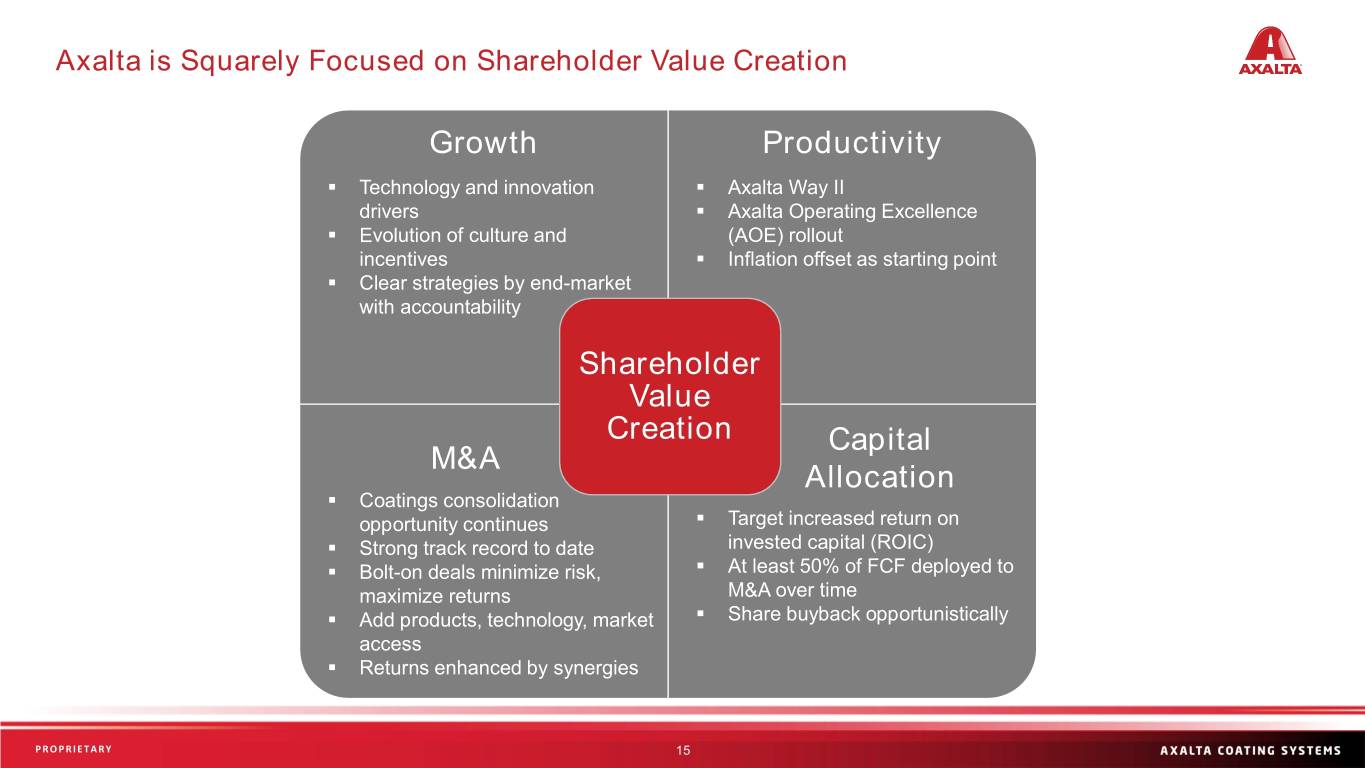
Axalta is Squarely Focused on Shareholder Value Creation Growth Productivity ▪ Technology and innovation ▪ Axalta Way II drivers ▪ Axalta Operating Excellence ▪ Evolution of culture and (AOE) rollout incentives ▪ Inflation offset as starting point ▪ Clear strategies by end-market with accountability Shareholder Value Creation Capital M&A Allocation ▪ Coatings consolidation opportunity continues ▪ Target increased return on ▪ Strong track record to date invested capital (ROIC) ▪ Bolt-on deals minimize risk, ▪ At least 50% of FCF deployed to maximize returns M&A over time ▪ Add products, technology, market ▪ Share buyback opportunistically access ▪ Returns enhanced by synergies PROPRIETARY Sensitivity: Business Internal 15
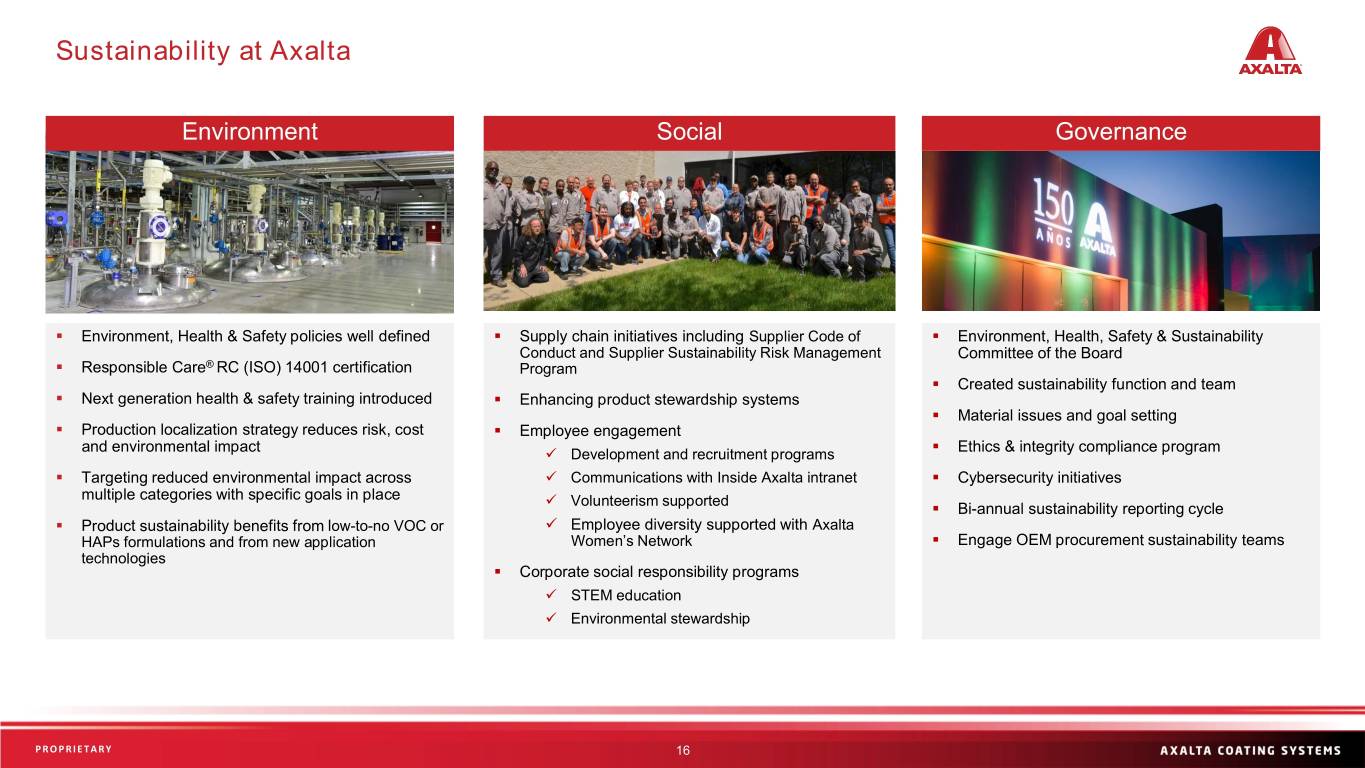
Sustainability at Axalta Environment Social Governance ▪ Environment, Health & Safety policies well defined ▪ Supply chain initiatives including Supplier Code of ▪ Environment, Health, Safety & Sustainability Conduct and Supplier Sustainability Risk Management Committee of the Board ▪ Responsible Care® RC (ISO) 14001 certification Program ▪ Created sustainability function and team ▪ Next generation health & safety training introduced ▪ Enhancing product stewardship systems ▪ Material issues and goal setting ▪ Production localization strategy reduces risk, cost ▪ Employee engagement and environmental impact ▪ Ethics & integrity compliance program ✓ Development and recruitment programs ▪ Targeting reduced environmental impact across ✓ Communications with Inside Axalta intranet ▪ Cybersecurity initiatives multiple categories with specific goals in place ✓ Volunteerism supported ▪ Bi-annual sustainability reporting cycle ▪ Product sustainability benefits from low-to-no VOC or ✓ Employee diversity supported with Axalta HAPs formulations and from new application Women’s Network ▪ Engage OEM procurement sustainability teams technologies ▪ Corporate social responsibility programs ✓ STEM education ✓ Environmental stewardship PROPRIETARY Sensitivity: Business Internal 16
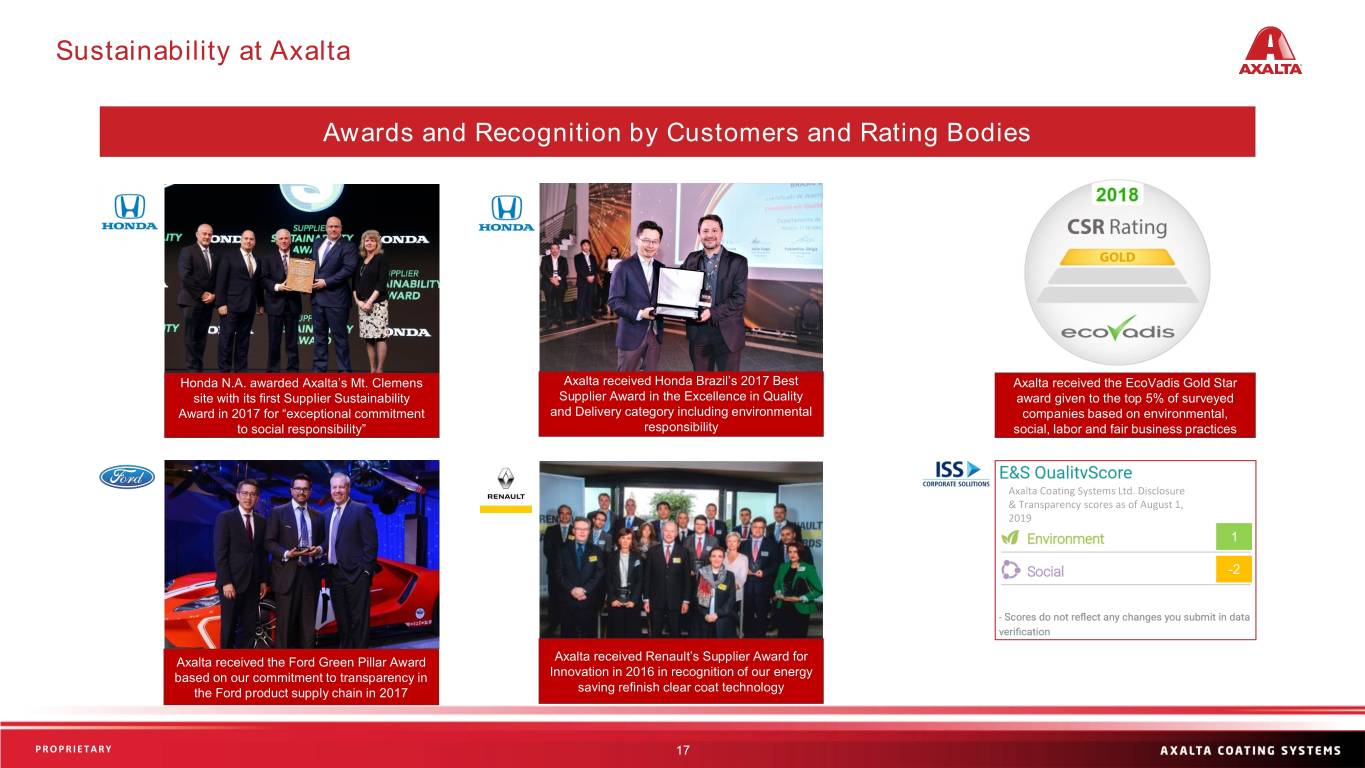
Sustainability at Axalta Awards and Recognition by Customers and Rating Bodies Honda N.A. awarded Axalta’s Mt. Clemens Axalta received Honda Brazil’s 2017 Best Axalta received the EcoVadis Gold Star site with its first Supplier Sustainability Supplier Award in the Excellence in Quality award given to the top 5% of surveyed Award in 2017 for “exceptional commitment and Delivery category including environmental companies based on environmental, to social responsibility” responsibility social, labor and fair business practices AxaltaAxaltaAxalta Coating CoatingCoating Systems SystemsSystems Ltd. Ltd.Ltd. Disclosure DisclosureDisclosure & & Transparency& Transparency scores scores as of as May of AugustMay 1, 2019 1, 20191, 2019 1 -2 Axalta received the Ford Green Pillar Award Axalta received Renault’s Supplier Award for based on our commitment to transparency in Innovation in 2016 in recognition of our energy the Ford product supply chain in 2017 saving refinish clear coat technology PROPRIETARY Sensitivity: Business Internal 17
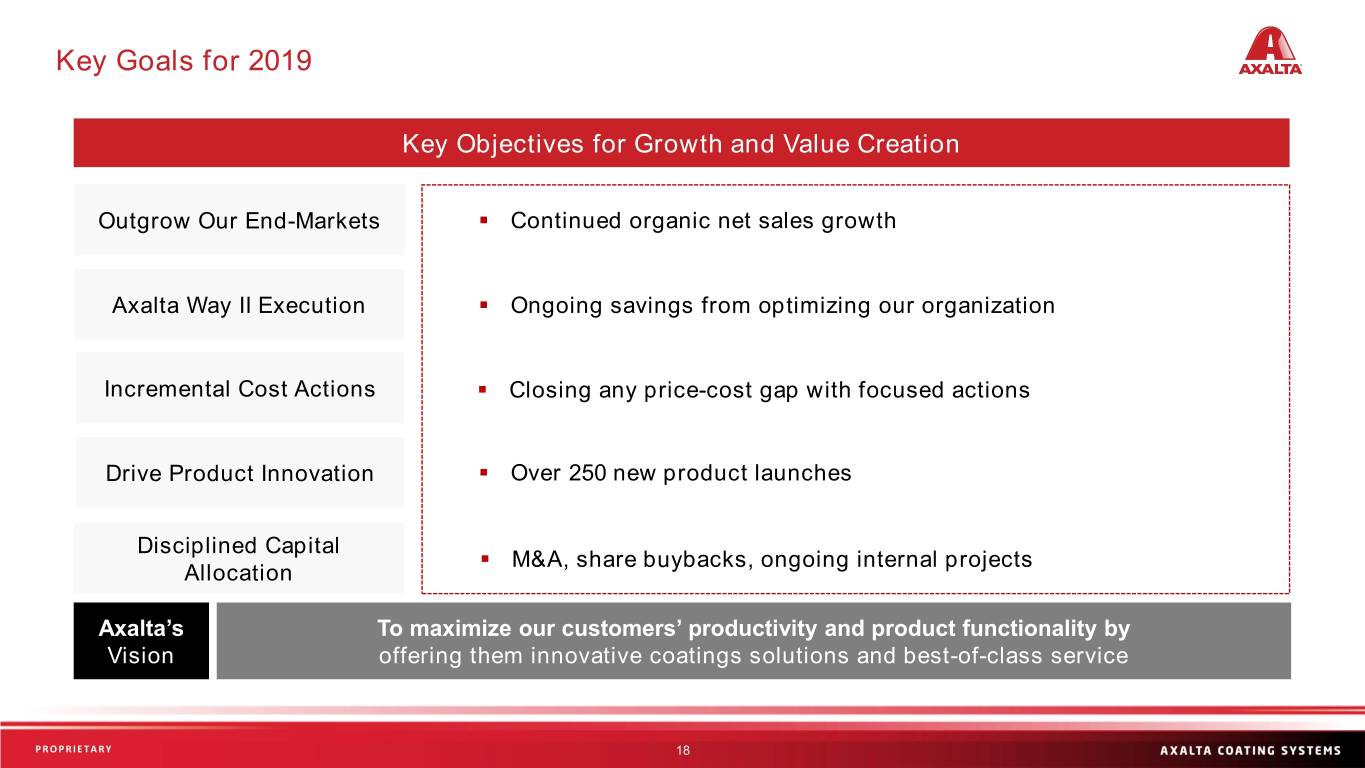
Key Goals for 2019 Key Objectives for Growth and Value Creation Outgrow Our End-Markets ▪ Continued organic net sales growth Axalta Way II Execution ▪ Ongoing savings from optimizing our organization Incremental Cost Actions ▪ Closing any price-cost gap with focused actions Drive Product Innovation ▪ Over 250 new product launches Disciplined Capital ▪ M&A, share buybacks, ongoing internal projects Allocation Axalta’s To maximize our customers’ productivity and product functionality by Vision offering them innovative coatings solutions and best-of-class service PROPRIETARY Sensitivity: Business Internal 18
Financial Overview Sensitivity: Business Internal
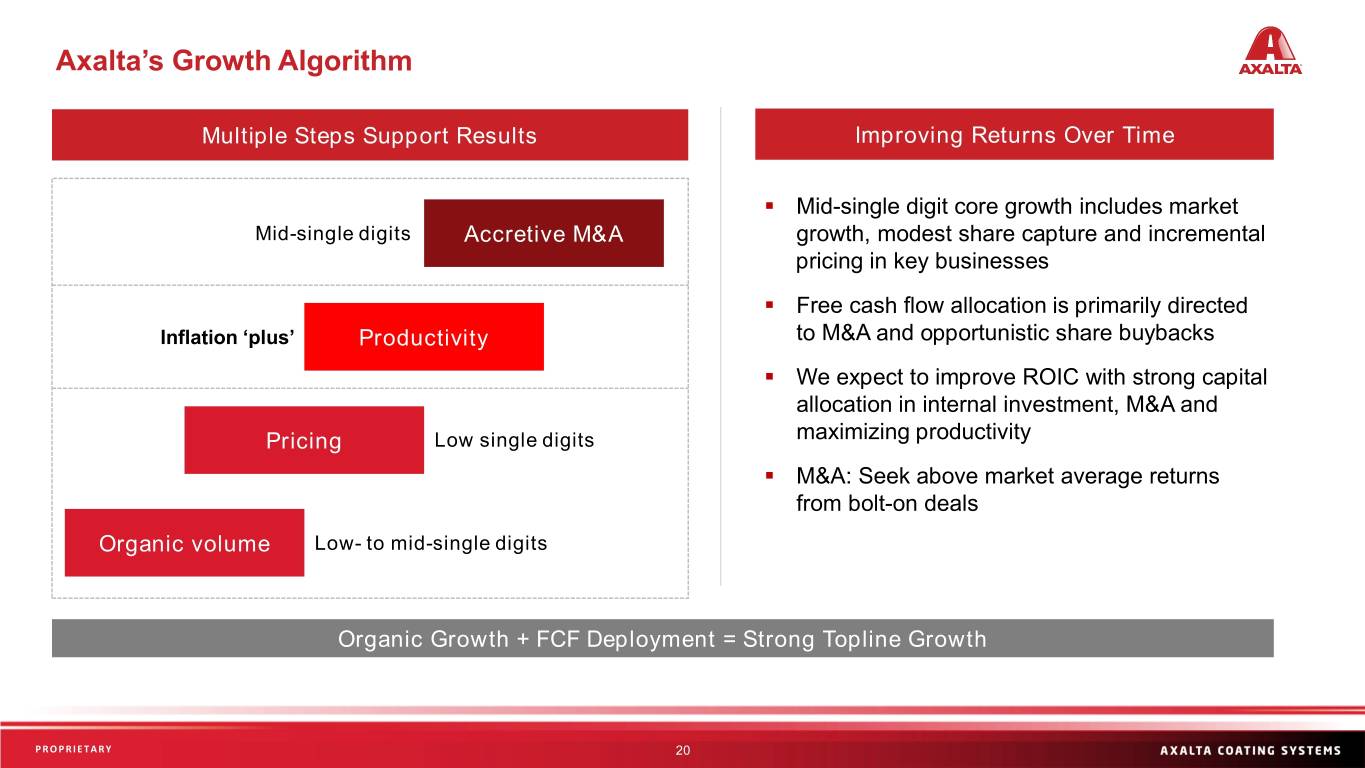
Axalta’s Growth Algorithm Multiple Steps Support Results Improving Returns Over Time ▪ Mid-single digit core growth includes market Mid-single digits Accretive M&A growth, modest share capture and incremental pricing in key businesses ▪ Free cash flow allocation is primarily directed Inflation ‘plus’ Productivity to M&A and opportunistic share buybacks ▪ We expect to improve ROIC with strong capital allocation in internal investment, M&A and Pricing Low single digits maximizing productivity ▪ M&A: Seek above market average returns from bolt-on deals Organic volume Low- to mid-single digits Organic Growth + FCF Deployment = Strong Topline Growth PROPRIETARY Sensitivity: Business Internal 20
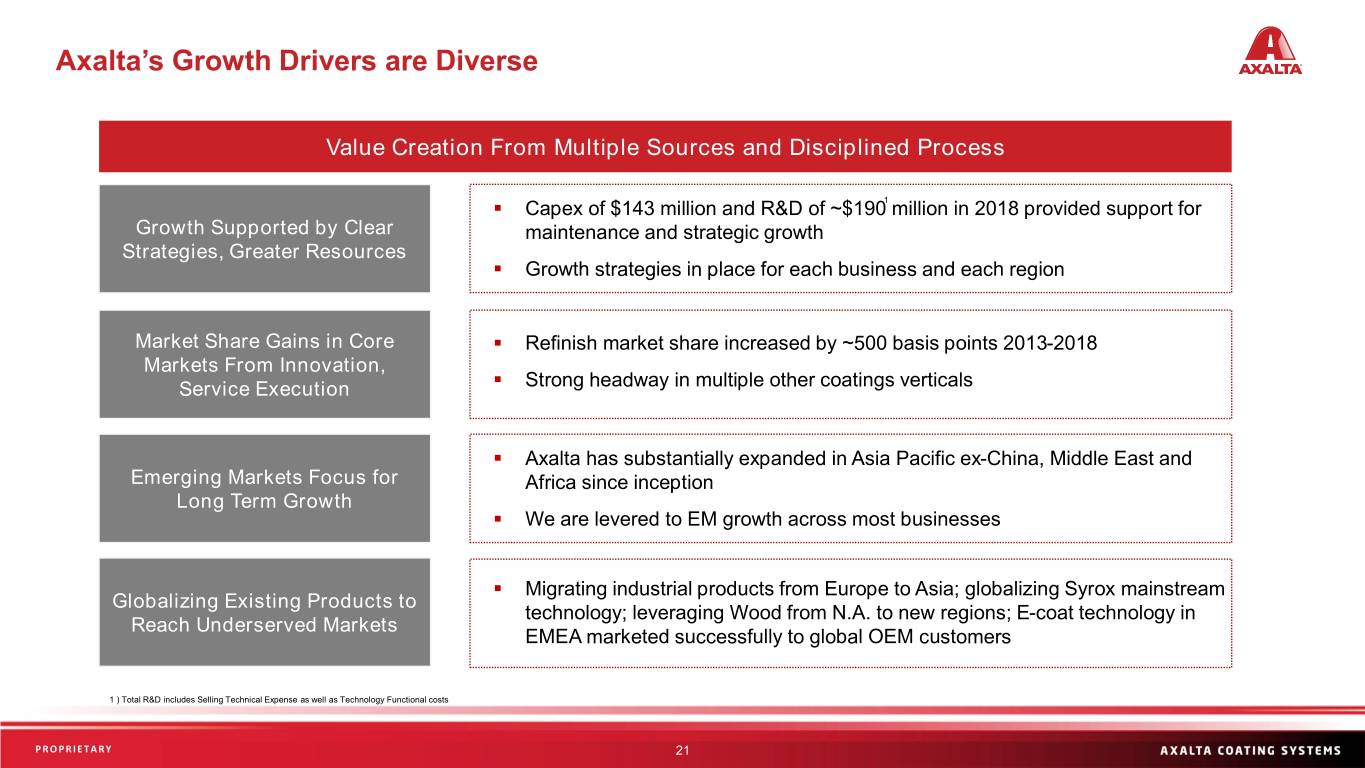
Axalta’s Growth Drivers are Diverse Value Creation From Multiple Sources and Disciplined Process ▪ Capex of $143 million and R&D of ~$1901 million in 2018 provided support for Growth Supported by Clear maintenance and strategic growth Strategies, Greater Resources ▪ Growth strategies in place for each business and each region Market Share Gains in Core ▪ Refinish market share increased by ~500 basis points 2013-2018 Markets From Innovation, Service Execution ▪ Strong headway in multiple other coatings verticals ▪ Axalta has substantially expanded in Asia Pacific ex-China, Middle East and Emerging Markets Focus for Africa since inception Long Term Growth ▪ We are levered to EM growth across most businesses ▪ Migrating industrial products from Europe to Asia; globalizing Syrox mainstream Globalizing Existing Products to technology; leveraging Wood from N.A. to new regions; E-coat technology in Reach Underserved Markets EMEA marketed successfully to global OEM customers 1 ) Total R&D includes Selling Technical Expense as well as Technology Functional costs PROPRIETARY Sensitivity: Business Internal 21
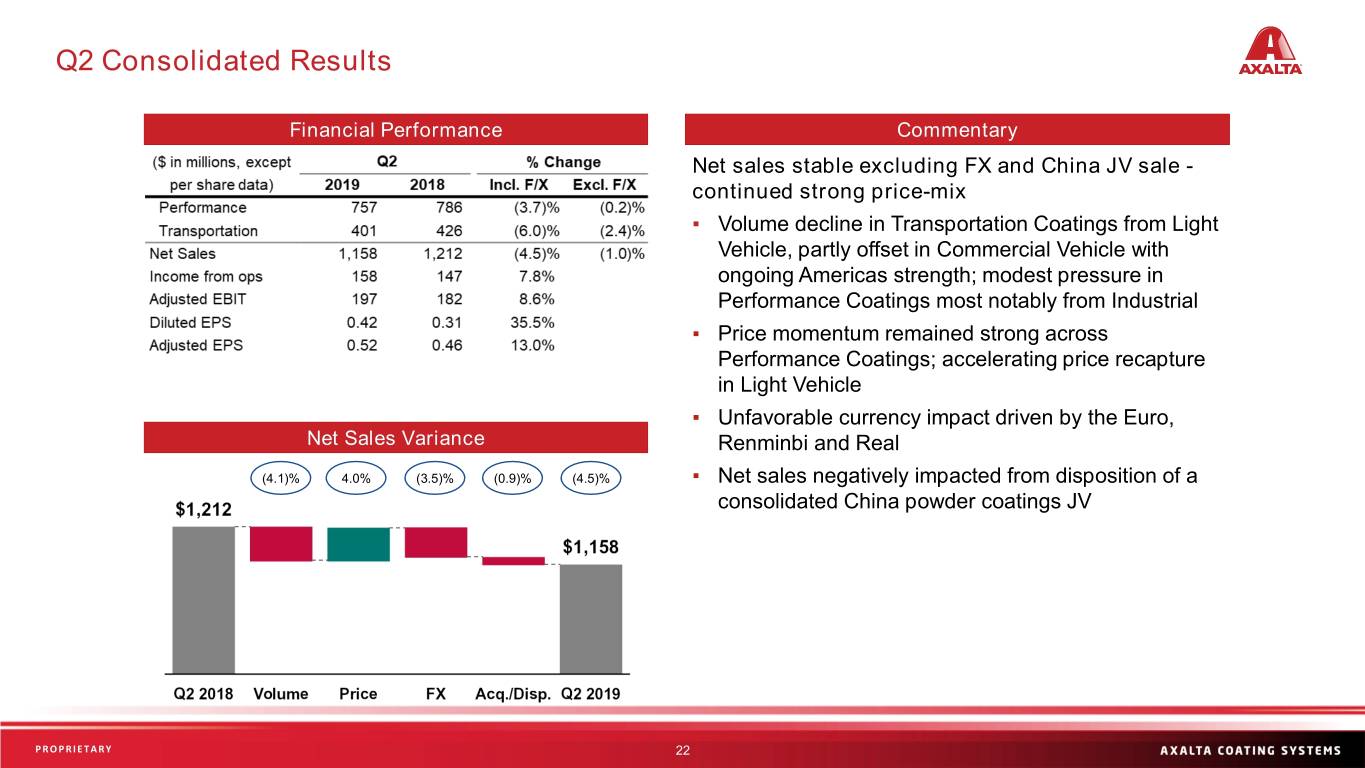
Q2 Consolidated Results Financial Performance Commentary Net sales stable excluding FX and China JV sale - continued strong price-mix ▪ Volume decline in Transportation Coatings from Light Vehicle, partly offset in Commercial Vehicle with ongoing Americas strength; modest pressure in Performance Coatings most notably from Industrial ▪ Price momentum remained strong across Performance Coatings; accelerating price recapture in Light Vehicle ▪ Unfavorable currency impact driven by the Euro, Net Sales Variance Renminbi and Real (4.1)% 4.0% (3.5)% (0.9)% (4.5)% ▪ Net sales negatively impacted from disposition of a consolidated China powder coatings JV PROPRIETARY Sensitivity: Business Internal 22
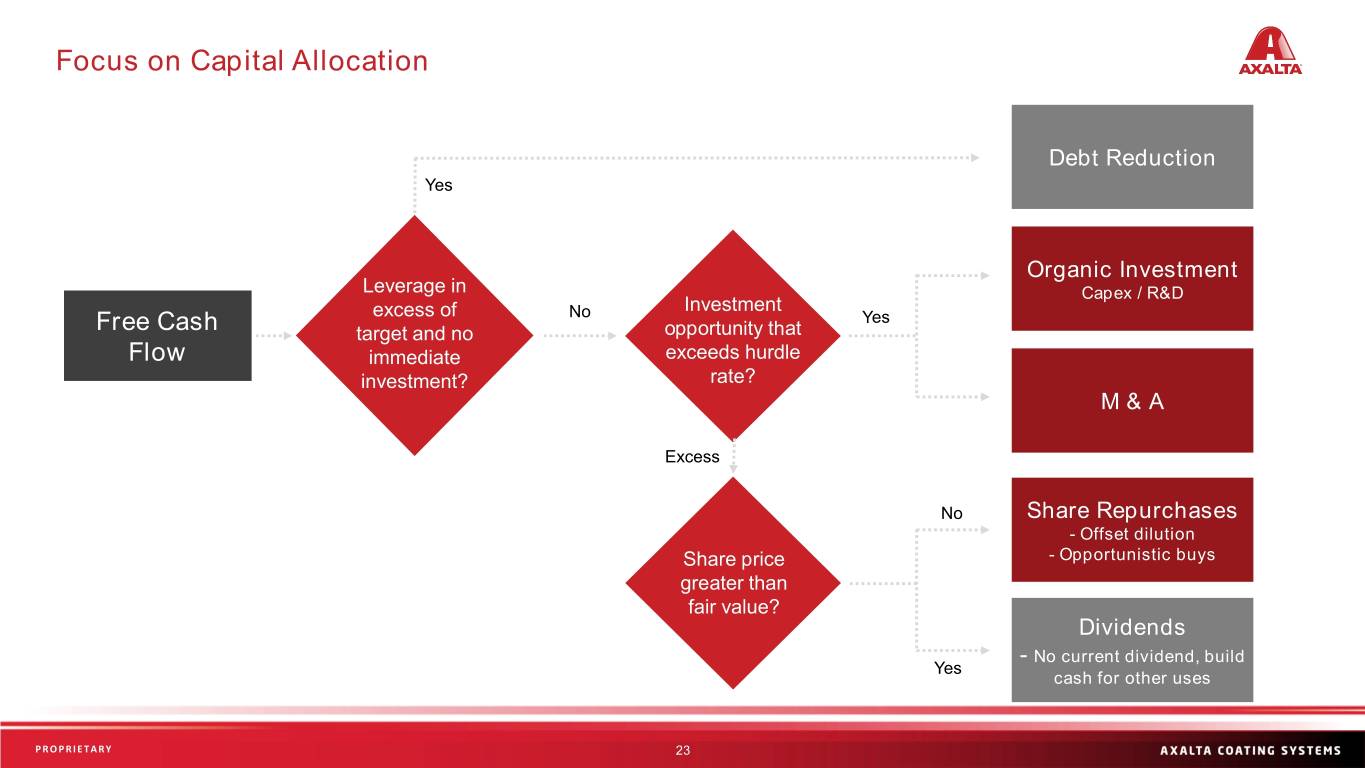
Focus on Capital Allocation Debt Reduction Yes Organic Investment Leverage in Capex / R&D Investment excess of No Yes Free Cash target and no opportunity that Flow immediate exceeds hurdle investment? rate? M & A Excess No Share Repurchases - Offset dilution Share price - Opportunistic buys greater than fair value? Dividends - No current dividend, build Yes cash for other uses PROPRIETARY Sensitivity: Business Internal 23
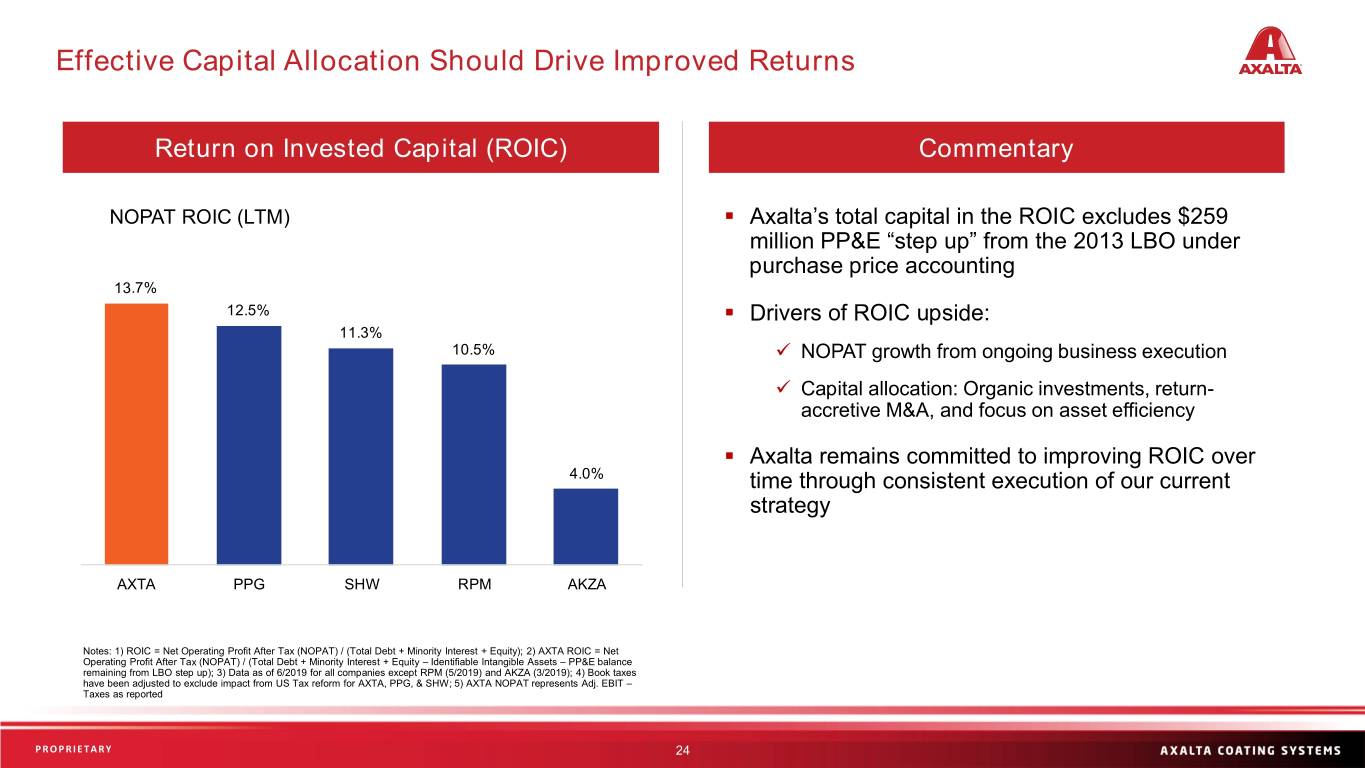
Effective Capital Allocation Should Drive Improved Returns Return on Invested Capital (ROIC) Commentary NOPAT ROIC (LTM) ▪ Axalta’s total capital in the ROIC excludes $259 million PP&E “step up” from the 2013 LBO under purchase price accounting 13.7% 12.5% ▪ Drivers of ROIC upside: 11.3% 10.5% ✓ NOPAT growth from ongoing business execution ✓ Capital allocation: Organic investments, return- accretive M&A, and focus on asset efficiency ▪ Axalta remains committed to improving ROIC over 4.0% time through consistent execution of our current strategy AXTA PPG SHW RPM AKZA Notes: 1) ROIC = Net Operating Profit After Tax (NOPAT) / (Total Debt + Minority Interest + Equity); 2) AXTA ROIC = Net Operating Profit After Tax (NOPAT) / (Total Debt + Minority Interest + Equity – Identifiable Intangible Assets – PP&E balance remaining from LBO step up); 3) Data as of 6/2019 for all companies except RPM (5/2019) and AKZA (3/2019); 4) Book taxes have been adjusted to exclude impact from US Tax reform for AXTA, PPG, & SHW; 5) AXTA NOPAT represents Adj. EBIT – Taxes as reported PROPRIETARY Sensitivity: Business Internal 24
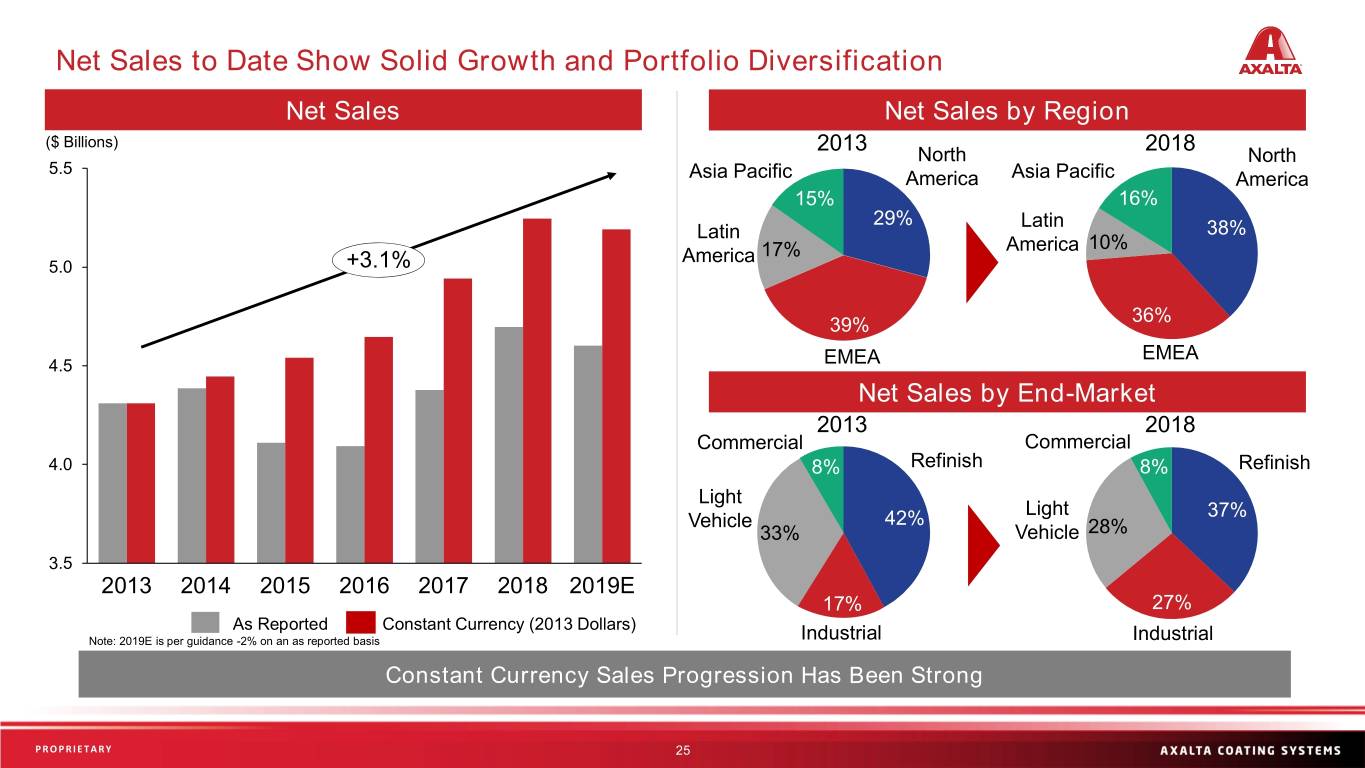
Net Sales to Date Show Solid Growth and Portfolio Diversification Net Sales Net Sales by Region ($ Billions) 2013 2018 North North 5.5 Asia Pacific America Asia Pacific America 15% 16% 29% Latin Latin 38% America 10% America 17% 5.0 +3.1% 39% 36% EMEA 4.5 EMEA Net Sales by End-Market 2013 2018 Commercial Commercial 4.0 8% Refinish 8% Refinish Light Light 37% Vehicle 42% 33% Vehicle 28% 3.5 2013 2014 2015 2016 2017 2018 2019E 17% 27% As Reported Constant Currency (2013 Dollars) Note: 2019E is per guidance -2% on an as reported basis Industrial Industrial Constant Currency Sales Progression Has Been Strong PROPRIETARY Sensitivity: Business Internal 25
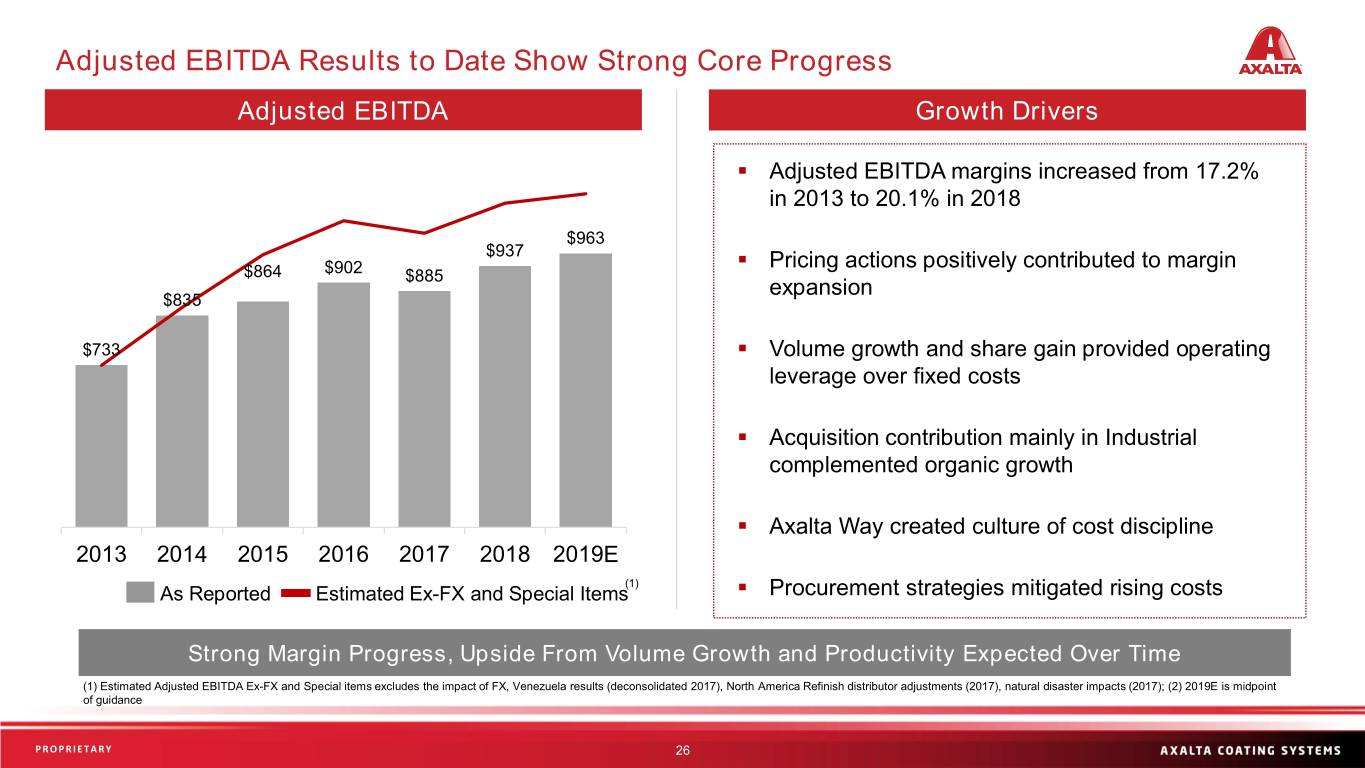
Adjusted EBITDA Results to Date Show Strong Core Progress Adjusted EBITDA Growth Drivers ▪ Adjusted EBITDA margins increased from 17.2% in 2013 to 20.1% in 2018 $963 $937 ▪ Pricing actions positively contributed to margin $864 $902 $885 expansion $835 $733 ▪ Volume growth and share gain provided operating leverage over fixed costs. ▪ Acquisition contribution mainly in Industrial complemented organic growth ▪ Axalta Way created culture of cost discipline 2013 2014 2015 2016 2017 2018 2019E (1) As Reported Estimated Ex-FX and Special Items ▪ Procurement strategies mitigated rising costs Strong Margin Progress, Upside From Volume Growth and Productivity Expected Over Time (1) Estimated Adjusted EBITDA Ex-FX and Special items excludes the impact of FX, Venezuela results (deconsolidated 2017), North America Refinish distributor adjustments (2017), natural disaster impacts (2017); (2) 2019E is midpoint of guidance PROPRIETARY Sensitivity: Business Internal 26
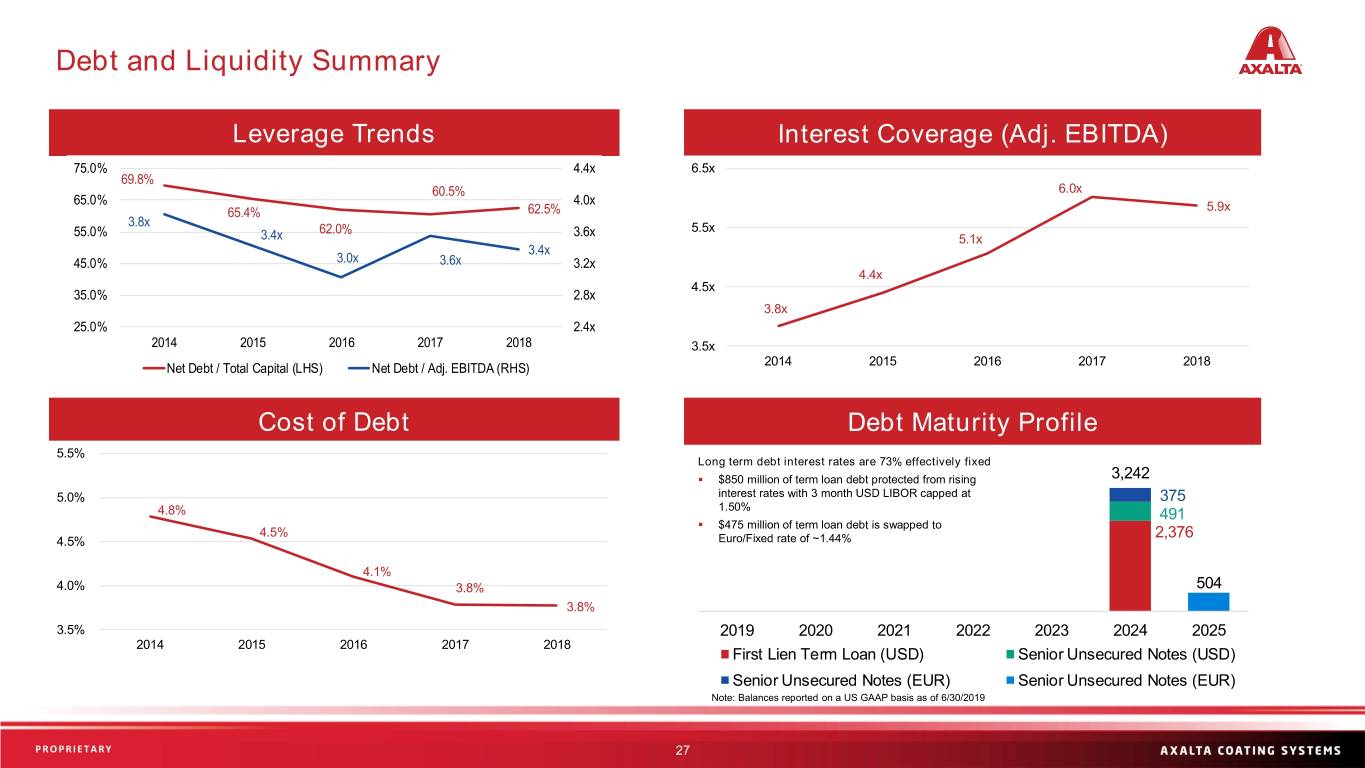
Debt and Liquidity Summary Leverage Trends Interest Coverage (Adj. EBITDA) 75.0% 4.4x 6.5x 69.8% 60.5% 6.0x 65.0% 4.0x 65.4% 62.5% 5.9x 3.8x 55.0% 62.0% 3.6x 5.5x 3.4x 5.1x 3.4x 45.0% 3.0x 3.6x 3.2x 4.4x 4.5x 35.0% 2.8x 3.8x 25.0% 2.4x 2014 2015 2016 2017 2018 3.5x 2014 2015 2016 2017 2018 Net Debt / Total Capital (LHS) Net Debt / Adj. EBITDA (RHS) Cost of Debt Debt Maturity Profile 5.5% Long term debt interest rates are 73% effectively fixed ▪ $850 million of term loan debt protected from rising 3,242 5.0% interest rates with 3 month USD LIBOR capped at 375 4.8% 1.50% 491 ▪ $475 million of term loan debt is swapped to 4.5% 2,376 4.5% Euro/Fixed rate of ~1.44% 4.1% 4.0% 3.8% 504 3.8% 3.5% 2019 2020 2021 2022 2023 2024 2025 2014 2015 2016 2017 2018 First Lien Term Loan (USD) Senior Unsecured Notes (USD) Senior Unsecured Notes (EUR) Senior Unsecured Notes (EUR) Note: Balances reported on a US GAAP basis as of 6/30/2019 PROPRIETARY Sensitivity: Business Internal 27
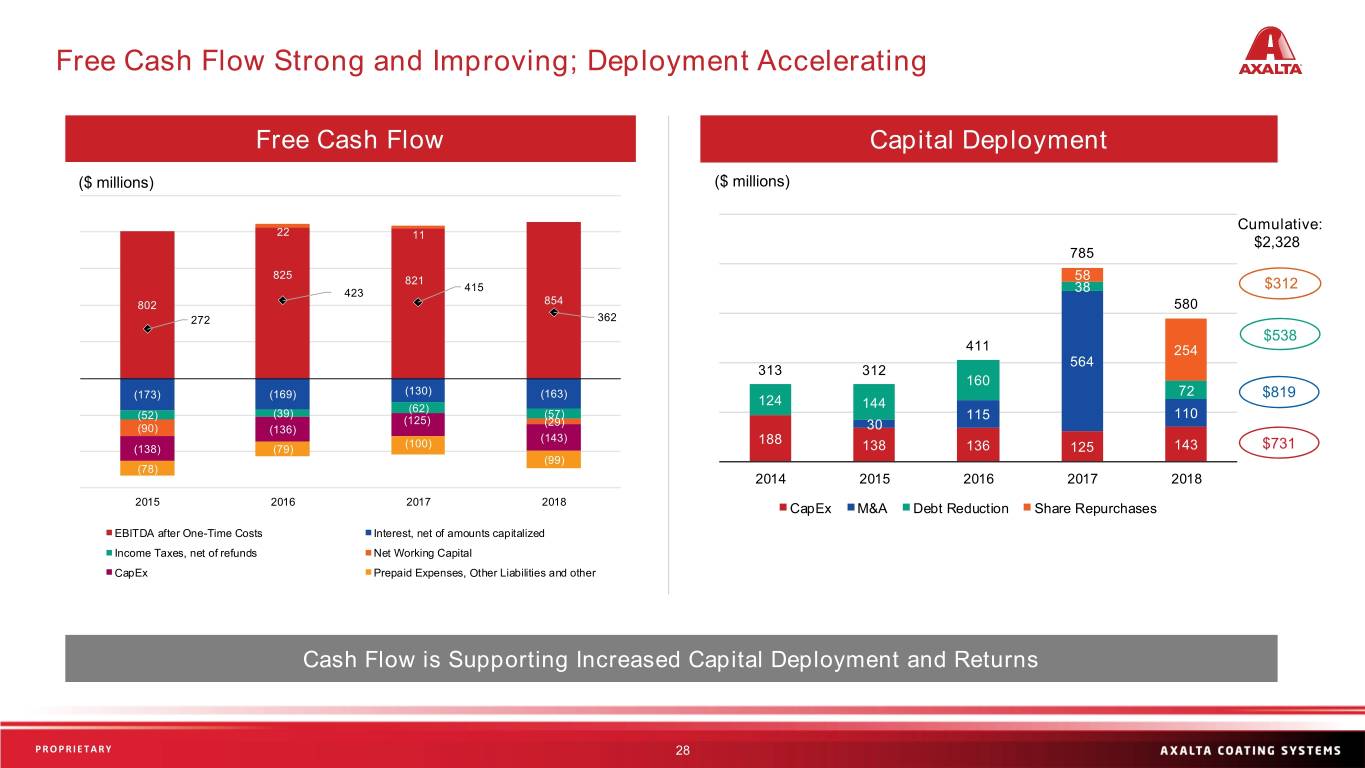
Free Cash Flow Strong and Improving; Deployment Accelerating Free Cash Flow Capital Deployment ($ millions) ($ millions) Cumulative: 22 11 $2,328 785 825 821 58 415 $312 423 38 802 854 580 272 362 $538 411 254 564 313 312 160 (130) (163) 72 $819 (173) (169) 124 (62) 144 (52) (39) (57) 115 110 (125) (29) (90) (136) 30 (143) (100) 188 (138) (79) 138 136 125 143 $731 (99) (78) 2014 2015 2016 2017 2018 2015 2016 2017 2018 CapEx M&A Debt Reduction Share Repurchases EBITDA after One-Time Costs Interest, net of amounts capitalized Income Taxes, net of refunds Net Working Capital CapEx Prepaid Expenses, Other Liabilities and other Cash Flow is Supporting Increased Capital Deployment and Returns PROPRIETARY Sensitivity: Business Internal 28
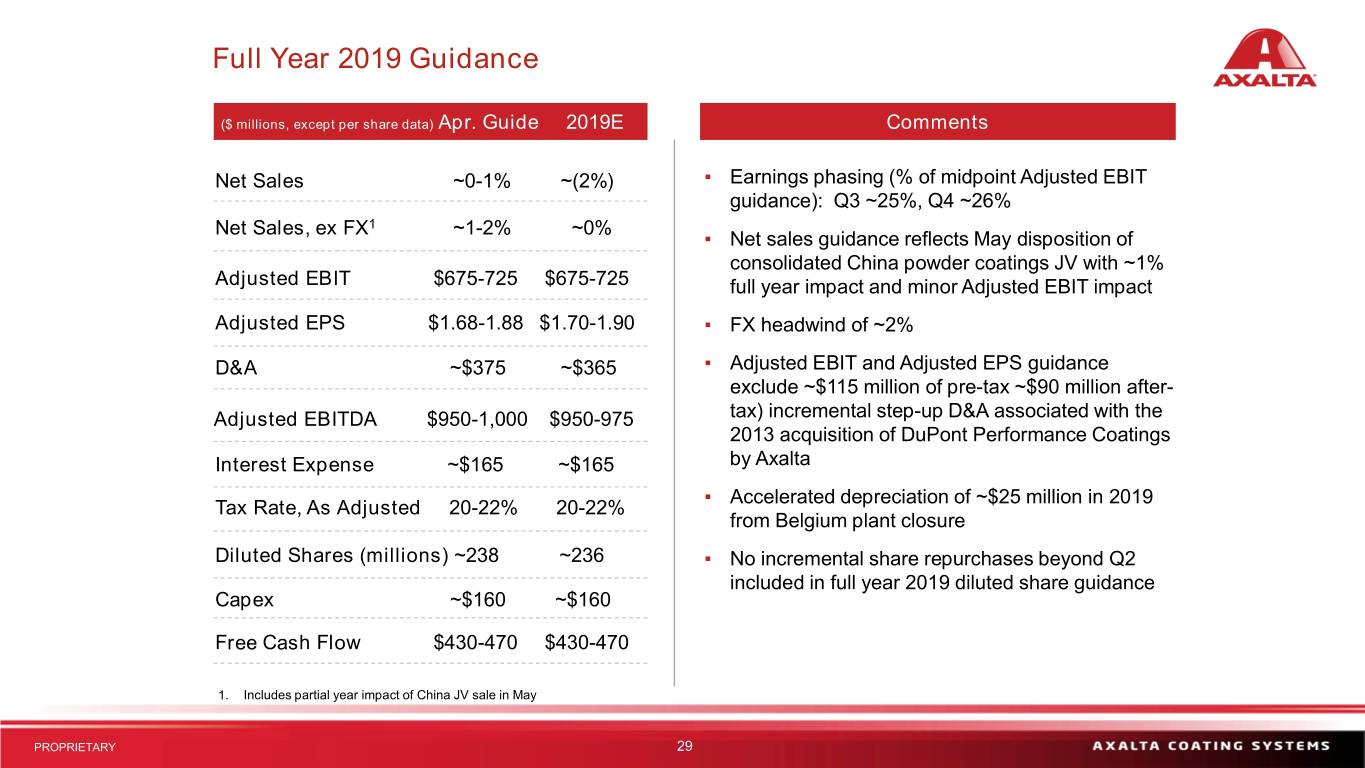
Full Year 2019 Guidance ($ millions, except per share data) Apr. Guide 2019E Comments Net Sales ~0-1% ~(2%) ▪ Earnings phasing (% of midpoint Adjusted EBIT guidance): Q3 ~25%, Q4 ~26% Net Sales, ex FX1 ~1-2% ~0% ▪ Net sales guidance reflects May disposition of consolidated China powder coatings JV with ~1% Adjusted EBIT $675-725 $675-725 full year impact and minor Adjusted EBIT impact Adjusted EPS $1.68-1.88 $1.70-1.90 ▪ FX headwind of ~2% D&A ~$375 ~$365 ▪ Adjusted EBIT and Adjusted EPS guidance exclude ~$115 million of pre-tax ~$90 million after- Adjusted EBITDA $950-1,000 $950-975 tax) incremental step - up D&A associated with the 2013 acquisition of DuPont Performance Coatings Interest Expense ~$165 ~$165 by Axalta ▪ Accelerated depreciation of ~$25 million in 2019 Tax Rate, As Adjusted 20-22% 20-22% from Belgium plant closure Diluted Shares (millions) ~238 ~236 ▪ No incremental share repurchases beyond Q2 included in full year 2019 diluted share guidance Capex ~$160 ~$160 Free Cash Flow $430-470 $430-470 1. Includes partial year impact of China JV sale in May PROPRIETARY 29 Sensitivity: Business Internal
Performance Coatings: Refinish Sensitivity: Business Internal
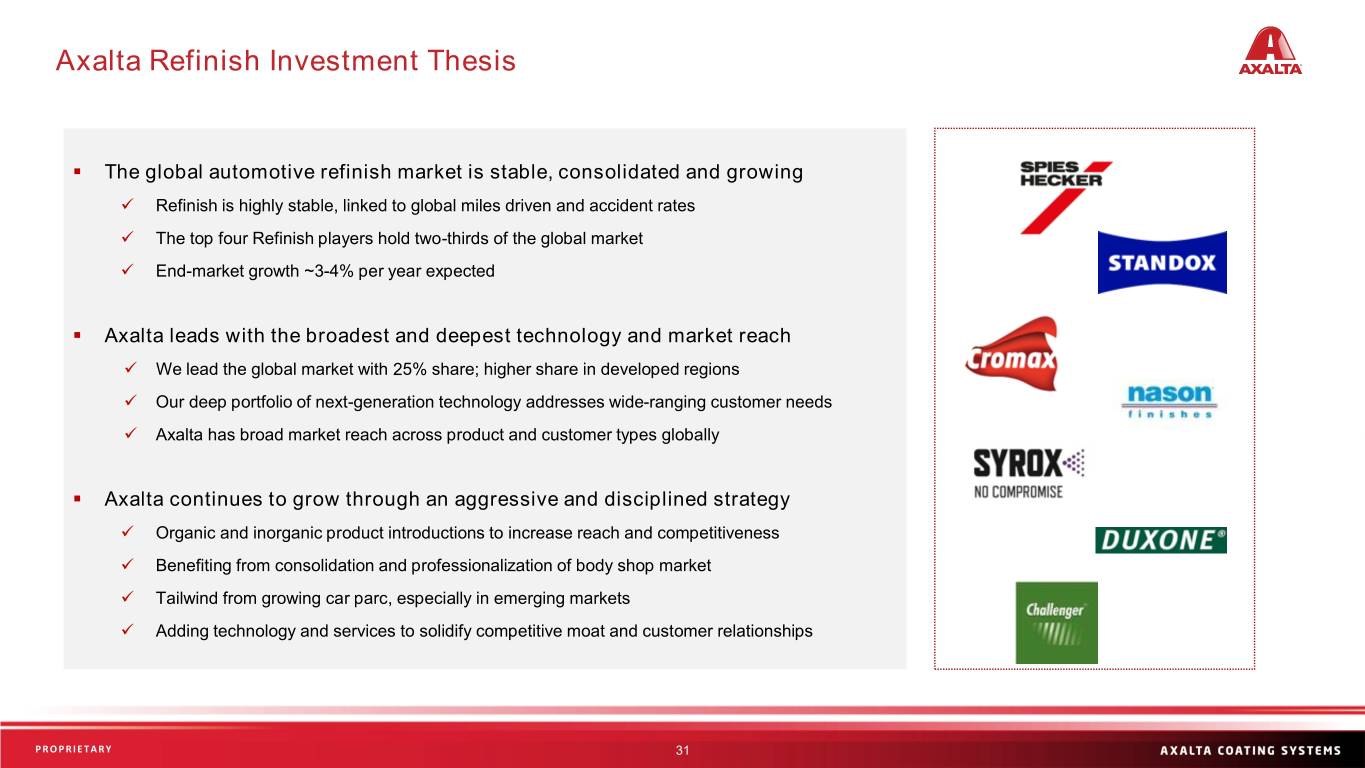
Axalta Refinish Investment Thesis ▪ The global automotive refinish market is stable, consolidated and growing ✓ Refinish is highly stable, linked to global miles driven and accident rates ✓ The top four Refinish players hold two-thirds of the global market ✓ End-market growth ~3-4% per year expected ▪ Axalta leads with the broadest and deepest technology and market reach ✓ We lead the global market with 25% share; higher share in developed regions ✓ Our deep portfolio of next-generation technology addresses wide-ranging customer needs ✓ Axalta has broad market reach across product and customer types globally ▪ Axalta continues to grow through an aggressive and disciplined strategy ✓ Organic and inorganic product introductions to increase reach and competitiveness ✓ Benefiting from consolidation and professionalization of body shop market ✓ Tailwind from growing car parc, especially in emerging markets ✓ Adding technology and services to solidify competitive moat and customer relationships PROPRIETARY Sensitivity: Business Internal 31
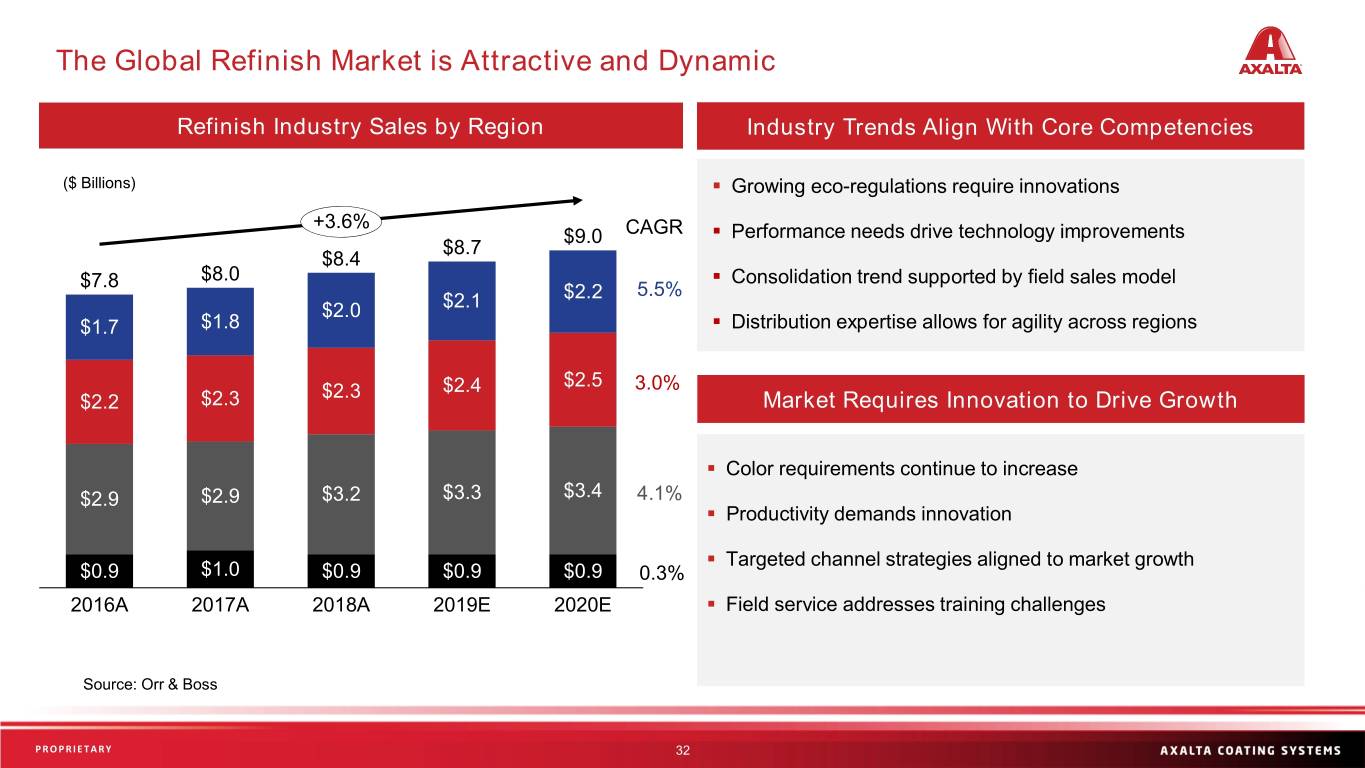
The Global Refinish Market is Attractive and Dynamic Refinish Industry Sales by Region Industry Trends Align With Core Competencies ($ Billions) ▪ Growing eco-regulations require innovations +3.6% $9.0 CAGR ▪ Performance needs drive technology improvements $8.7 $8.4 $7.8 $8.0 ▪ Consolidation trend supported by field sales model $2.2 5.5% $2.0 $2.1 $1.7 $1.8 ▪ Distribution expertise allows for agility across regions $2.5 $2.3 $2.4 3.0% $2.2 $2.3 Market Requires Innovation to Drive Growth ▪ Color requirements continue to increase $2.9 $2.9 $3.2 $3.3 $3.4 4.1% ▪ Productivity demands innovation ▪ Targeted channel strategies aligned to market growth $0.9 $1.0 $0.9 $0.9 $0.9 0.3% 2016A 2017A 2018A 2019E 2020E ▪ Field service addresses training challenges Source: Orr & Boss PROPRIETARY Sensitivity: Business Internal 32
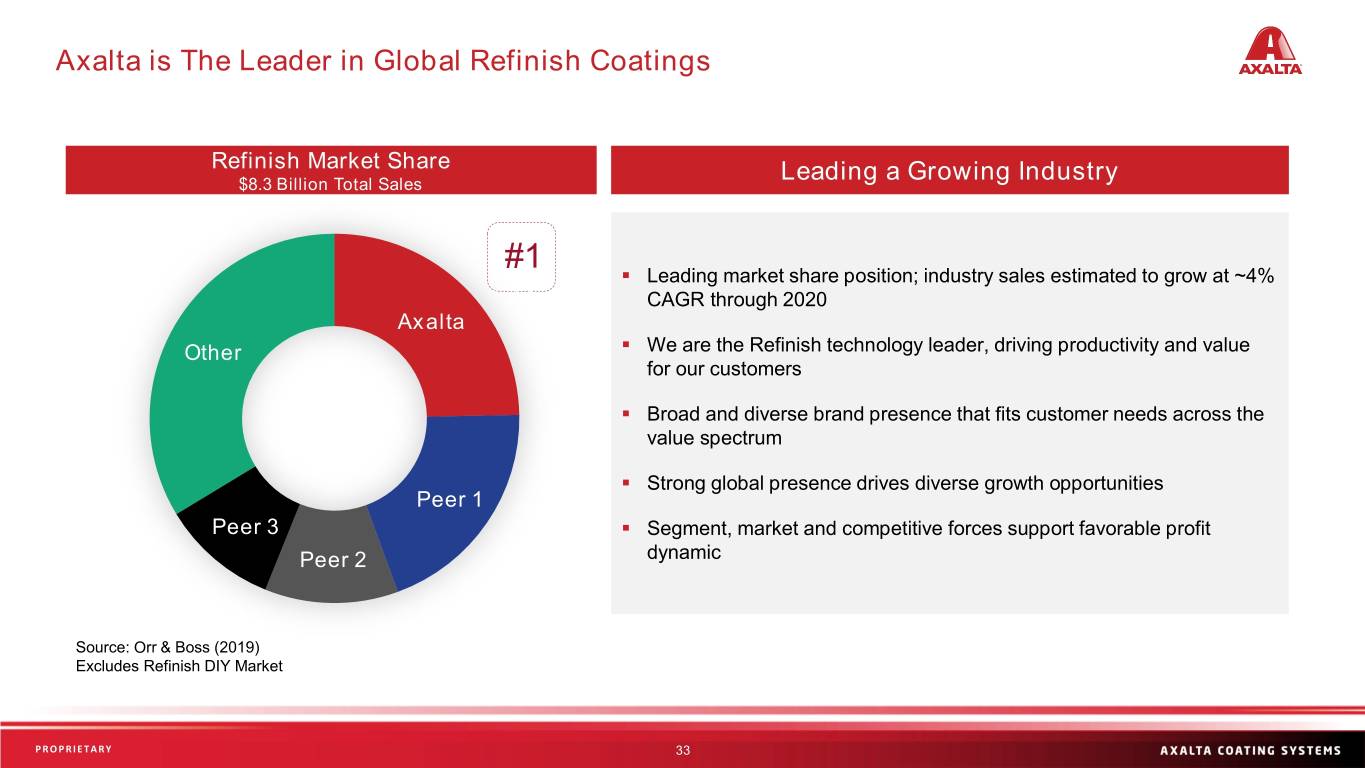
Axalta is The Leader in Global Refinish Coatings Refinish Market Share Leading a Growing Industry $8.3 Billion Total Sales #1 ▪ Leading market share position; industry sales estimated to grow at ~4% #1 CAGR through 2020 Axalta Other ▪ We are the Refinish technology leader, driving productivity and value for our customers ▪ Broad and diverse brand presence that fits customer needs across the value spectrum ▪ Strong global presence drives diverse growth opportunities Peer 1 Peer 3 ▪ Segment, market and competitive forces support favorable profit Peer 2 dynamic Source: Orr & Boss (2019) Excludes Refinish DIY Market PROPRIETARY Sensitivity: Business Internal 33
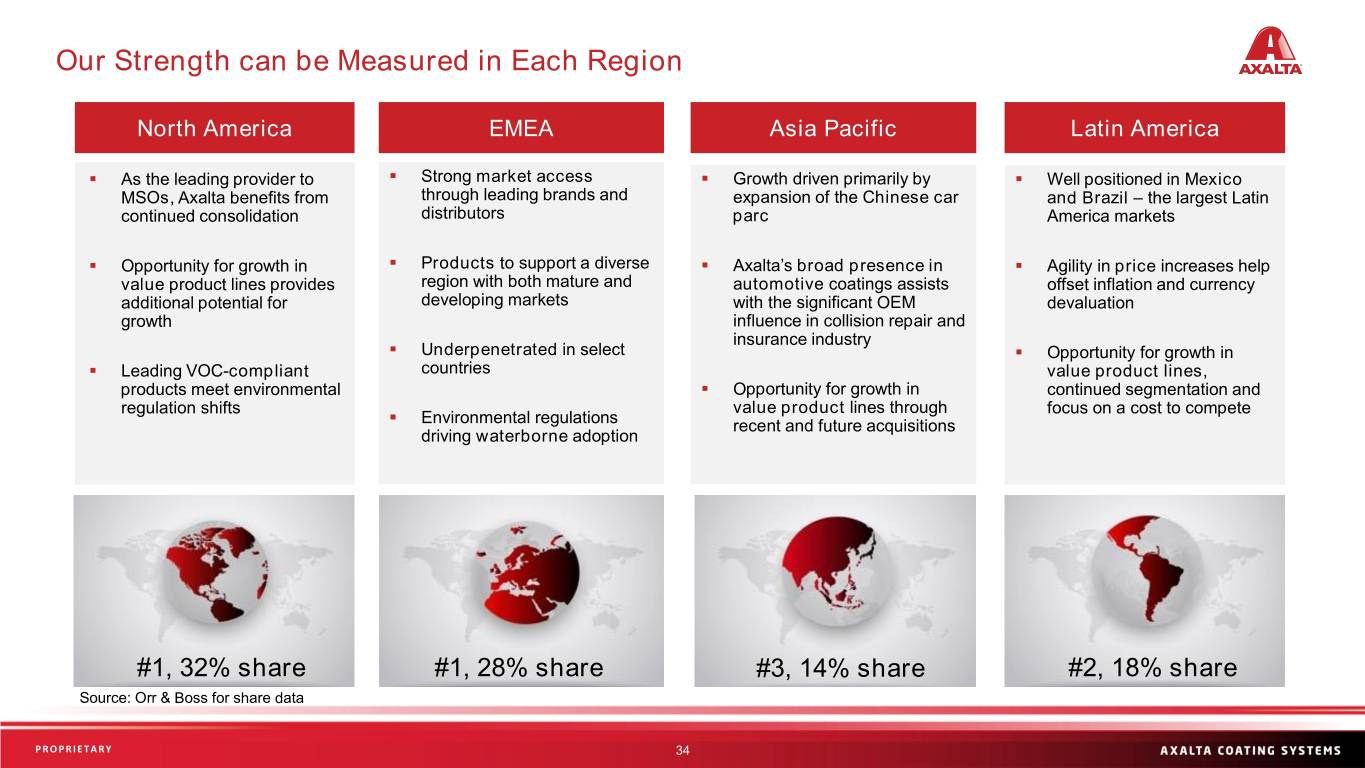
Our Strength can be Measured in Each Region North America EMEA Asia Pacific Latin America ▪ As the leading provider to ▪ Strong market access ▪ Growth driven primarily by ▪ Well positioned in Mexico MSOs, Axalta benefits from through leading brands and expansion of the Chinese car and Brazil – the largest Latin continued consolidation distributors parc America markets ▪ Opportunity for growth in ▪ Products to support a diverse ▪ Axalta’s broad presence in ▪ Agility in price increases help value product lines provides region with both mature and automotive coatings assists offset inflation and currency additional potential for developing markets with the significant OEM devaluation growth influence in collision repair and insurance industry ▪ Underpenetrated in select ▪ Opportunity for growth in ▪ Leading VOC-compliant countries value product lines, products meet environmental ▪ Opportunity for growth in continued segmentation and regulation shifts value product lines through focus on a cost to compete ▪ Environmental regulations recent and future acquisitions driving waterborne adoption #1, 32% share #1, 28% share #3, 14% share #2, 18% share Source: Orr & Boss for share data PROPRIETARY Sensitivity: Business Internal 34
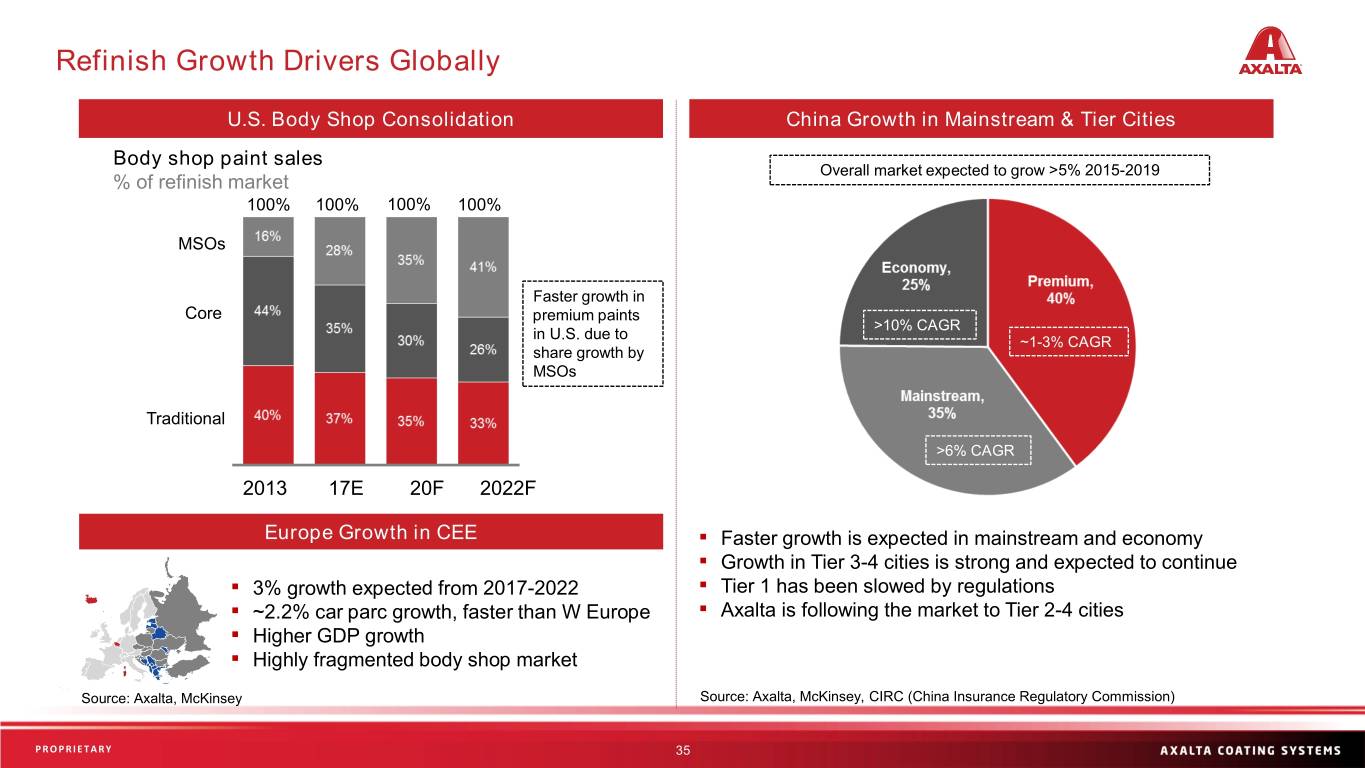
Refinish Growth Drivers Globally U.S. Body Shop Consolidation China Growth in Mainstream & Tier Cities Body shop paint sales Overall market expected to grow >5% 2015-2019 % of refinish market 100% 100% 100% 100% MSOs Faster growth in Core premium paints >10% CAGR in U.S. due to ~1-3% CAGR share growth by MSOs Traditional >6% CAGR 2013 17E 20F 2022F Europe Growth in CEE ▪ Faster growth is expected in mainstream and economy ▪ Growth in Tier 3-4 cities is strong and expected to continue ▪ 3% growth expected from 2017-2022 ▪ Tier 1 has been slowed by regulations ▪ ~2.2% car parc growth, faster than W Europe ▪ Axalta is following the market to Tier 2-4 cities ▪ Higher GDP growth ▪ Highly fragmented body shop market Source: Axalta, McKinsey Source: Axalta, McKinsey, CIRC (China Insurance Regulatory Commission) PROPRIETARY Sensitivity: Business Internal 35
Performance Coatings: Industrial Sensitivity: Business Internal
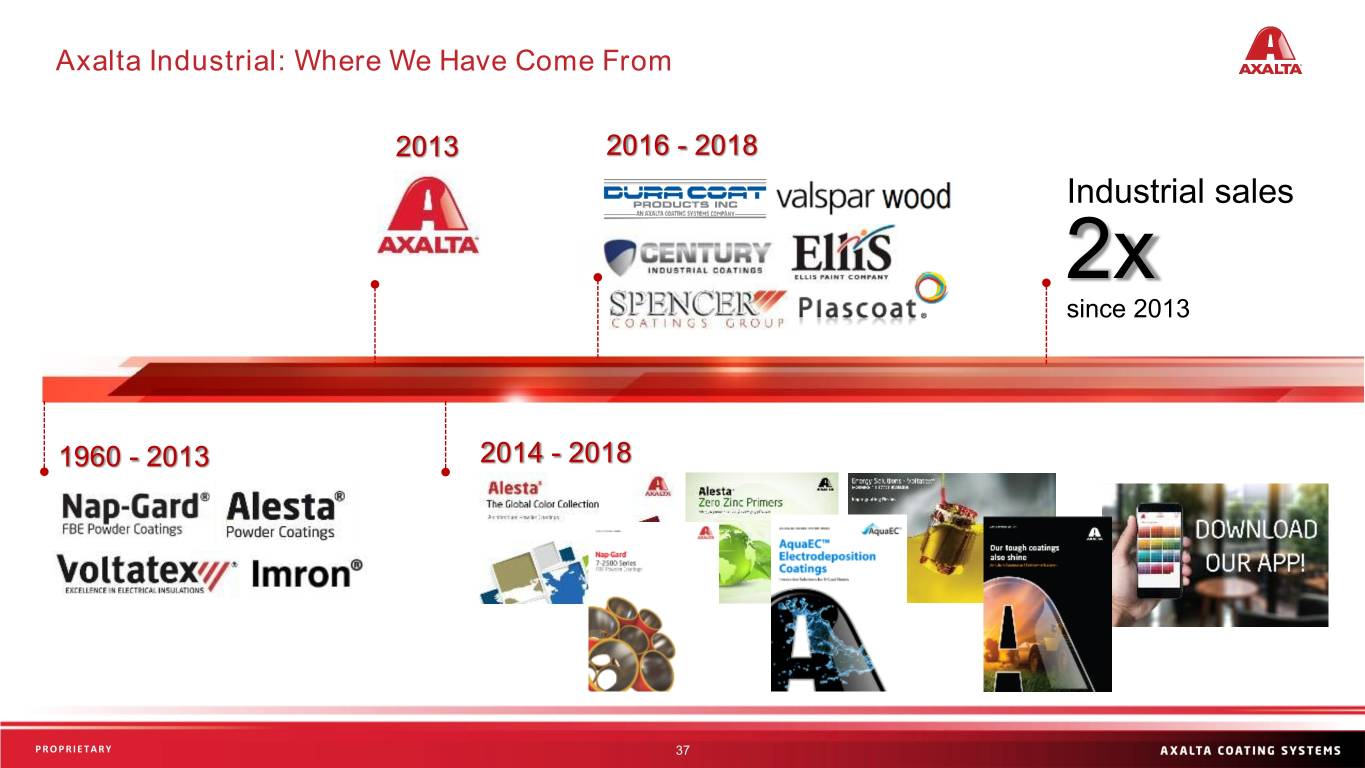
Axalta Industrial: Where We Have Come From 2013 2016 - 2018 Industrial sales 2x since 2013 1960 - 2013 2014 - 2018 PROPRIETARY Sensitivity: Business Internal 37
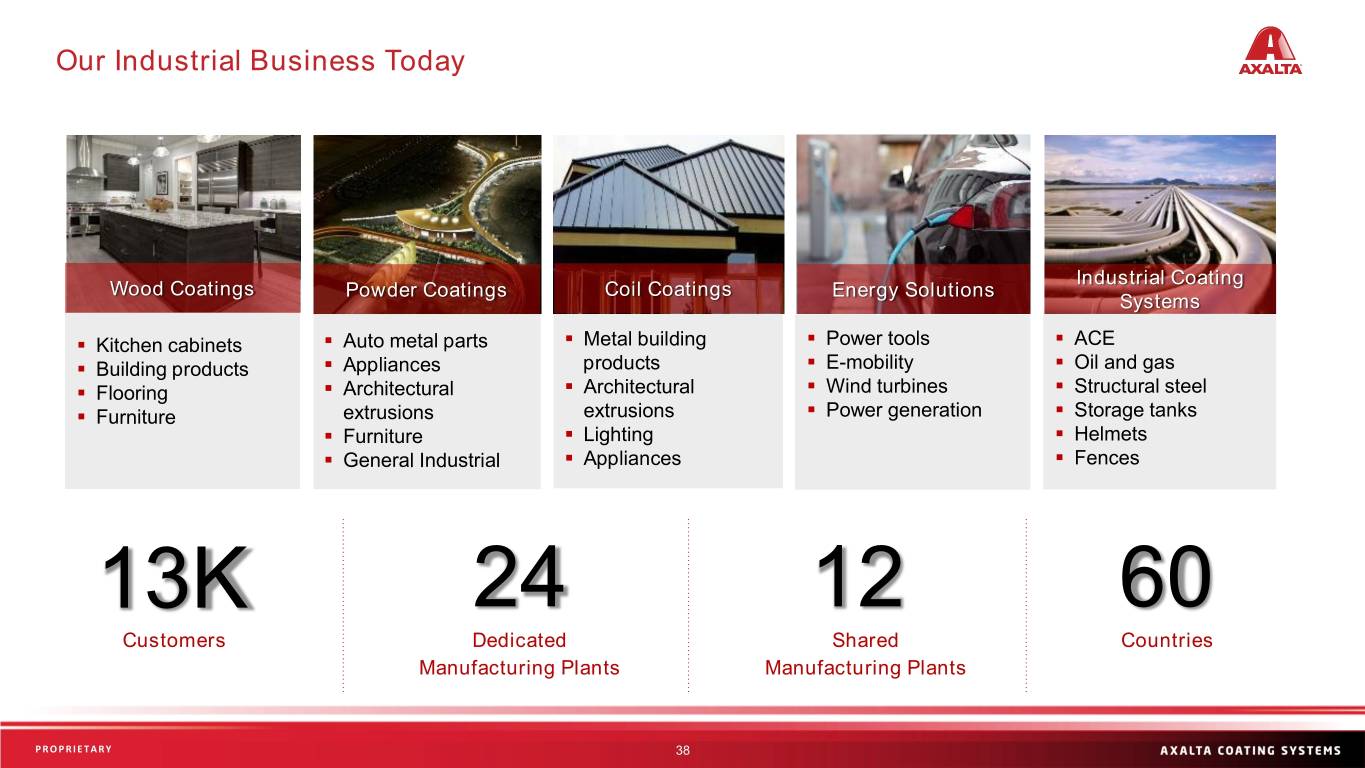
Our Industrial Business Today Industrial Coating Wood Coatings Powder Coatings Coil Coatings Energy Solutions Systems ▪ Kitchen cabinets ▪ Auto metal parts ▪ Metal building ▪ Power tools ▪ ACE ▪ Building products ▪ Appliances products ▪ E-mobility ▪ Oil and gas ▪ Flooring ▪ Architectural ▪ Architectural ▪ Wind turbines ▪ Structural steel ▪ Furniture extrusions extrusions ▪ Power generation ▪ Storage tanks ▪ Furniture ▪ Lighting ▪ Helmets ▪ General Industrial ▪ Appliances ▪ Fences 13K 24 12 60 Customers Dedicated Shared Countries Manufacturing Plants Manufacturing Plants PROPRIETARY Sensitivity: Business Internal 38
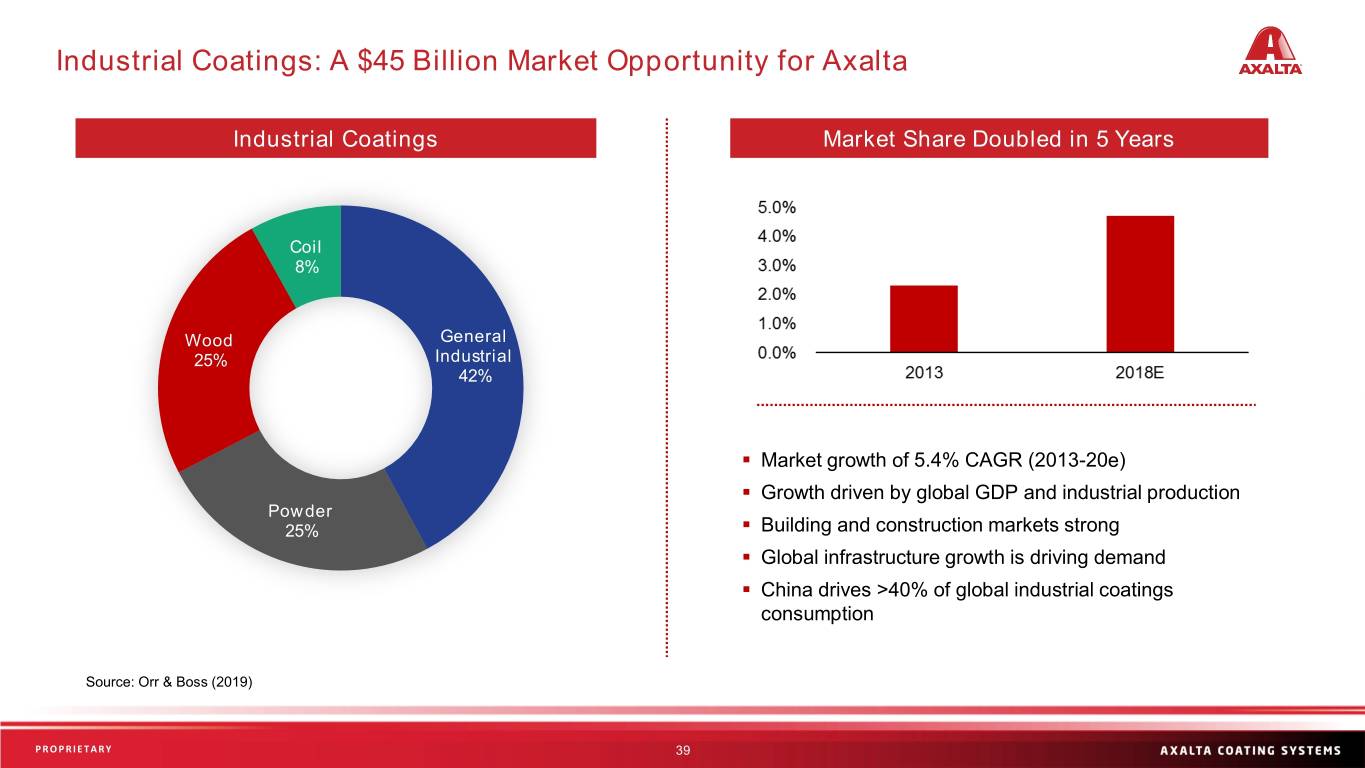
Industrial Coatings: A $45 Billion Market Opportunity for Axalta Industrial Coatings Market Share Doubled in 5 Years Coil 8% Wood General 25% Industrial 42% ▪ Market growth of 5.4% CAGR (2013-20e) ▪ Growth driven by global GDP and industrial production Powder 25% ▪ Building and construction markets strong ▪ Global infrastructure growth is driving demand ▪ China drives >40% of global industrial coatings consumption Source: Orr & Boss (2019) PROPRIETARY Sensitivity: Business Internal 39
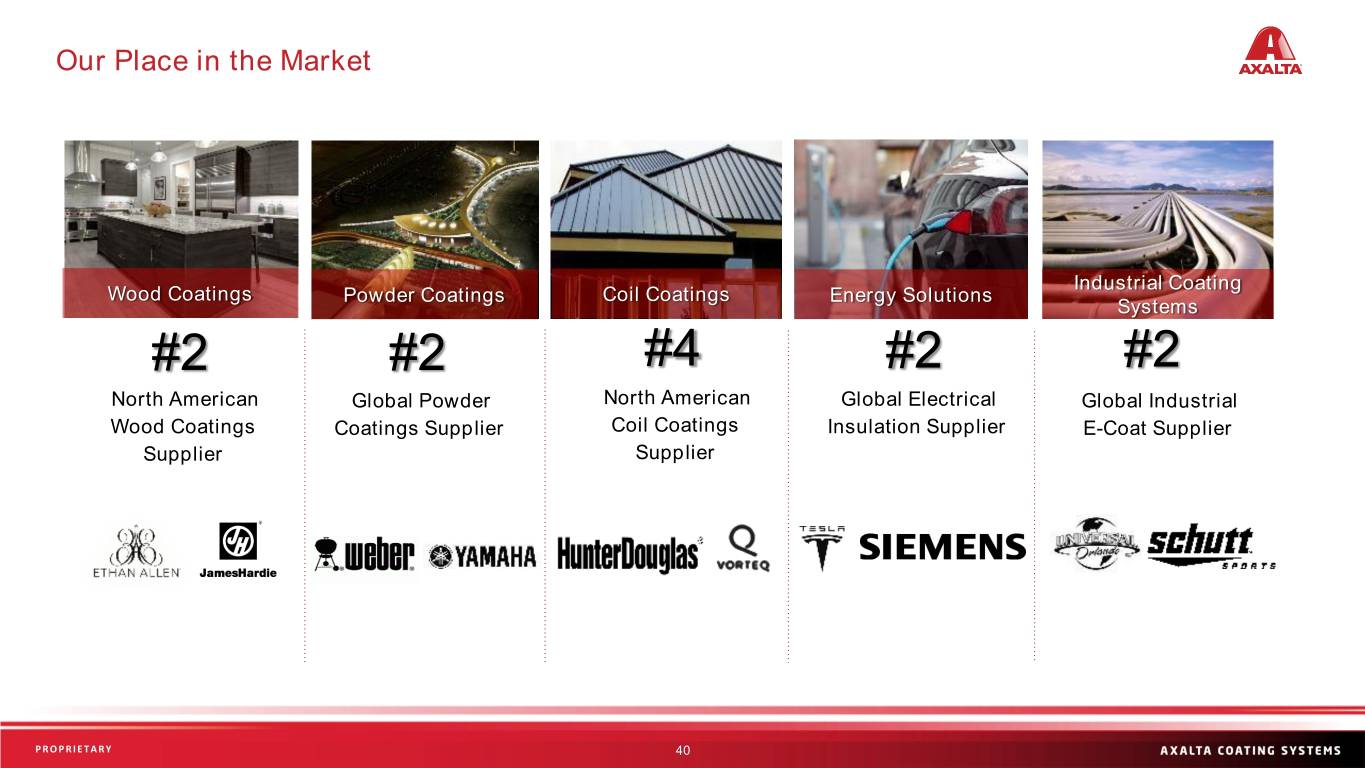
Our Place in the Market Industrial Coating Wood Coatings Powder Coatings Coil Coatings Energy Solutions Systems #2 #2 #4 #2 #2 North American Global Powder North American Global Electrical Global Industrial Wood Coatings Coatings Supplier Coil Coatings Insulation Supplier E-Coat Supplier Supplier Supplier PROPRIETARY Sensitivity: Business Internal 40
Transportation Coatings Sensitivity: Business Internal

Transportation Coatings | Segment Overview Transportation Coatings Light Vehicle Synergies Commercial Vehicle ▪ Original Equipment ▪ Commercial truck Manufacturers Market ▪ Rail ▪ Plastic and Drivers composite coatings ▪ Bus ▪ Metal coatings ▪ Utility vehicles Global ▪ Interior coatings ▪ RVs / off-road / OEM pleasure craft ▪ Accessories Alliances ▪ General aviation Focused #2 supplier to Support #1 supplier to light vehicle Models heavy duty truck OEM market and bus markets PROPRIETARY Sensitivity: Business Internal 42
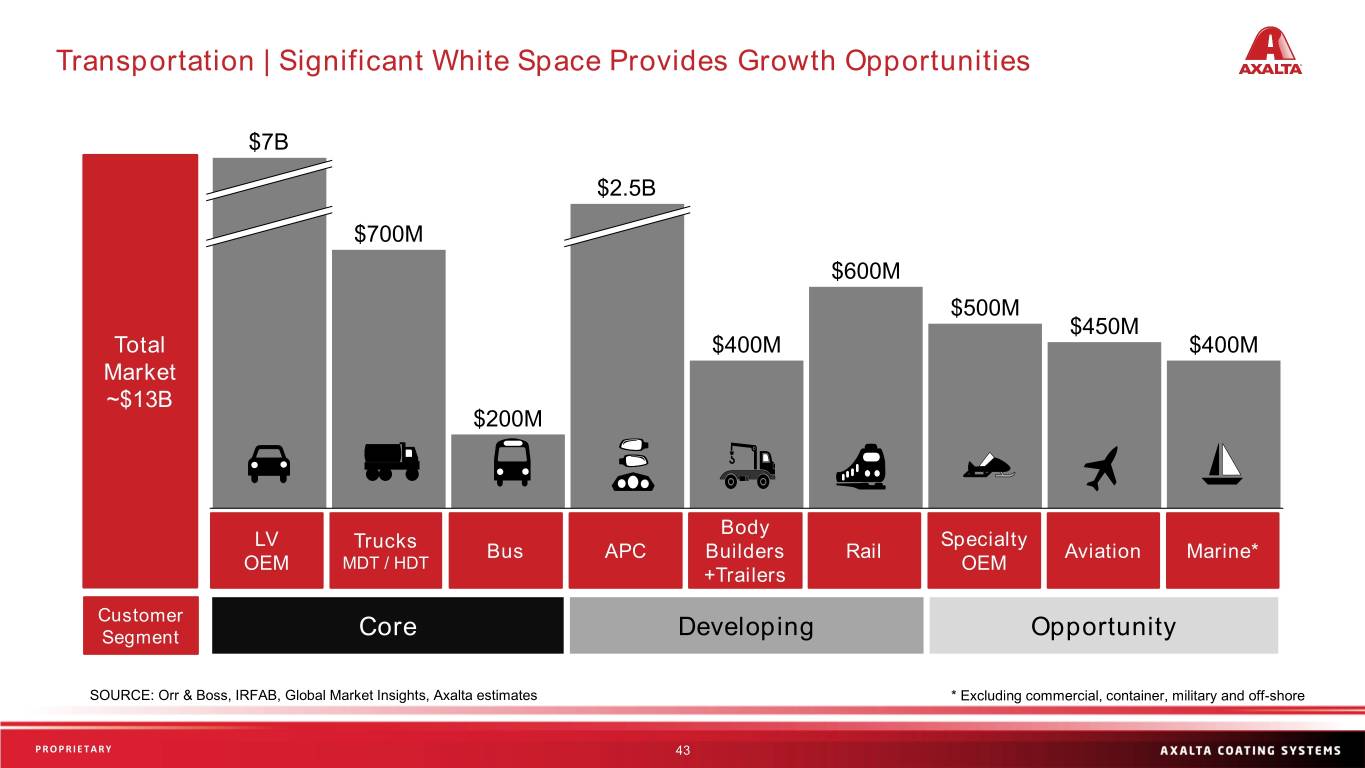
Transportation | Significant White Space Provides Growth Opportunities $7B ~ $2.5B $700M $600M $500M $450M Total $400M $400M Market ~$13B $200M Body LV Trucks Specialty Bus APC Builders Rail Aviation Marine* OEM MDT / HDT OEM +Trailers Customer Segment Core Developing Opportunity SOURCE: Orr & Boss, IRFAB, Global Market Insights, Axalta estimates * Excluding commercial, container, military and off-shore PROPRIETARY Sensitivity: Business Internal 43
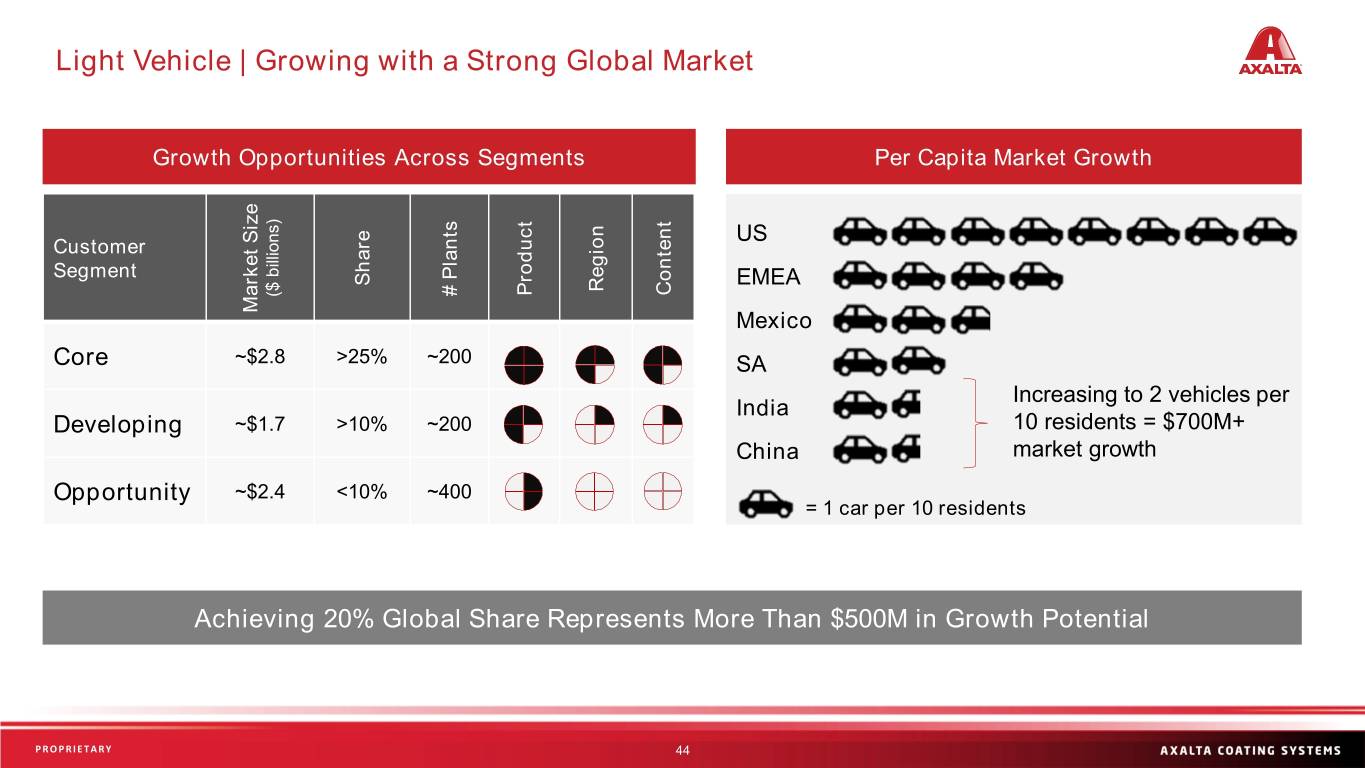
Light Vehicle | Growing with a Strong Global Market Growth Opportunities Across Segments Per Capita Market Growth US Customer Segment Share EMEA Region Content Product # Plants # ($ billions) ($ Market Size Market Mexico Core ~$2.8 >25% ~200 SA Increasing to 2 vehicles per India Developing ~$1.7 >10% ~200 10 residents = $700M+ China market growth Opportunity ~$2.4 <10% ~400 = 1 car per 10 residents Achieving 20% Global Share Represents More Than $500M in Growth Potential PROPRIETARY Sensitivity: Business Internal 44
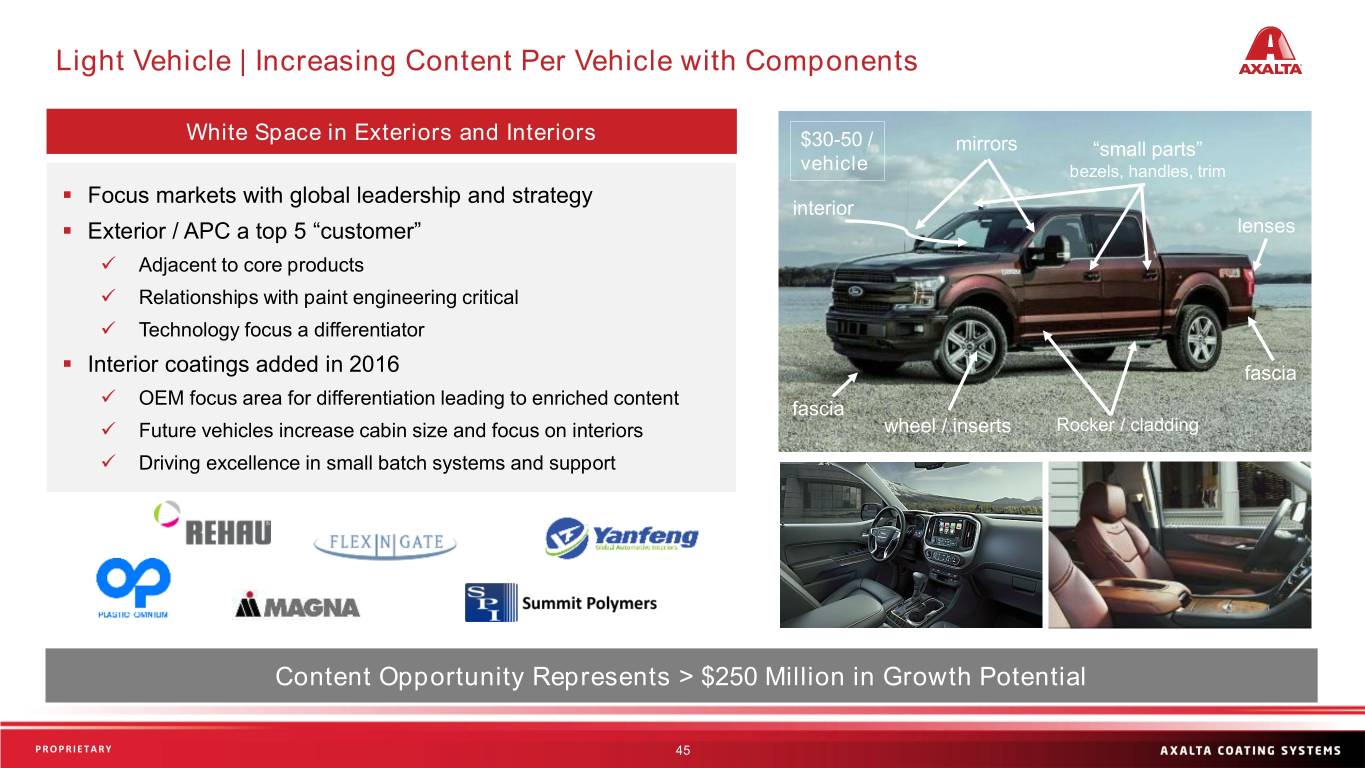
Light Vehicle | Increasing Content Per Vehicle with Components White Space in Exteriors and Interiors $30-50 / mirrors “small parts” vehicle bezels, handles, trim ▪ Focus markets with global leadership and strategy interior ▪ Exterior / APC a top 5 “customer” lenses ✓ Adjacent to core products ✓ Relationships with paint engineering critical ✓ Technology focus a differentiator ▪ Interior coatings added in 2016 fascia ✓ OEM focus area for differentiation leading to enriched content fascia ✓ Future vehicles increase cabin size and focus on interiors wheel / inserts Rocker / cladding ✓ Driving excellence in small batch systems and support Content Opportunity Represents > $250 Million in Growth Potential PROPRIETARY Sensitivity: Business Internal 45
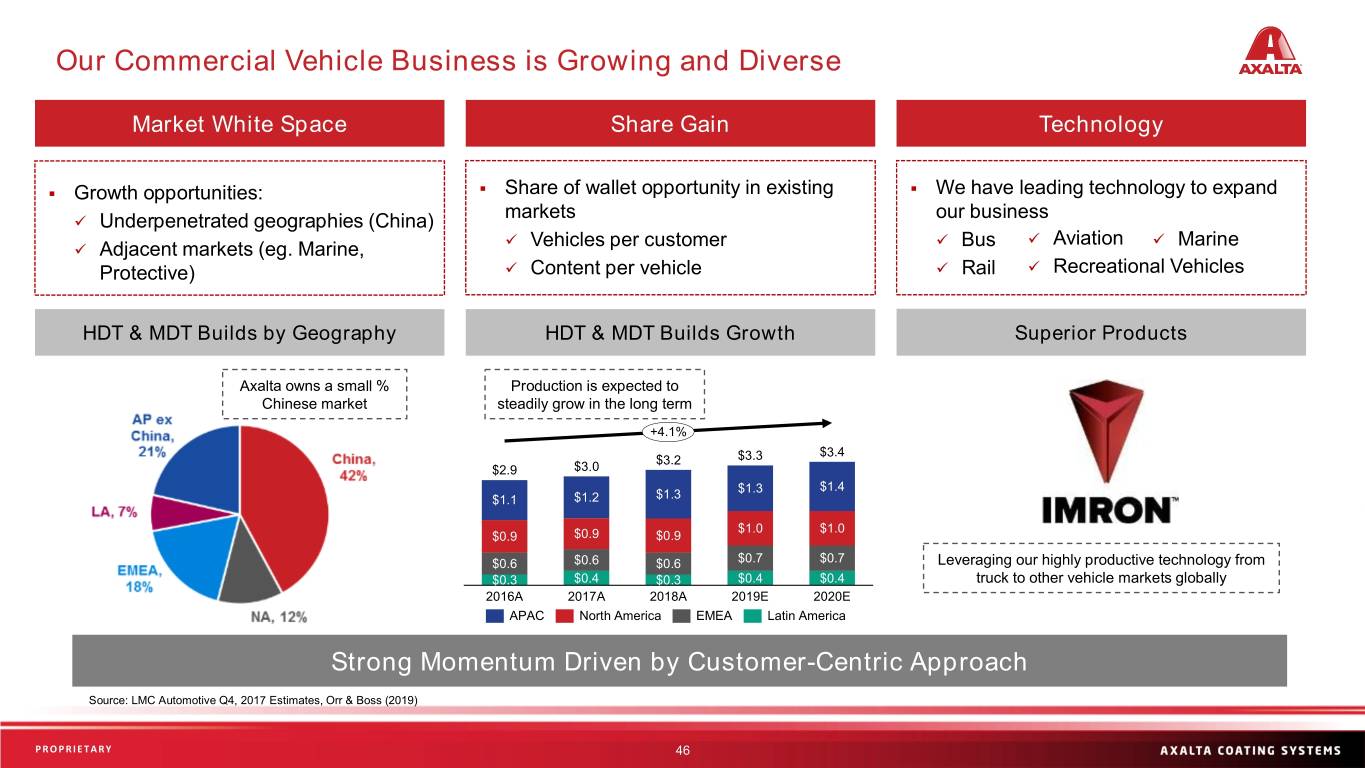
Our Commercial Vehicle Business is Growing and Diverse Market White Space Share Gain Technology ▪ Growth opportunities: ▪ Share of wallet opportunity in existing ▪ We have leading technology to expand markets our business ✓ Underpenetrated geographies (China) ✓ Vehicles per customer ✓ Bus ✓ Aviation ✓ Marine ✓ Adjacent markets (eg. Marine, Protective) ✓ Content per vehicle ✓ Rail ✓ Recreational Vehicles HDT & MDT Builds by Geography HDT & MDT Builds Growth Superior Products Axalta owns a small % Production is expected to Chinese market steadily grow in the long term +4.1% $3.4 $3.2 $3.3 $2.9 $3.0 $1.3 $1.4 $1.1 $1.2 $1.3 $1.0 $1.0 $0.9 $0.9 $0.9 $0.6 $0.6 $0.6 $0.7 $0.7 Leveraging our highly productive technology from $0.3 $0.4 $0.3 $0.4 $0.4 truck to other vehicle markets globally 2016A 2017A 2018A 2019E 2020E APAC North America EMEA Latin America Strong Momentum Driven by Customer-Centric Approach Source: LMC Automotive Q4, 2017 Estimates, Orr & Boss (2019) PROPRIETARY Sensitivity: Business Internal 46
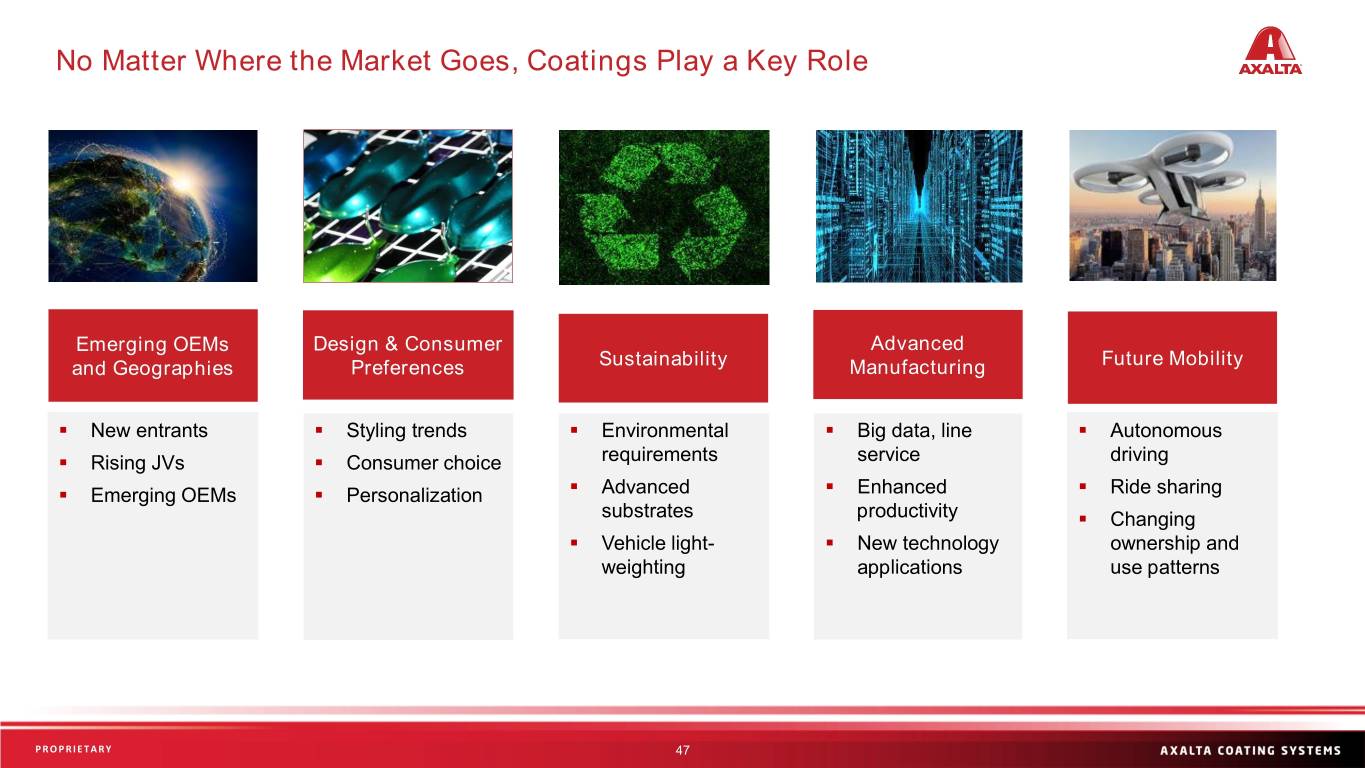
No Matter Where the Market Goes, Coatings Play a Key Role Emerging OEMs Design & Consumer Advanced and Geographies Preferences Sustainability Manufacturing Future Mobility ▪ New entrants ▪ Styling trends ▪ Environmental ▪ Big data, line ▪ Autonomous ▪ Rising JVs ▪ Consumer choice requirements service driving ▪ Emerging OEMs ▪ Personalization ▪ Advanced ▪ Enhanced ▪ Ride sharing substrates productivity ▪ Changing ▪ Vehicle light- ▪ New technology ownership and weighting applications use patterns PROPRIETARY Sensitivity: Business Internal 47
Investor Contact: Chris Mecray - VP, Investor Relations, Treasury & Strategy christopher.mecray@axalta.com (215) 255-7970 Sensitivity: Business Internal
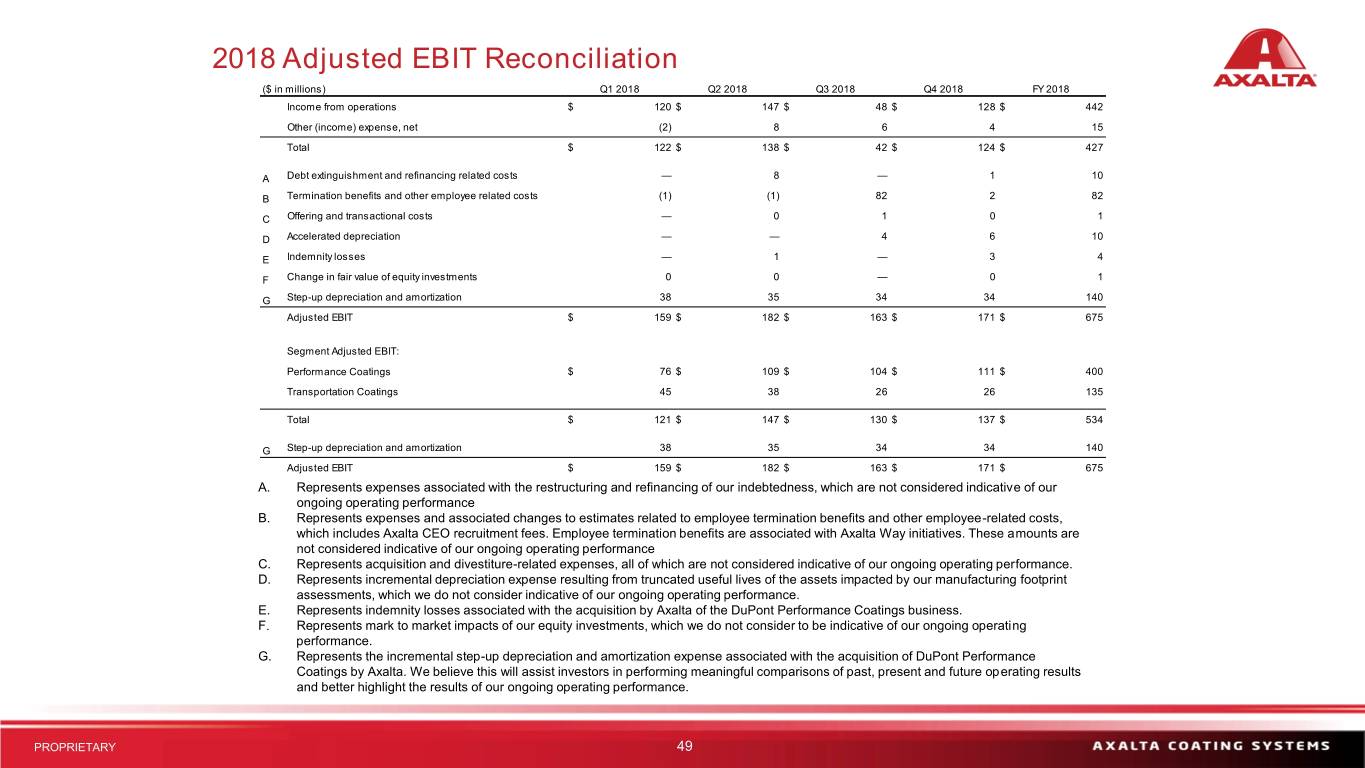
2018 Adjusted EBIT Reconciliation ($ in millions) Q1 2018 Q2 2018 Q3 2018 Q4 2018 FY 2018 Income from operations $ 120 $ 147 $ 48 $ 128 $ 442 Other (income) expense, net (2) 8 6 4 15 Total $ 122 $ 138 $ 42 $ 124 $ 427 A Debt extinguishment and refinancing related costs — 8 — 1 10 B Termination benefits and other employee related costs (1) (1) 82 2 82 C Offering and transactional costs — 0 1 0 1 D Accelerated depreciation — — 4 6 10 E Indemnity losses — 1 — 3 4 F Change in fair value of equity investments 0 0 — 0 1 G Step-up depreciation and amortization 38 35 34 34 140 Adjusted EBIT $ 159 $ 182 $ 163 $ 171 $ 675 Segment Adjusted EBIT: Performance Coatings $ 76 $ 109 $ 104 $ 111 $ 400 Transportation Coatings 45 38 26 26 135 Total $ 121 $ 147 $ 130 $ 137 $ 534 G Step-up depreciation and amortization 38 35 34 34 140 Adjusted EBIT $ 159 $ 182 $ 163 $ 171 $ 675 A. Represents expenses associated with the restructuring and refinancing of our indebtedness, which are not considered indicative of our ongoing operating performance B. Represents expenses and associated changes to estimates related to employee termination benefits and other employee-related costs, which includes Axalta CEO recruitment fees. Employee termination benefits are associated with Axalta Way initiatives. These amounts are not considered indicative of our ongoing operating performance C. Represents acquisition and divestiture-related expenses, all of which are not considered indicative of our ongoing operating performance. D. Represents incremental depreciation expense resulting from truncated useful lives of the assets impacted by our manufacturing footprint assessments, which we do not consider indicative of our ongoing operating performance. E. Represents indemnity losses associated with the acquisition by Axalta of the DuPont Performance Coatings business. F. Represents mark to market impacts of our equity investments, which we do not consider to be indicative of our ongoing operating performance. G. Represents the incremental step-up depreciation and amortization expense associated with the acquisition of DuPont Performance Coatings by Axalta. We believe this will assist investors in performing meaningful comparisons of past, present and future operating results and better highlight the results of our ongoing operating performance. PROPRIETARY 49 Sensitivity: Business Internal
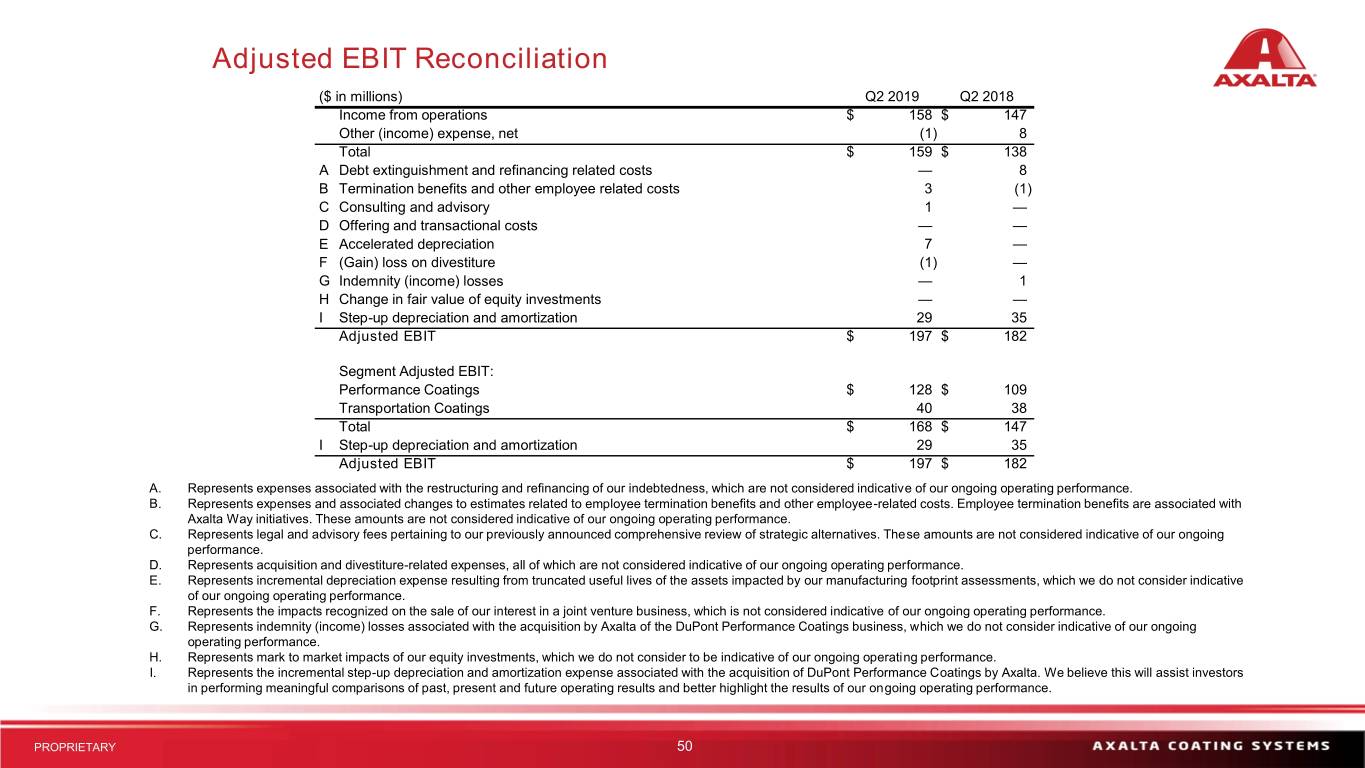
Adjusted EBIT Reconciliation ($ in millions) Q2 2019 Q2 2018 Income from operations $ 158 $ 147 Other (income) expense, net (1) 8 Total $ 159 $ 138 A Debt extinguishment and refinancing related costs — 8 B Termination benefits and other employee related costs 3 (1) C Consulting and advisory 1 — D Offering and transactional costs — — E Accelerated depreciation 7 — F (Gain) loss on divestiture (1) — G Indemnity (income) losses — 1 H Change in fair value of equity investments — — I Step-up depreciation and amortization 29 35 Adjusted EBIT $ 197 $ 182 Segment Adjusted EBIT: Performance Coatings $ 128 $ 109 Transportation Coatings 40 38 Total $ 168 $ 147 I Step-up depreciation and amortization 29 35 Adjusted EBIT $ 197 $ 182 A. Represents expenses associated with the restructuring and refinancing of our indebtedness, which are not considered indicative of our ongoing operating performance. B. Represents expenses and associated changes to estimates related to employee termination benefits and other employee-related costs. Employee termination benefits are associated with Axalta Way initiatives. These amounts are not considered indicative of our ongoing operating performance. C. Represents legal and advisory fees pertaining to our previously announced comprehensive review of strategic alternatives. These amounts are not considered indicative of our ongoing performance. D. Represents acquisition and divestiture-related expenses, all of which are not considered indicative of our ongoing operating performance. E. Represents incremental depreciation expense resulting from truncated useful lives of the assets impacted by our manufacturing footprint assessments, which we do not consider indicative of our ongoing operating performance. F. Represents the impacts recognized on the sale of our interest in a joint venture business, which is not considered indicative of our ongoing operating performance. G. Represents indemnity (income) losses associated with the acquisition by Axalta of the DuPont Performance Coatings business, which we do not consider indicative of our ongoing operating performance. H. Represents mark to market impacts of our equity investments, which we do not consider to be indicative of our ongoing operating performance. I. Represents the incremental step-up depreciation and amortization expense associated with the acquisition of DuPont Performance Coatings by Axalta. We believe this will assist investors in performing meaningful comparisons of past, present and future operating results and better highlight the results of our ongoing operating performance. PROPRIETARY 50 Sensitivity: Business Internal
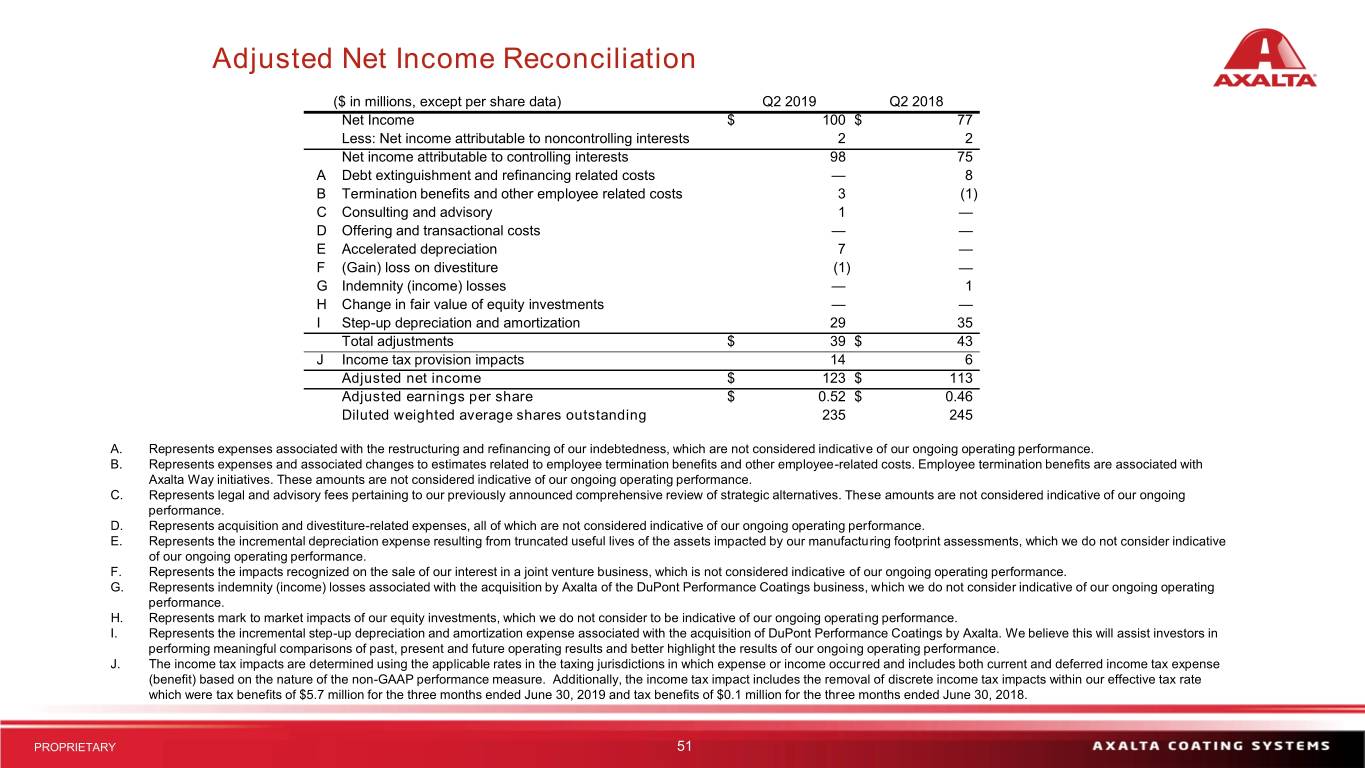
Adjusted Net Income Reconciliation ($ in millions, except per share data) Q2 2019 Q2 2018 Net Income $ 100 $ 77 Less: Net income attributable to noncontrolling interests 2 2 Net income attributable to controlling interests 98 75 A Debt extinguishment and refinancing related costs — 8 B Termination benefits and other employee related costs 3 (1) C Consulting and advisory 1 — D Offering and transactional costs — — E Accelerated depreciation 7 — F (Gain) loss on divestiture (1) — G Indemnity (income) losses — 1 H Change in fair value of equity investments — — I Step-up depreciation and amortization 29 35 Total adjustments $ 39 $ 43 J Income tax provision impacts 14 6 Adjusted net income $ 123 $ 113 Adjusted earnings per share $ 0.52 $ 0.46 Diluted weighted average shares outstanding 235 245 A. Represents expenses associated with the restructuring and refinancing of our indebtedness, which are not considered indicative of our ongoing operating performance. B. Represents expenses and associated changes to estimates related to employee termination benefits and other employee-related costs. Employee termination benefits are associated with Axalta Way initiatives. These amounts are not considered indicative of our ongoing operating performance. C. Represents legal and advisory fees pertaining to our previously announced comprehensive review of strategic alternatives. These amounts are not considered indicative of our ongoing performance. D. Represents acquisition and divestiture-related expenses, all of which are not considered indicative of our ongoing operating performance. E. Represents the incremental depreciation expense resulting from truncated useful lives of the assets impacted by our manufacturing footprint assessments, which we do not consider indicative of our ongoing operating performance. F. Represents the impacts recognized on the sale of our interest in a joint venture business, which is not considered indicative of our ongoing operating performance. G. Represents indemnity (income) losses associated with the acquisition by Axalta of the DuPont Performance Coatings business, which we do not consider indicative of our ongoing operating performance. H. Represents mark to market impacts of our equity investments, which we do not consider to be indicative of our ongoing operating performance. I. Represents the incremental step-up depreciation and amortization expense associated with the acquisition of DuPont Performance Coatings by Axalta. We believe this will assist investors in performing meaningful comparisons of past, present and future operating results and better highlight the results of our ongoing operating performance. J. The income tax impacts are determined using the applicable rates in the taxing jurisdictions in which expense or income occurred and includes both current and deferred income tax expense (benefit) based on the nature of the non-GAAP performance measure. Additionally, the income tax impact includes the removal of discrete income tax impacts within our effective tax rate which were tax benefits of $5.7 million for the three months ended June 30, 2019 and tax benefits of $0.1 million for the three months ended June 30, 2018. PROPRIETARY 51 Sensitivity: Business Internal
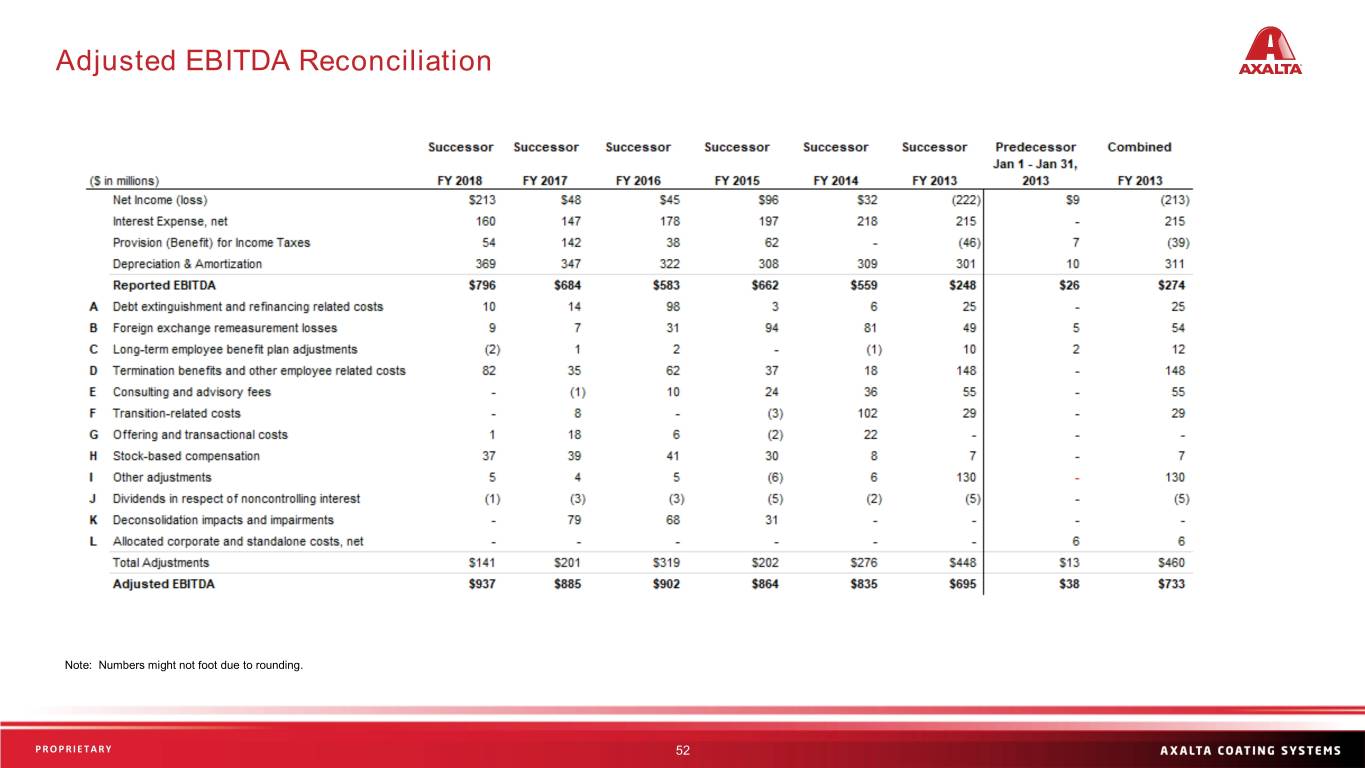
Adjusted EBITDA Reconciliation Note: Numbers might not foot due to rounding. PROPRIETARY Sensitivity: Business Internal 52
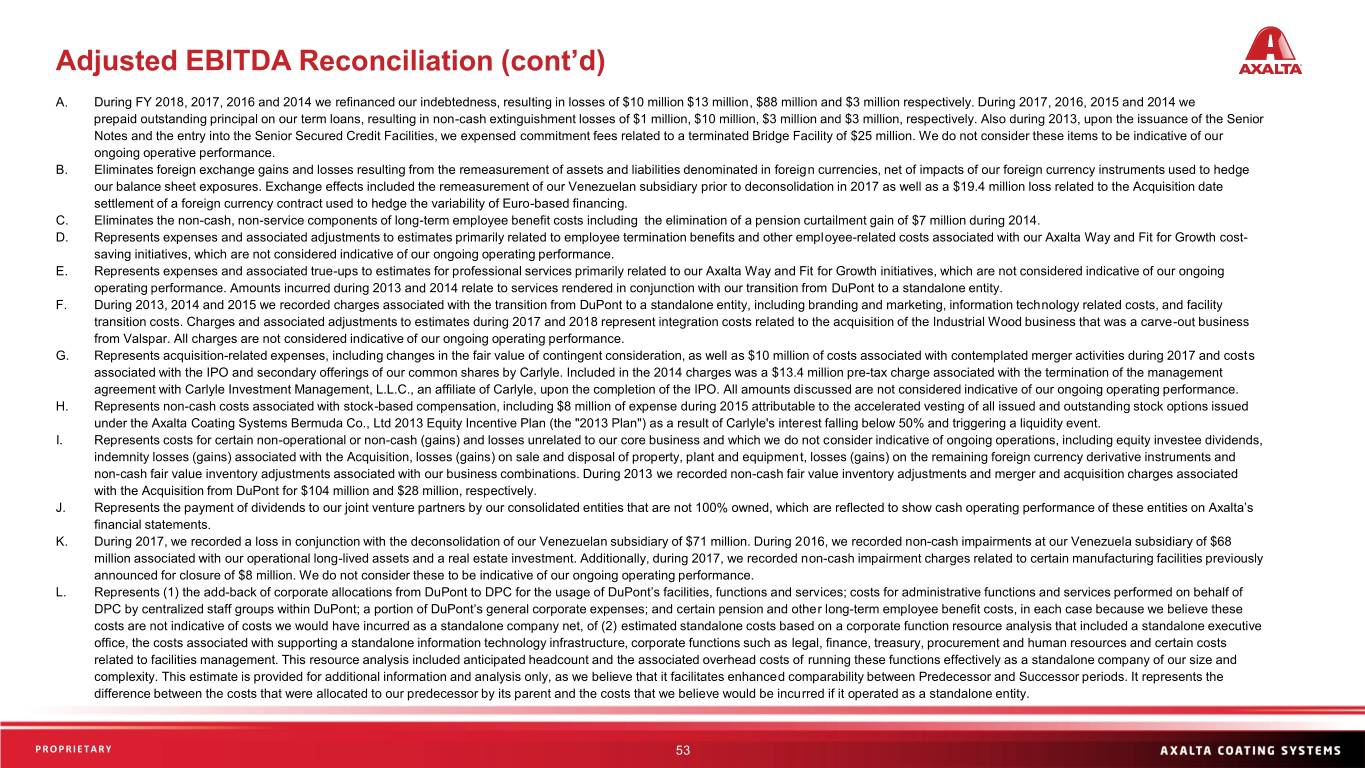
Adjusted EBITDA Reconciliation (cont’d) A. During FY 2018, 2017, 2016 and 2014 we refinanced our indebtedness, resulting in losses of $10 million $13 million, $88 million and $3 million respectively. During 2017, 2016, 2015 and 2014 we prepaid outstanding principal on our term loans, resulting in non-cash extinguishment losses of $1 million, $10 million, $3 million and $3 million, respectively. Also during 2013, upon the issuance of the Senior Notes and the entry into the Senior Secured Credit Facilities, we expensed commitment fees related to a terminated Bridge Facility of $25 million. We do not consider these items to be indicative of our ongoing operative performance. B. Eliminates foreign exchange gains and losses resulting from the remeasurement of assets and liabilities denominated in foreign currencies, net of impacts of our foreign currency instruments used to hedge our balance sheet exposures. Exchange effects included the remeasurement of our Venezuelan subsidiary prior to deconsolidation in 2017 as well as a $19.4 million loss related to the Acquisition date settlement of a foreign currency contract used to hedge the variability of Euro-based financing. C. Eliminates the non-cash, non-service components of long-term employee benefit costs including the elimination of a pension curtailment gain of $7 million during 2014. D. Represents expenses and associated adjustments to estimates primarily related to employee termination benefits and other employee-related costs associated with our Axalta Way and Fit for Growth cost- saving initiatives, which are not considered indicative of our ongoing operating performance. E. Represents expenses and associated true-ups to estimates for professional services primarily related to our Axalta Way and Fit for Growth initiatives, which are not considered indicative of our ongoing operating performance. Amounts incurred during 2013 and 2014 relate to services rendered in conjunction with our transition from DuPont to a standalone entity. F. During 2013, 2014 and 2015 we recorded charges associated with the transition from DuPont to a standalone entity, including branding and marketing, information technology related costs, and facility transition costs. Charges and associated adjustments to estimates during 2017 and 2018 represent integration costs related to the acquisition of the Industrial Wood business that was a carve-out business from Valspar. All charges are not considered indicative of our ongoing operating performance. G. Represents acquisition-related expenses, including changes in the fair value of contingent consideration, as well as $10 million of costs associated with contemplated merger activities during 2017 and costs associated with the IPO and secondary offerings of our common shares by Carlyle. Included in the 2014 charges was a $13.4 million pre-tax charge associated with the termination of the management agreement with Carlyle Investment Management, L.L.C., an affiliate of Carlyle, upon the completion of the IPO. All amounts discussed are not considered indicative of our ongoing operating performance. H. Represents non-cash costs associated with stock-based compensation, including $8 million of expense during 2015 attributable to the accelerated vesting of all issued and outstanding stock options issued under the Axalta Coating Systems Bermuda Co., Ltd 2013 Equity Incentive Plan (the "2013 Plan") as a result of Carlyle's interest falling below 50% and triggering a liquidity event. I. Represents costs for certain non-operational or non-cash (gains) and losses unrelated to our core business and which we do not consider indicative of ongoing operations, including equity investee dividends, indemnity losses (gains) associated with the Acquisition, losses (gains) on sale and disposal of property, plant and equipment, losses (gains) on the remaining foreign currency derivative instruments and non-cash fair value inventory adjustments associated with our business combinations. During 2013 we recorded non-cash fair value inventory adjustments and merger and acquisition charges associated with the Acquisition from DuPont for $104 million and $28 million, respectively. J. Represents the payment of dividends to our joint venture partners by our consolidated entities that are not 100% owned, which are reflected to show cash operating performance of these entities on Axalta’s financial statements. K. During 2017, we recorded a loss in conjunction with the deconsolidation of our Venezuelan subsidiary of $71 million. During 2016, we recorded non-cash impairments at our Venezuela subsidiary of $68 million associated with our operational long-lived assets and a real estate investment. Additionally, during 2017, we recorded non-cash impairment charges related to certain manufacturing facilities previously announced for closure of $8 million. We do not consider these to be indicative of our ongoing operating performance. L. Represents (1) the add-back of corporate allocations from DuPont to DPC for the usage of DuPont’s facilities, functions and services; costs for administrative functions and services performed on behalf of DPC by centralized staff groups within DuPont; a portion of DuPont’s general corporate expenses; and certain pension and other long-term employee benefit costs, in each case because we believe these costs are not indicative of costs we would have incurred as a standalone company net, of (2) estimated standalone costs based on a corporate function resource analysis that included a standalone executive office, the costs associated with supporting a standalone information technology infrastructure, corporate functions such as legal, finance, treasury, procurement and human resources and certain costs related to facilities management. This resource analysis included anticipated headcount and the associated overhead costs of running these functions effectively as a standalone company of our size and complexity. This estimate is provided for additional information and analysis only, as we believe that it facilitates enhanced comparability between Predecessor and Successor periods. It represents the difference between the costs that were allocated to our predecessor by its parent and the costs that we believe would be incurred if it operated as a standalone entity. PROPRIETARY Sensitivity: Business Internal 53
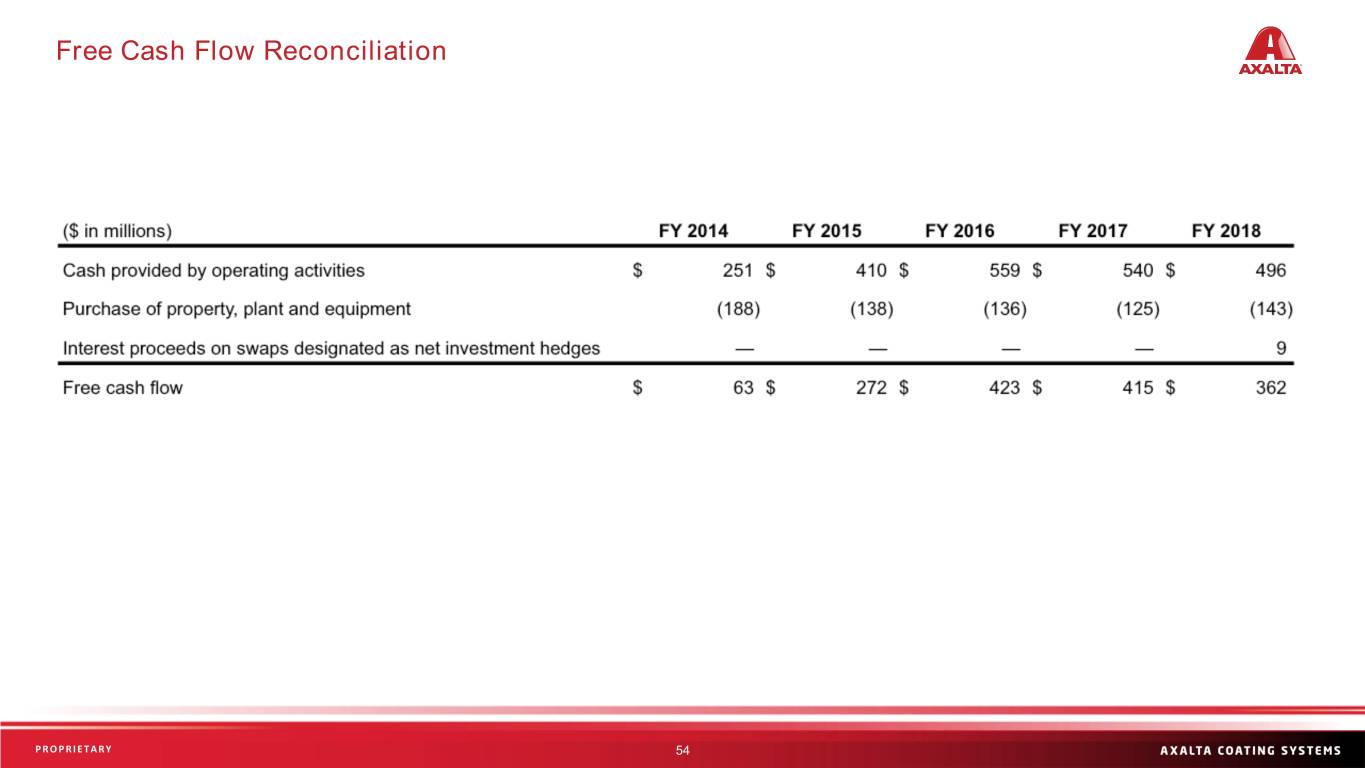
Free Cash Flow Reconciliation PROPRIETARY Sensitivity: Business Internal 54
Thank You! Sensitivity: Business Internal