EXHIBIT 99.2
Published on October 24, 2019
Exhibit 99.2 Q3 2019 Financial Results October 24, 2019
Legal Notices Forward-Looking Statements This presentation and the oral remarks made in connection herewith may contain “forward-looking statements” within the meaning of the U.S. Private Securities Litigation Reform Act of 1995, including those relating to our 2019 financial projections, which include net sales, net sales excluding FX, Adjusted EBIT, depreciation and amortization, Adjusted EBITDA, interest expense, tax rate, as adjusted, Adjusted EPS, free cash flow, capital expenditures, diluted shares outstanding, impacts from acquisitions and divestitures, FX impacts, pricing actions and related assumptions. Any forward-looking statements involve risks, uncertainties and assumptions. These statements often include words such as “believe,” “expect,” “anticipate,” “intend,” “plan,” “estimate,” “target,” “project,” “forecast,” “seek,” “will,” “may,” “should,” “could,” “would,” or similar expressions. These statements are based on certain assumptions that we have made in light of our experience in the industry and our perceptions of historical trends, current conditions, expected future developments and other factors we believe are appropriate under the circumstances as of the date hereof. Although we believe that the assumptions and analysis underlying these statements are reasonable as of the date hereof, investors are cautioned not to place undue reliance on these statements. We do not have any obligation to and do not intend to update any forward-looking statements included herein, which speak only as of the date hereof. You should understand that these statements are not guarantees of future performance or results. Actual results could differ materially from those described in any forward-looking statements contained herein or the oral remarks made in connection herewith as a result of a variety of factors, including known and unknown risks and uncertainties, many of which are beyond our control including, but not limited to, our previously announced review of strategic alternatives, the risks and uncertainties described in "Non-GAAP Financial Measures," and "Forward-Looking Statements" as well as "Risk Factors" in our Annual Report on Form 10-K for the year ended December 31, 2018 and in our Quarterly Report on Form 10-Q for the quarters ended March 31, 2019 and June 30, 2019. Non-GAAP Financial Measures The historical financial information included in this presentation includes financial information that is not presented in accordance with generally accepted accounting principles in the United States (“GAAP”), including net sales excluding FX, Adjusted Net Income, Adjusted EPS, EBITDA, Adjusted EBITDA, EBIT, Adjusted EBIT, Free Cash Flow, tax rate, as adjusted, and Net Debt. Management uses these non-GAAP financial measures in the analysis of our financial and operating performance because they assist in the evaluation of underlying trends in our business. Adjusted EBITDA, Adjusted EBIT and Adjusted EPS consist of EBITDA, EBIT and Diluted EPS, respectively, adjusted for (i) certain non-cash items included within net income, (ii) certain items Axalta does not believe are indicative of ongoing operating performance or (iii) certain nonrecurring, unusual or infrequent items that have not occurred within the last two years or we believe are not reasonably likely to recur within the next two years. We believe that making such adjustments provides investors meaningful information to understand our operating results and ability to analyze financial and business trends on a period-to-period basis. Adjusted net income shows the adjusted value of net income attributable to controlling interests after removing the items that are determined by management to be items that we do not consider indicative of our ongoing operating performance unusual or nonrecurring in nature. Our use of the terms net sales excluding FX, Adjusted Net Income, Adjusted EPS, EBITDA, Adjusted EBITDA, EBIT, Adjusted EBIT, Free Cash Flow, tax rate, as adjusted, and Net Debt may differ from that of others in our industry. Net sales excluding FX, Adjusted Net Income, Adjusted EPS, EBITDA, Adjusted EBITDA , EBIT, Adjusted EBIT and Free Cash Flow should not be considered as alternatives to net sales, net income, operating income or any other performance measures derived in accordance with GAAP as measures of operating performance or operating cash flows or as measures of liquidity. Net sales excluding FX, Adjusted Net Income, Adjusted EPS, EBITDA, Adjusted EBITDA, EBIT, Adjusted EBIT, Free Cash Flow, tax rate, as adjusted, and Net Debt have important limitations as analytical tools and should be considered in conjunction with, and not as substitutes for, our results as reported under GAAP. This presentation includes a reconciliation of certain non-GAAP financial measures with the most directly comparable financial measures calculated in accordance with GAAP. Axalta does not provide a reconciliation for non-GAAP estimates for net sales excluding FX, Adjusted EPS, Adjusted EBITDA, Adjusted EBIT, Free Cash Flow or tax rate, as adjusted, on a forward-looking basis because the information necessary to calculate a meaningful or accurate estimation of reconciling items is not available without unreasonable effort. For example, such reconciling items include the impact of foreign currency exchange gains or losses, gains or losses that are unusual or nonrecurring in nature, as well as discrete taxable events. We cannot estimate or project those items and they may have a substantial and unpredictable impact on our GAAP results. Constant Currency Constant currency or ex-FX percentages are calculated by excluding the change in average exchange rates between the current and comparable period by currency denomination exposure of the comparable period amount. Segment Financial Measures Our primary measure of segment operating performance, as determined in accordance with GAAP, is Adjusted EBIT, which is a key metric that is used by management to evaluate business performance in comparison to budgets, forecasts and prior year financial results, providing a measure that management believes reflects Axalta’s core operating performance. A reconciliation of this non-GAAP financial measure with the most directly comparable financial measure calculated in accordance with GAAP is not required. Defined Terms All capitalized terms contained within this presentation have been previously defined in our filings with the United States Securities and Exchange Commission. Rounding Due to rounding the tables presented may not foot. PROPRIETARY 2
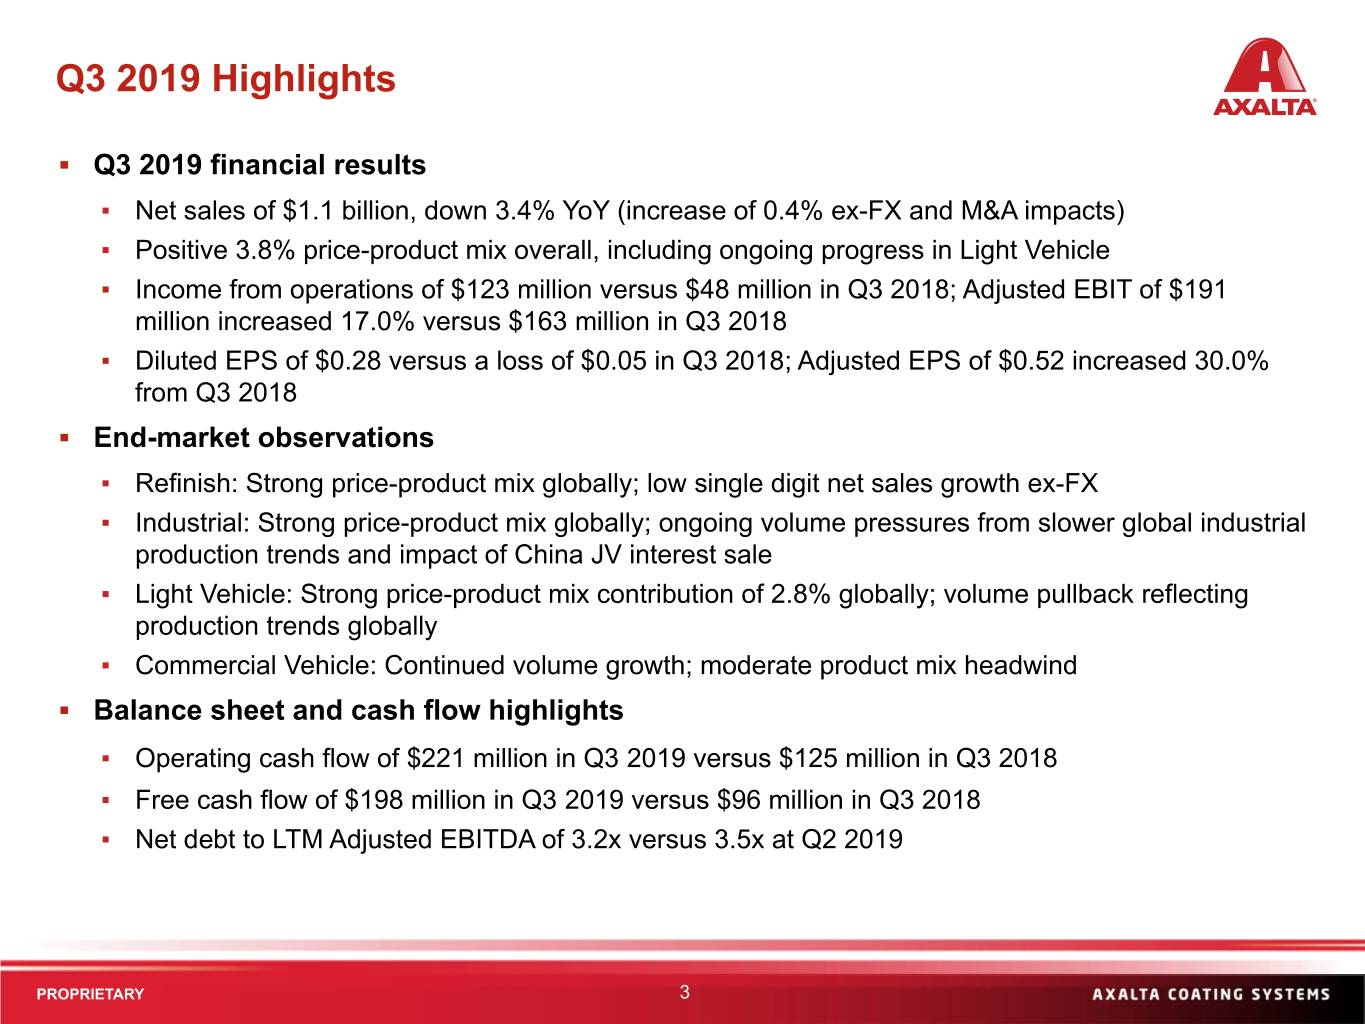
Q3 2019 Highlights ▪ Q3 2019 financial results ▪ Net sales of $1.1 billion, down 3.4% YoY (increase of 0.4% ex-FX and M&A impacts) ▪ Positive 3.8% price-product mix overall, including ongoing progress in Light Vehicle ▪ Income from operations of $123 million versus $48 million in Q3 2018; Adjusted EBIT of $191 million increased 17.0% versus $163 million in Q3 2018 ▪ Diluted EPS of $0.28 versus a loss of $0.05 in Q3 2018; Adjusted EPS of $0.52 increased 30.0% from Q3 2018 ▪ End-market observations ▪ Refinish: Strong price-product mix globally; low single digit net sales growth ex-FX ▪ Industrial: Strong price-product mix globally; ongoing volume pressures from slower global industrial production trends and impact of China JV interest sale ▪ Light Vehicle: Strong price-product mix contribution of 2.8% globally; volume pullback reflecting production trends globally ▪ Commercial Vehicle: Continued volume growth; moderate product mix headwind ▪ Balance sheet and cash flow highlights ▪ Operating cash flow of $221 million in Q3 2019 versus $125 million in Q3 2018 ▪ Free cash flow of $198 million in Q3 2019 versus $96 million in Q3 2018 ▪ Net debt to LTM Adjusted EBITDA of 3.2x versus 3.5x at Q2 2019 PROPRIETARY 3
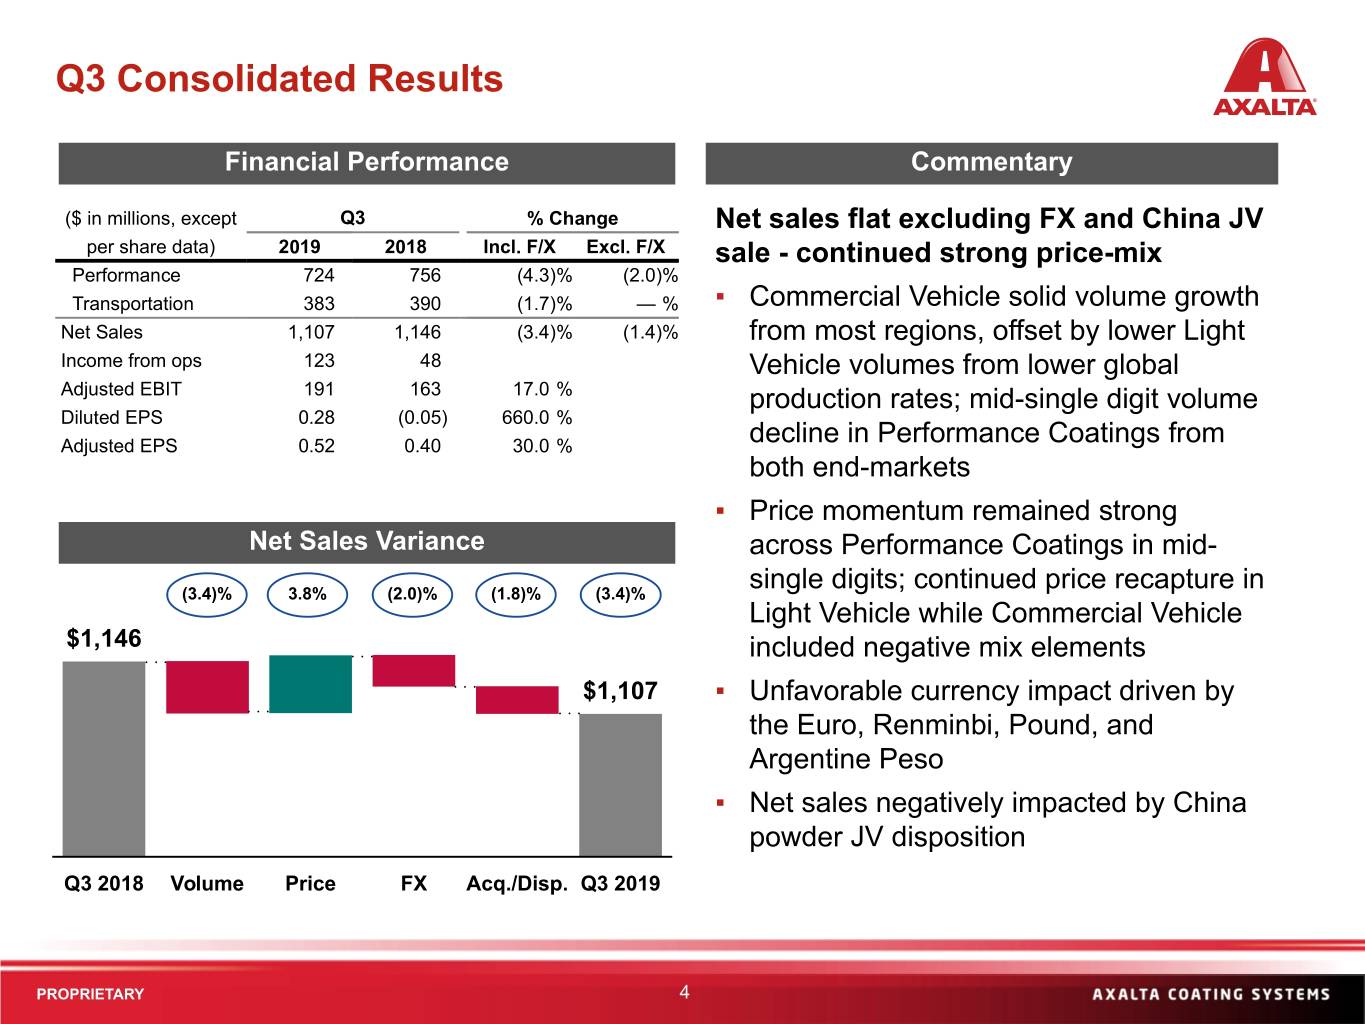
Q3 Consolidated Results Financial Performance Commentary ($ in millions, except Q3 % Change Net sales flat excluding FX and China JV per share data) 2019 2018 Incl. F/X Excl. F/X sale - continued strong price-mix Performance 724 756 (4.3)% (2.0)% Transportation 383 390 (1.7)% — % ▪ Commercial Vehicle solid volume growth Net Sales 1,107 1,146 (3.4)% (1.4)% from most regions, offset by lower Light Income from ops 123 48 Vehicle volumes from lower global Adjusted EBIT 191 163 17.0 % production rates; mid-single digit volume Diluted EPS 0.28 (0.05) 660.0 % Adjusted EPS 0.52 0.40 30.0 % decline in Performance Coatings from both end-markets ▪ Price momentum remained strong Net Sales Variance across Performance Coatings in mid- single digits; continued price recapture in (3.4)% 3.8% (2.0)% (1.8)% (3.4)% Light Vehicle while Commercial Vehicle $1,146 included negative mix elements $1,107 ▪ Unfavorable currency impact driven by the Euro, Renminbi, Pound, and Argentine Peso ▪ Net sales negatively impacted by China powder JV disposition Q3 2018 Volume Price FX Acq./Disp. Q3 2019 PROPRIETARY 4
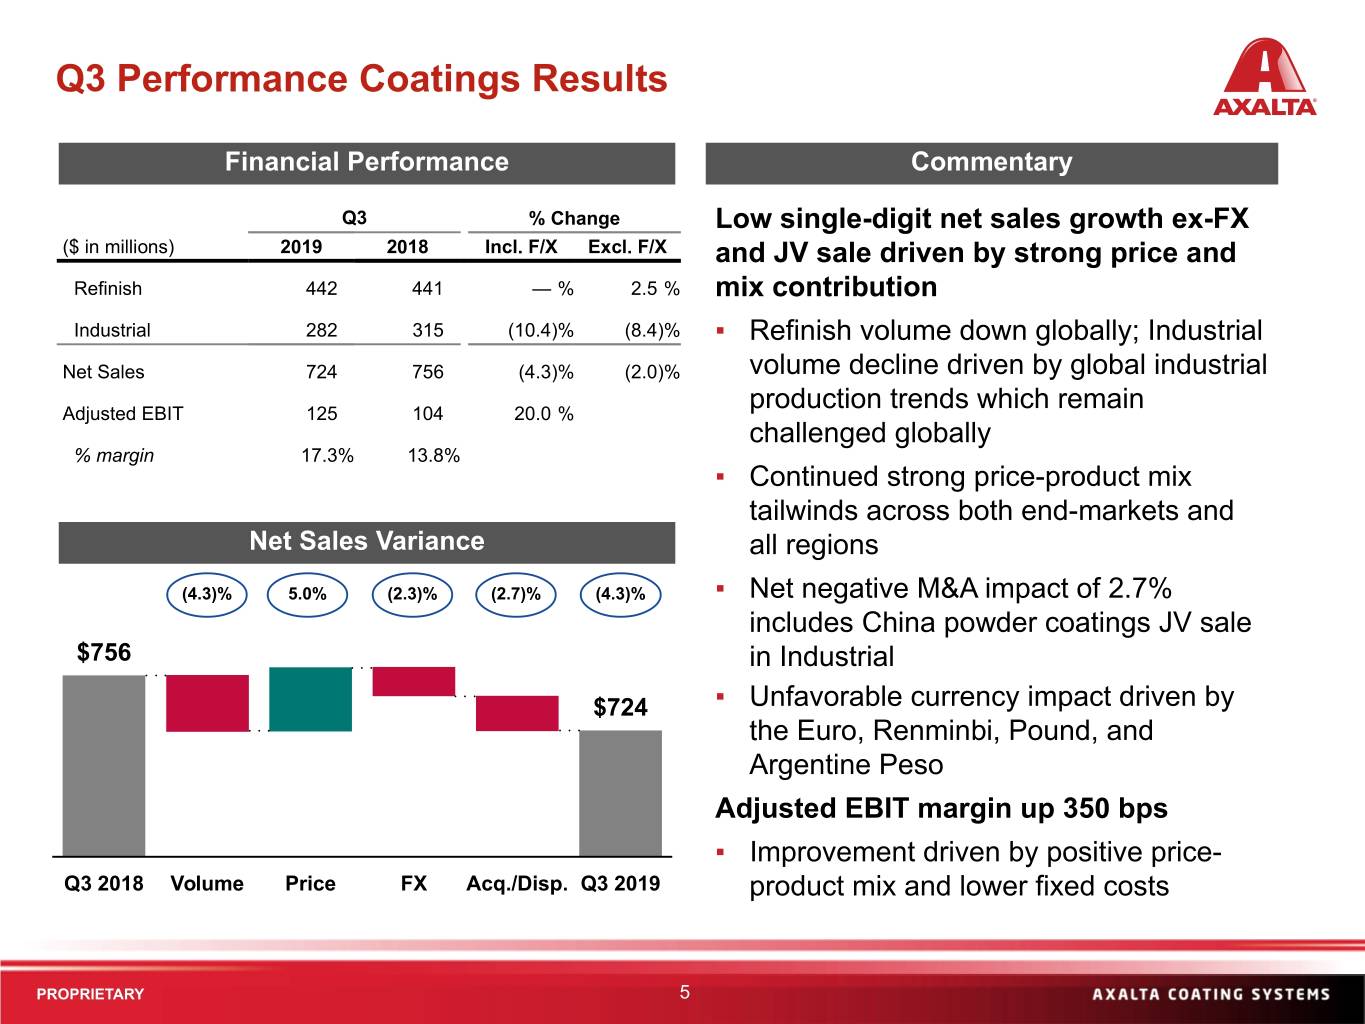
Q3 Performance Coatings Results Financial Performance Commentary Q3 % Change Low single-digit net sales growth ex-FX ($ in millions) 2019 2018 Incl. F/X Excl. F/X and JV sale driven by strong price and Refinish 442 441 — % 2.5 % mix contribution Industrial 282 315 (10.4)% (8.4)% ▪ Refinish volume down globally; Industrial Net Sales 724 756 (4.3)% (2.0)% volume decline driven by global industrial production trends which remain Adjusted EBIT 125 104 20.0 % challenged globally % margin 17.3% 13.8% ▪ Continued strong price-product mix tailwinds across both end-markets and Net Sales Variance all regions (4.3)% 5.0% (2.3)% (2.7)% (4.3)% ▪ Net negative M&A impact of 2.7% includes China powder coatings JV sale $756 in Industrial $724 ▪ Unfavorable currency impact driven by the Euro, Renminbi, Pound, and Argentine Peso Adjusted EBIT margin up 350 bps ▪ Improvement driven by positive price- Q3 2018 Volume Price FX Acq./Disp. Q3 2019 product mix and lower fixed costs PROPRIETARY 5
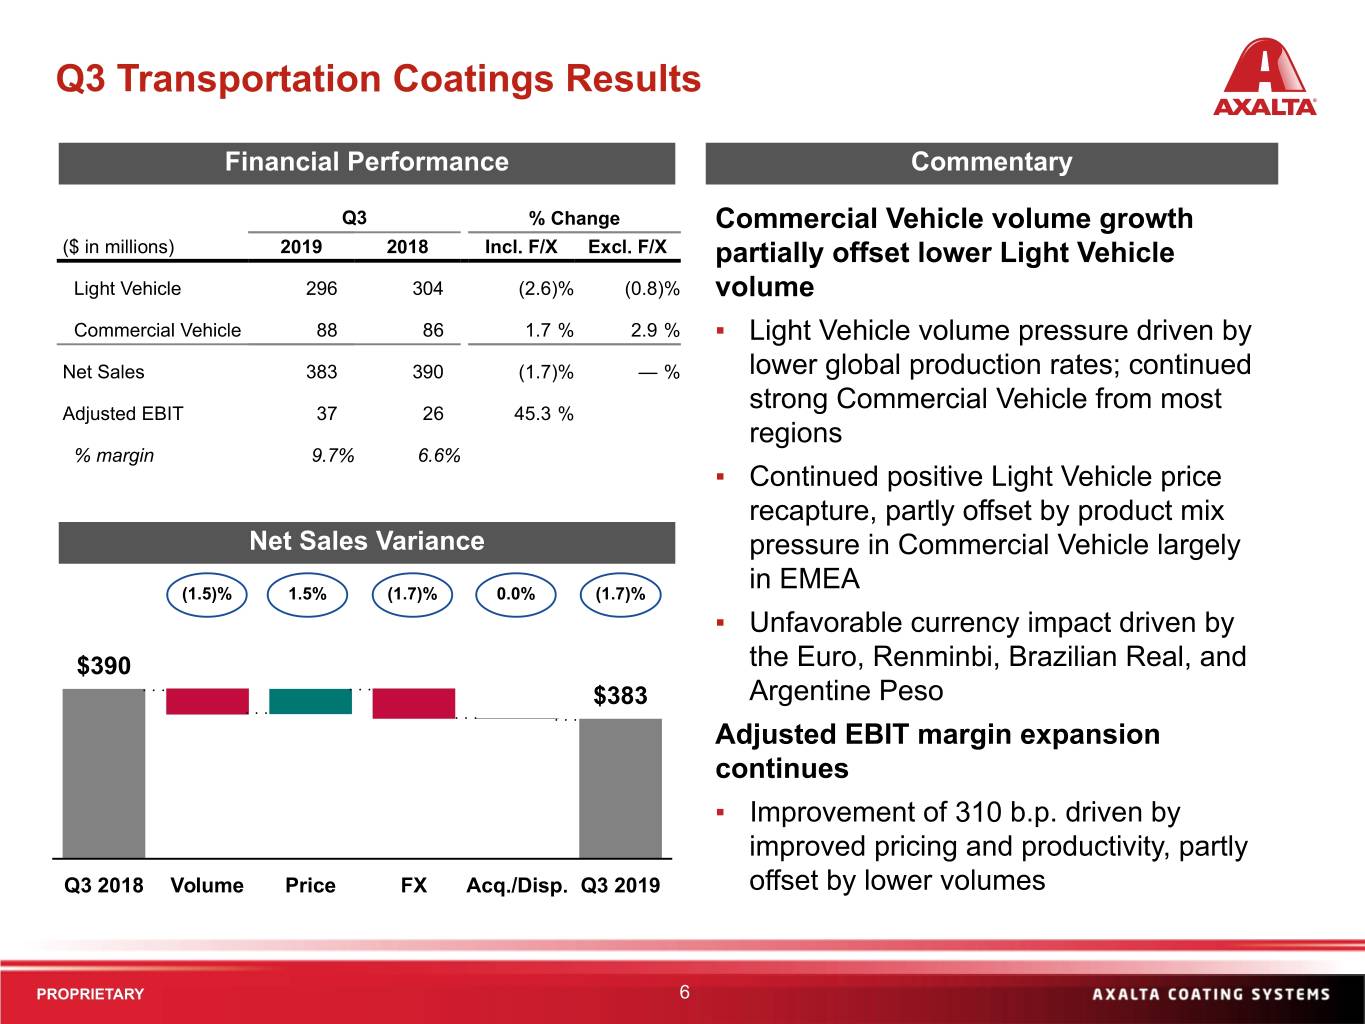
Q3 Transportation Coatings Results Financial Performance Commentary Q3 % Change Commercial Vehicle volume growth ($ in millions) 2019 2018 Incl. F/X Excl. F/X partially offset lower Light Vehicle Light Vehicle 296 304 (2.6)% (0.8)% volume Commercial Vehicle 88 86 1.7 % 2.9 % ▪ Light Vehicle volume pressure driven by Net Sales 383 390 (1.7)% — % lower global production rates; continued strong Commercial Vehicle from most Adjusted EBIT 37 26 45.3 % regions % margin 9.7% 6.6% ▪ Continued positive Light Vehicle price recapture, partly offset by product mix Net Sales Variance pressure in Commercial Vehicle largely in EMEA (1.5)% 1.5% (1.7)% 0.0% (1.7)% ▪ Unfavorable currency impact driven by $390 the Euro, Renminbi, Brazilian Real, and $383 Argentine Peso Adjusted EBIT margin expansion continues ▪ Improvement of 310 b.p. driven by improved pricing and productivity, partly Q3 2018 Volume Price FX Acq./Disp. Q3 2019 offset by lower volumes PROPRIETARY 6
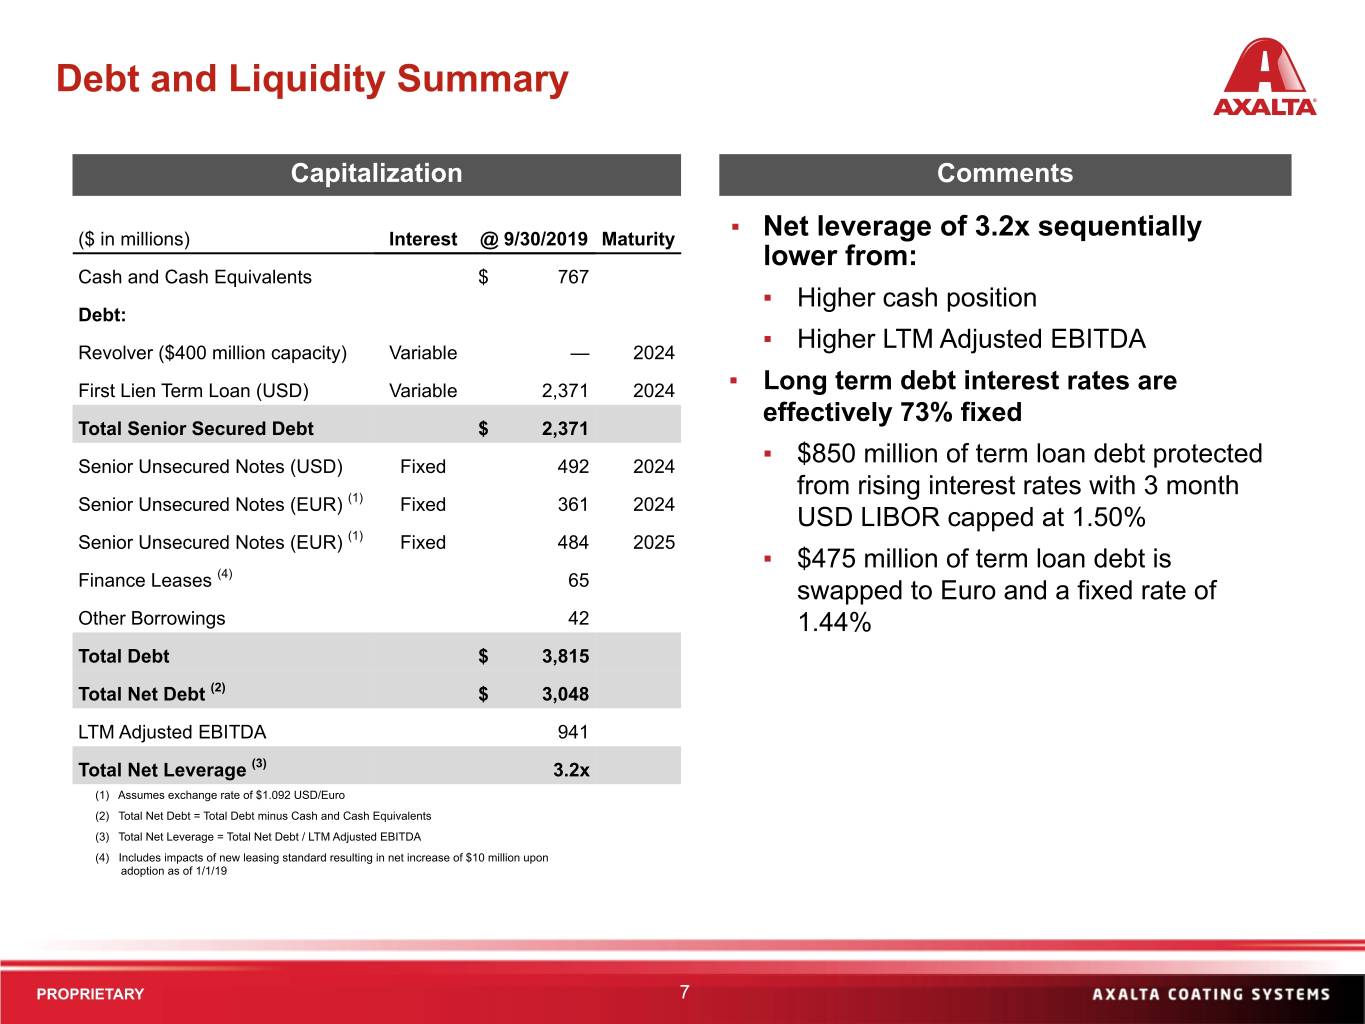
Debt and Liquidity Summary Capitalization Comments ($ in millions) Interest @ 9/30/2019 Maturity ▪ Net leverage of 3.2x sequentially lower from: Cash and Cash Equivalents $ 767 ▪ Higher cash position Debt: ▪ Higher LTM Adjusted EBITDA Revolver ($400 million capacity) Variable — 2024 First Lien Term Loan (USD) Variable 2,371 2024 ▪ Long term debt interest rates are effectively 73% fixed Total Senior Secured Debt $ 2,371 Senior Unsecured Notes (USD) Fixed 492 2024 ▪ $850 million of term loan debt protected (1) from rising interest rates with 3 month Senior Unsecured Notes (EUR) Fixed 361 2024 USD LIBOR capped at 1.50% Senior Unsecured Notes (EUR) (1) Fixed 484 2025 ▪ $475 million of term loan debt is (4) Finance Leases 65 swapped to Euro and a fixed rate of Other Borrowings 42 1.44% Total Debt $ 3,815 Total Net Debt (2) $ 3,048 LTM Adjusted EBITDA 941 Total Net Leverage (3) 3.2x (1) Assumes exchange rate of $1.092 USD/Euro (2) Total Net Debt = Total Debt minus Cash and Cash Equivalents (3) Total Net Leverage = Total Net Debt / LTM Adjusted EBITDA (4) Includes impacts of new leasing standard resulting in net increase of $10 million upon adoption as of 1/1/19 PROPRIETARY 7
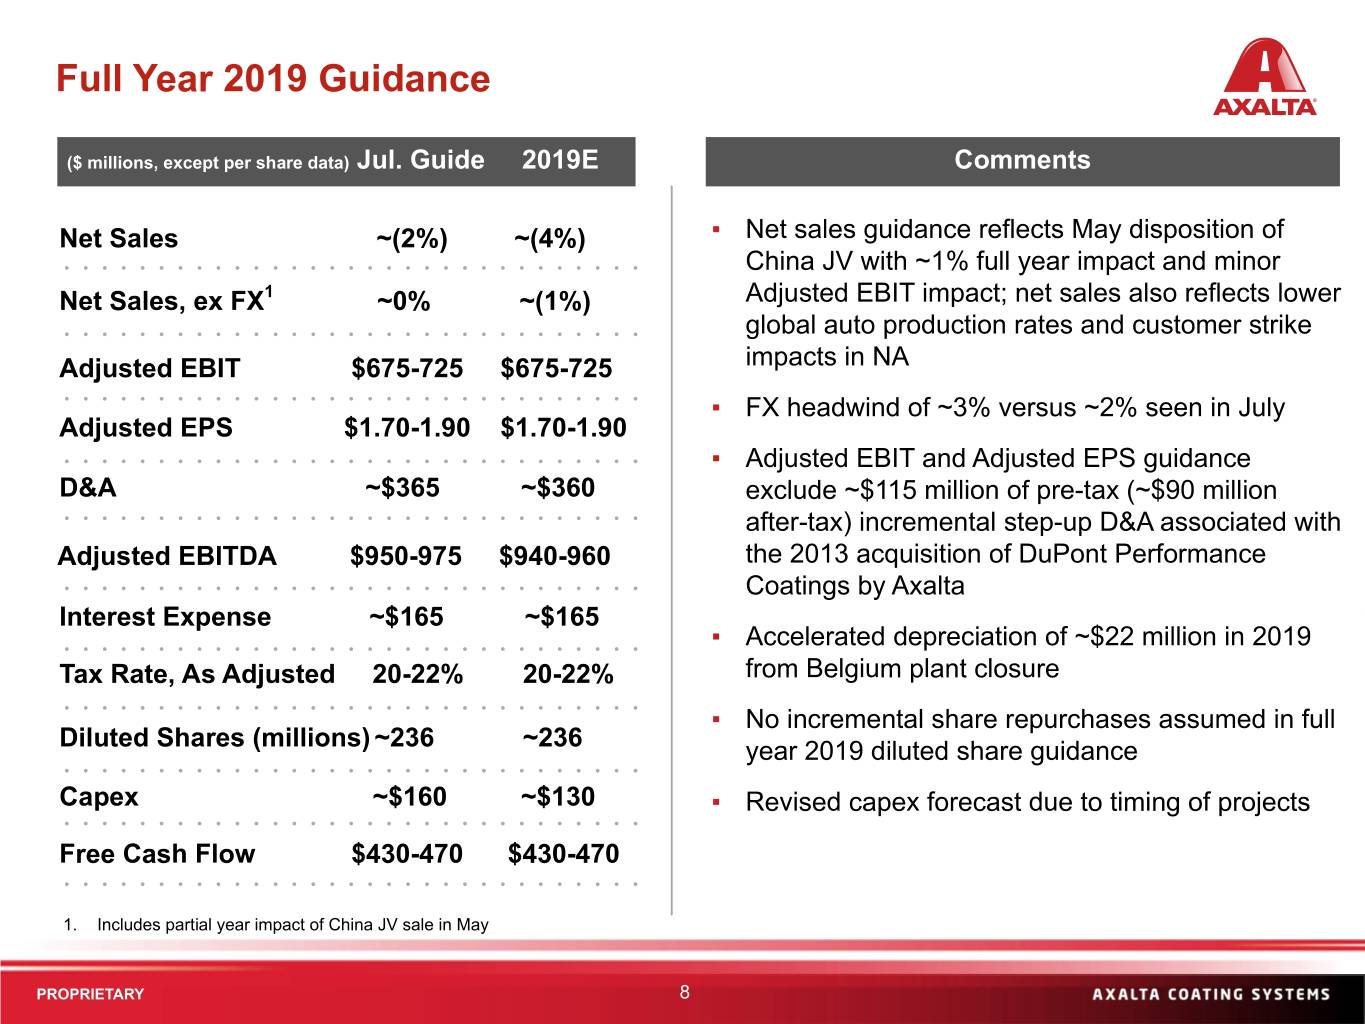
Full Year 2019 Guidance ($ millions, except per share data) Jul. Guide 2019E Comments Net Sales ~(2%) ~(4%) ▪ Net sales guidance reflects May disposition of China JV with ~1% full year impact and minor Net Sales, ex FX1 ~0% ~(1%) Adjusted EBIT impact; net sales also reflects lower global auto production rates and customer strike Adjusted EBIT $675-725 $675-725 impacts in NA ▪ FX headwind of ~3% versus ~2% seen in July Adjusted EPS $1.70-1.90 $1.70-1.90 ▪ Adjusted EBIT and Adjusted EPS guidance D&A ~$365 ~$360 exclude ~$115 million of pre-tax (~$90 million after-tax) incremental step-up D&A associated with Adjusted EBITDA $950-975 $940-960 the 2013 acquisition of DuPont Performance Coatings by Axalta Interest Expense ~$165 ~$165 ▪ Accelerated depreciation of ~$22 million in 2019 Tax Rate, As Adjusted 20-22% 20-22% from Belgium plant closure ▪ No incremental share repurchases assumed in full Diluted Shares (millions) ~236 ~236 year 2019 diluted share guidance Capex ~$160 ~$130 ▪ Revised capex forecast due to timing of projects Free Cash Flow $430-470 $430-470 1. Includes partial year impact of China JV sale in May PROPRIETARY 8
Appendix
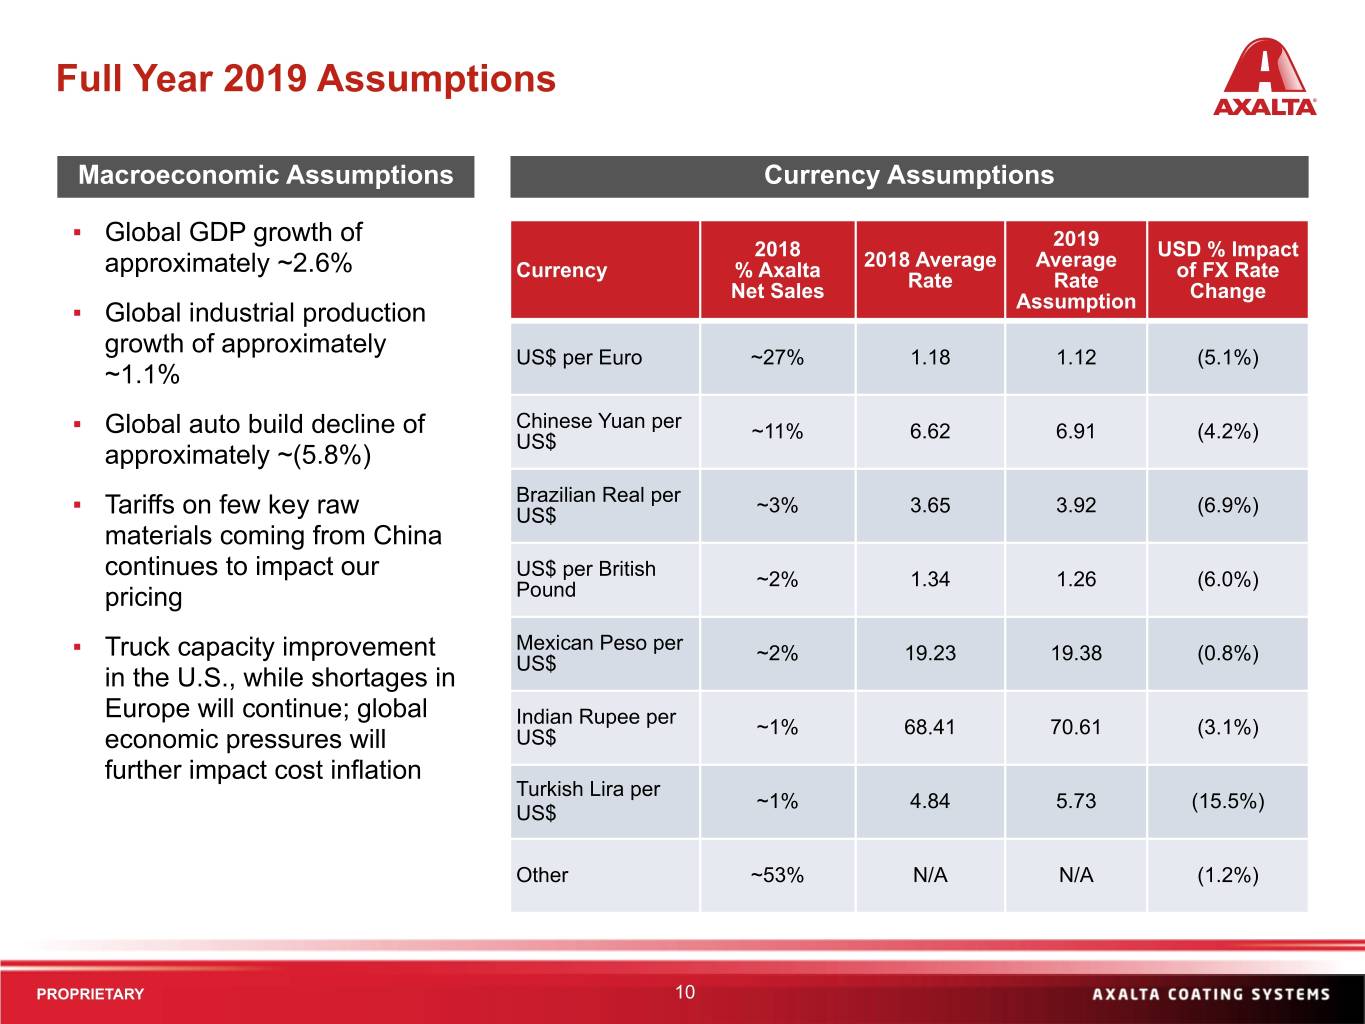
Full Year 2019 Assumptions Macroeconomic Assumptions Currency Assumptions ▪ Global GDP growth of 2018 2019 USD % Impact approximately ~2.6% Currency % Axalta 2018 Average Average of FX Rate Net Sales Rate Rate Change ▪ Global industrial production Assumption growth of approximately US$ per Euro ~27% 1.18 1.12 (5.1%) ~1.1% ▪ Global auto build decline of Chinese Yuan per US$ ~11% 6.62 6.91 (4.2%) approximately ~(5.8%) Brazilian Real per ▪ Tariffs on few key raw US$ ~3% 3.65 3.92 (6.9%) materials coming from China continues to impact our US$ per British ~2% 1.34 1.26 (6.0%) pricing Pound ▪ Truck capacity improvement Mexican Peso per US$ ~2% 19.23 19.38 (0.8%) in the U.S., while shortages in Europe will continue; global Indian Rupee per economic pressures will US$ ~1% 68.41 70.61 (3.1%) further impact cost inflation Turkish Lira per ~1% 4.84 5.73 (15.5%) US$ Other ~53% N/A N/A (1.2%) PROPRIETARY 10
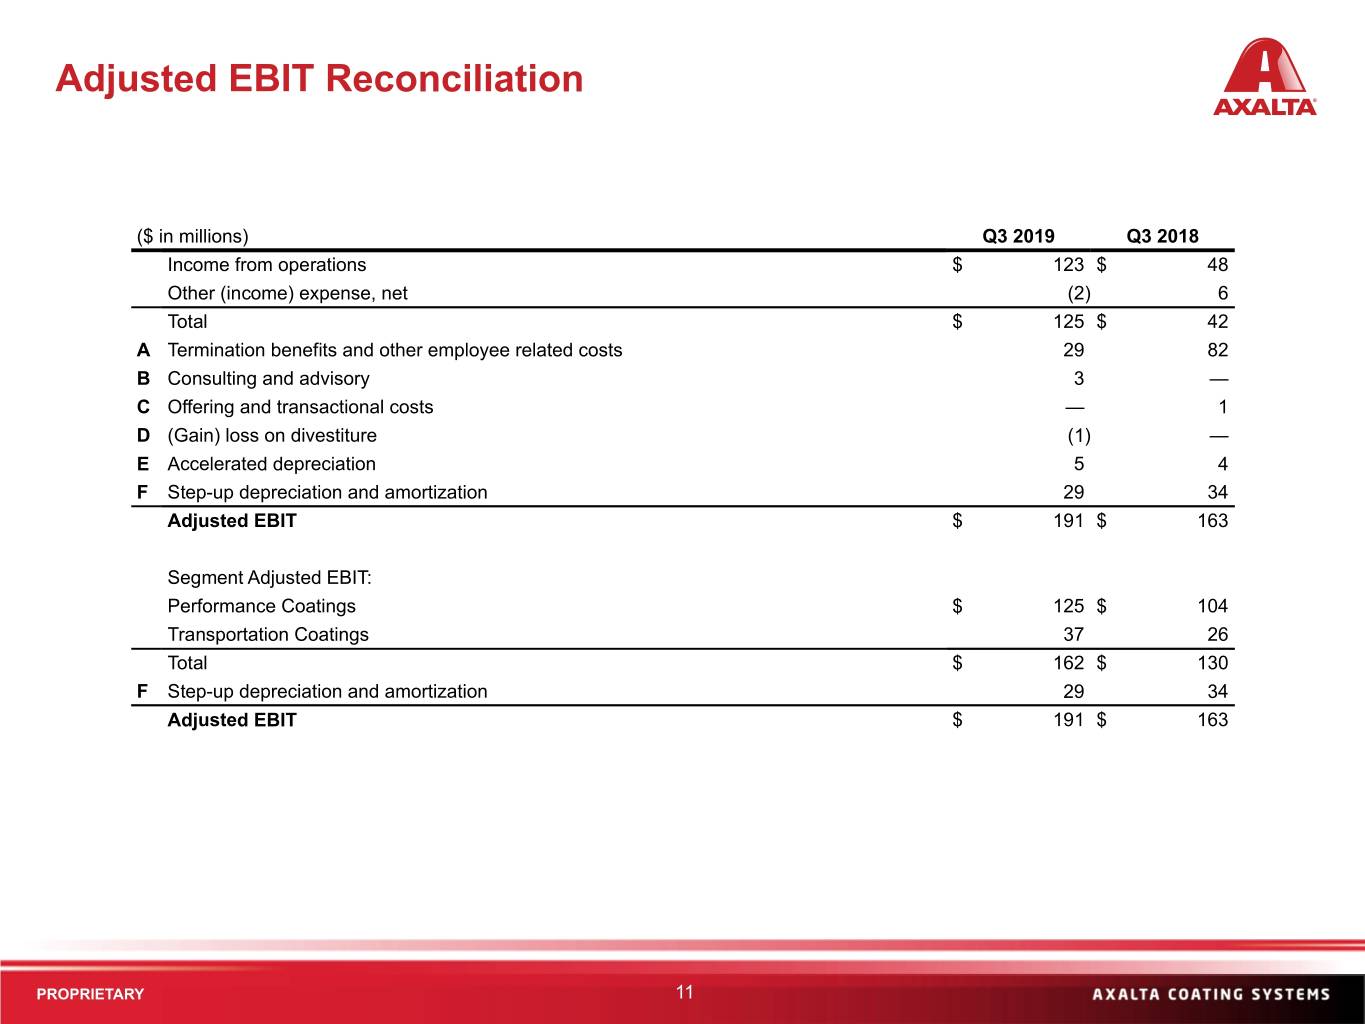
Adjusted EBIT Reconciliation ($ in millions) Q3 2019 Q3 2018 Income from operations $ 123 $ 48 Other (income) expense, net (2) 6 Total $ 125 $ 42 A Termination benefits and other employee related costs 29 82 B Consulting and advisory 3 — C Offering and transactional costs — 1 D (Gain) loss on divestiture (1) — E Accelerated depreciation 5 4 F Step-up depreciation and amortization 29 34 Adjusted EBIT $ 191 $ 163 Segment Adjusted EBIT: Performance Coatings $ 125 $ 104 Transportation Coatings 37 26 Total $ 162 $ 130 F Step-up depreciation and amortization 29 34 Adjusted EBIT $ 191 $ 163 PROPRIETARY 11
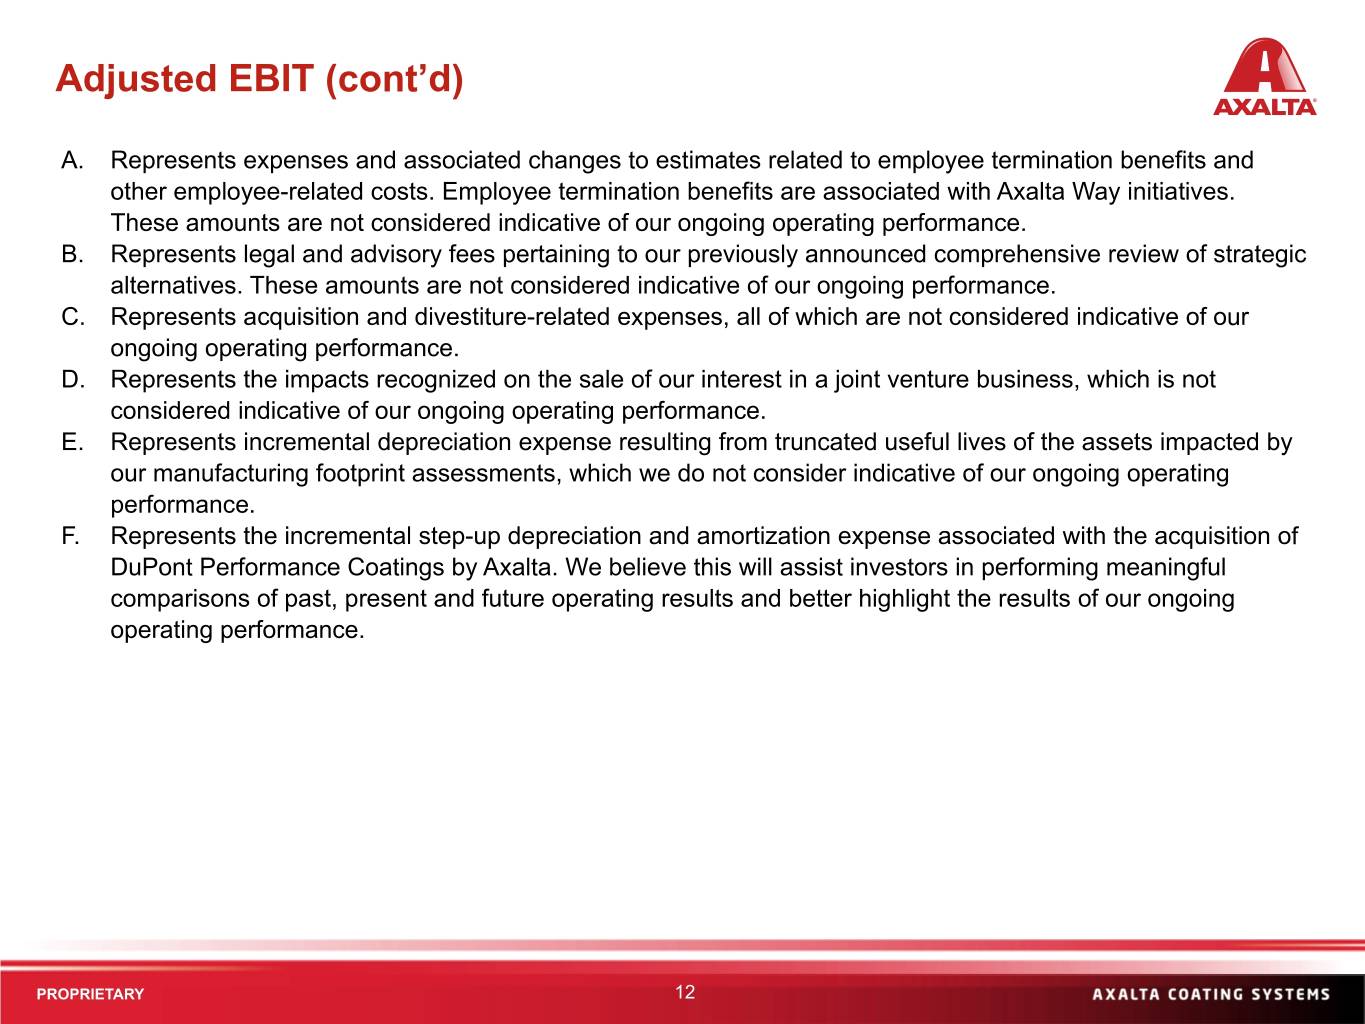
Adjusted EBIT (cont’d) A. Represents expenses and associated changes to estimates related to employee termination benefits and other employee-related costs. Employee termination benefits are associated with Axalta Way initiatives. These amounts are not considered indicative of our ongoing operating performance. B. Represents legal and advisory fees pertaining to our previously announced comprehensive review of strategic alternatives. These amounts are not considered indicative of our ongoing performance. C. Represents acquisition and divestiture-related expenses, all of which are not considered indicative of our ongoing operating performance. D. Represents the impacts recognized on the sale of our interest in a joint venture business, which is not considered indicative of our ongoing operating performance. E. Represents incremental depreciation expense resulting from truncated useful lives of the assets impacted by our manufacturing footprint assessments, which we do not consider indicative of our ongoing operating performance. F. Represents the incremental step-up depreciation and amortization expense associated with the acquisition of DuPont Performance Coatings by Axalta. We believe this will assist investors in performing meaningful comparisons of past, present and future operating results and better highlight the results of our ongoing operating performance. PROPRIETARY 12
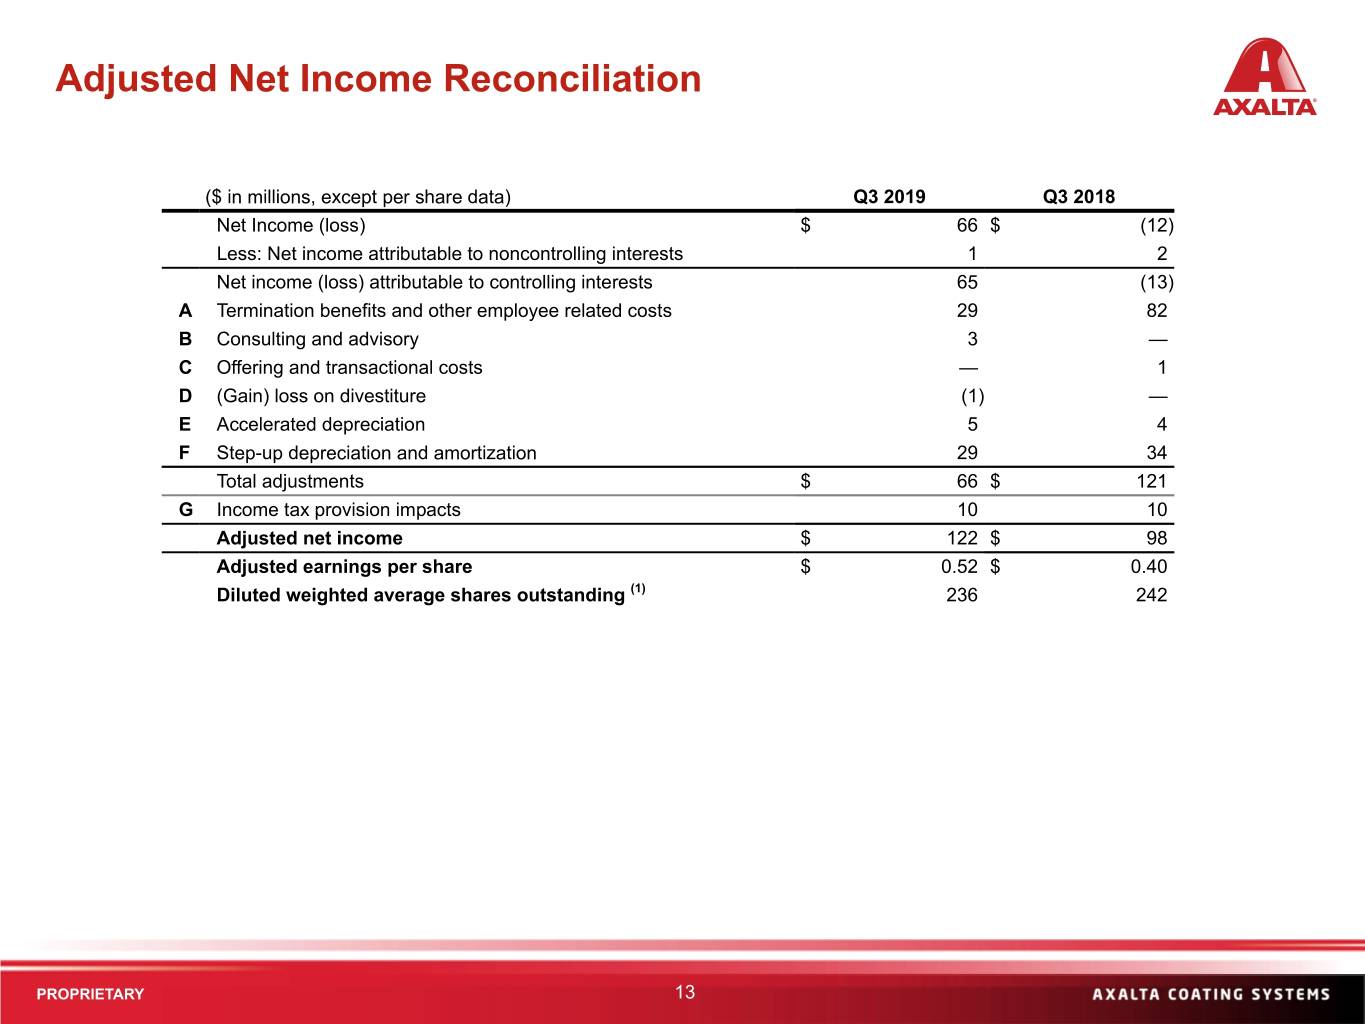
Adjusted Net Income Reconciliation ($ in millions, except per share data) Q3 2019 Q3 2018 Net Income (loss) $ 66 $ (12) Less: Net income attributable to noncontrolling interests 1 2 Net income (loss) attributable to controlling interests 65 (13) A Termination benefits and other employee related costs 29 82 B Consulting and advisory 3 — C Offering and transactional costs — 1 D (Gain) loss on divestiture (1) — E Accelerated depreciation 5 4 F Step-up depreciation and amortization 29 34 Total adjustments $ 66 $ 121 G Income tax provision impacts 10 10 Adjusted net income $ 122 $ 98 Adjusted earnings per share $ 0.52 $ 0.40 Diluted weighted average shares outstanding (1) 236 242 PROPRIETARY 13
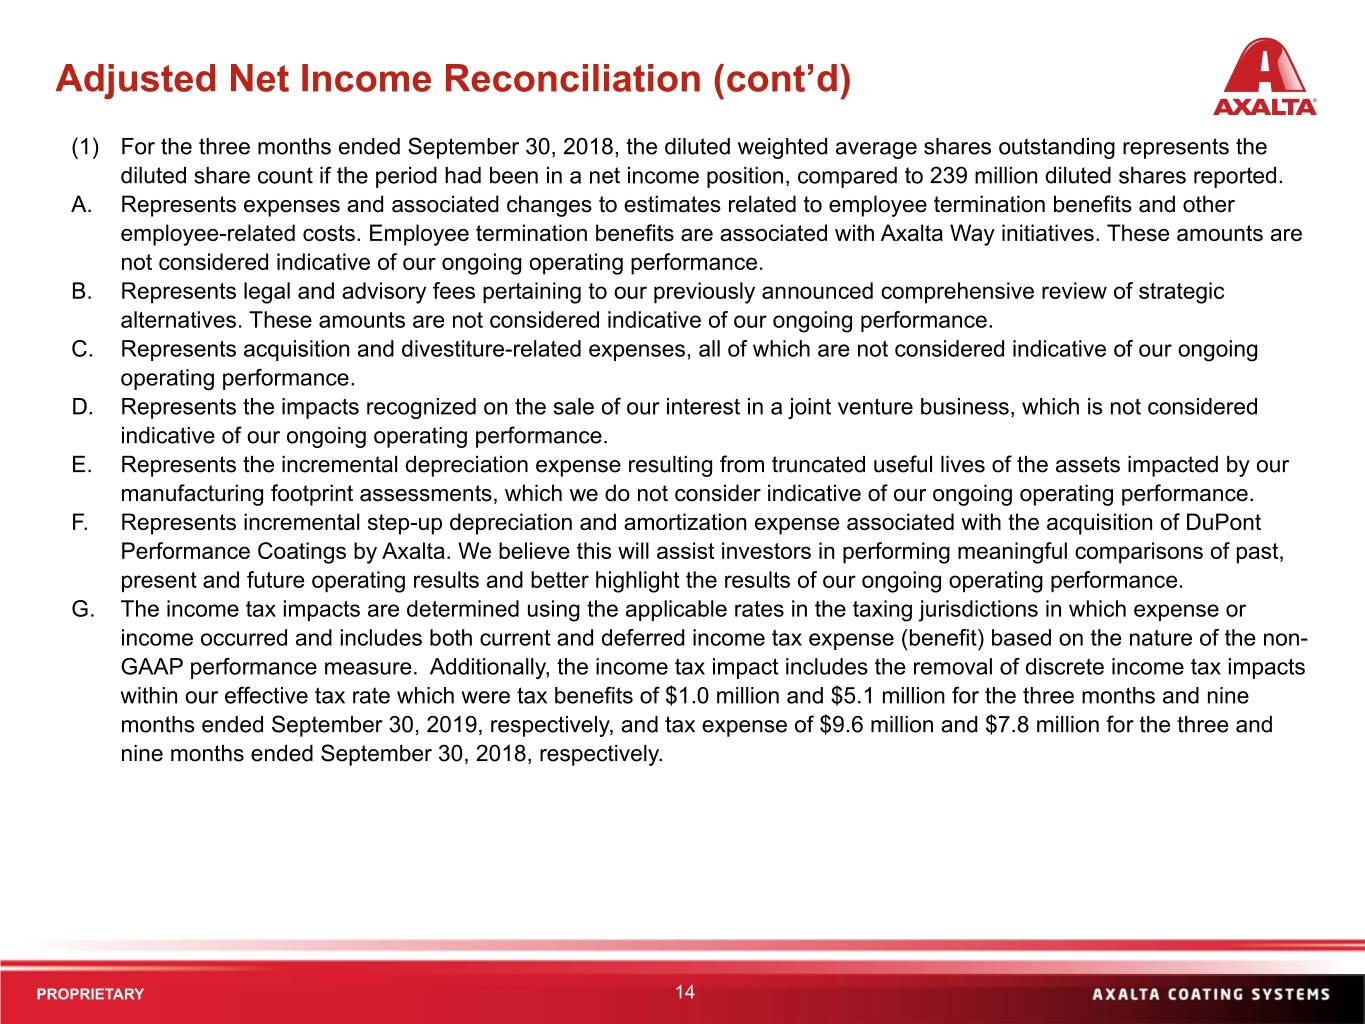
Adjusted Net Income Reconciliation (cont’d) (1) For the three months ended September 30, 2018, the diluted weighted average shares outstanding represents the diluted share count if the period had been in a net income position, compared to 239 million diluted shares reported. A. Represents expenses and associated changes to estimates related to employee termination benefits and other employee-related costs. Employee termination benefits are associated with Axalta Way initiatives. These amounts are not considered indicative of our ongoing operating performance. B. Represents legal and advisory fees pertaining to our previously announced comprehensive review of strategic alternatives. These amounts are not considered indicative of our ongoing performance. C. Represents acquisition and divestiture-related expenses, all of which are not considered indicative of our ongoing operating performance. D. Represents the impacts recognized on the sale of our interest in a joint venture business, which is not considered indicative of our ongoing operating performance. E. Represents the incremental depreciation expense resulting from truncated useful lives of the assets impacted by our manufacturing footprint assessments, which we do not consider indicative of our ongoing operating performance. F. Represents incremental step-up depreciation and amortization expense associated with the acquisition of DuPont Performance Coatings by Axalta. We believe this will assist investors in performing meaningful comparisons of past, present and future operating results and better highlight the results of our ongoing operating performance. G. The income tax impacts are determined using the applicable rates in the taxing jurisdictions in which expense or income occurred and includes both current and deferred income tax expense (benefit) based on the nature of the non- GAAP performance measure. Additionally, the income tax impact includes the removal of discrete income tax impacts within our effective tax rate which were tax benefits of $1.0 million and $5.1 million for the three months and nine months ended September 30, 2019, respectively, and tax expense of $9.6 million and $7.8 million for the three and nine months ended September 30, 2018, respectively. PROPRIETARY 14
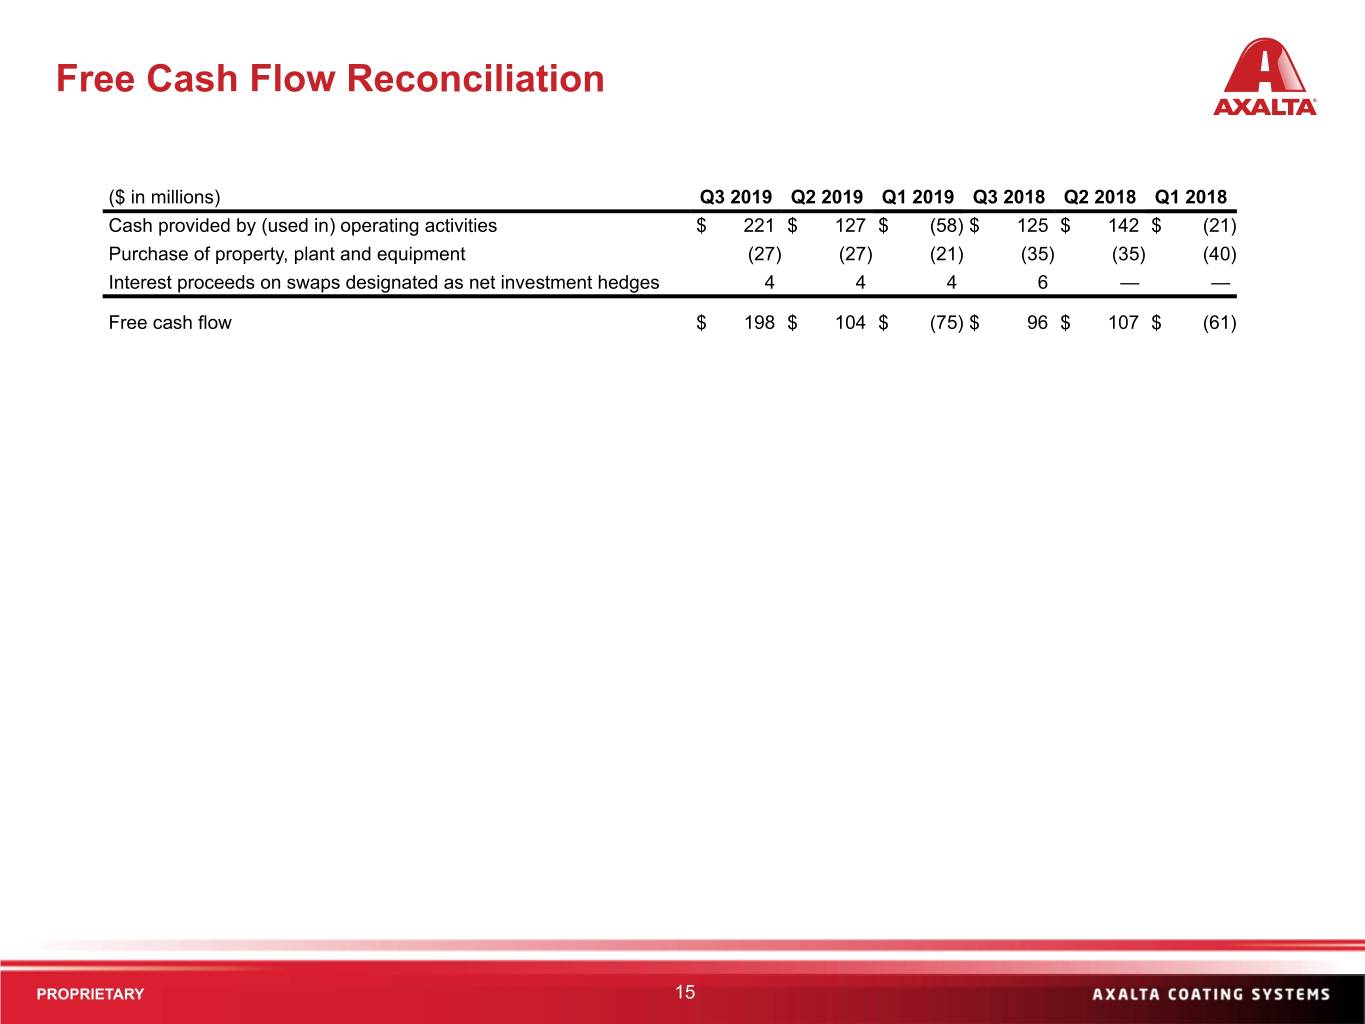
Free Cash Flow Reconciliation ($ in millions) Q3 2019 Q2 2019 Q1 2019 Q3 2018 Q2 2018 Q1 2018 Cash provided by (used in) operating activities $ 221 $ 127 $ (58) $ 125 $ 142 $ (21) Purchase of property, plant and equipment (27) (27) (21) (35) (35) (40) Interest proceeds on swaps designated as net investment hedges 4 4 4 6 — — Free cash flow $ 198 $ 104 $ (75) $ 96 $ 107 $ (61) PROPRIETARY 15
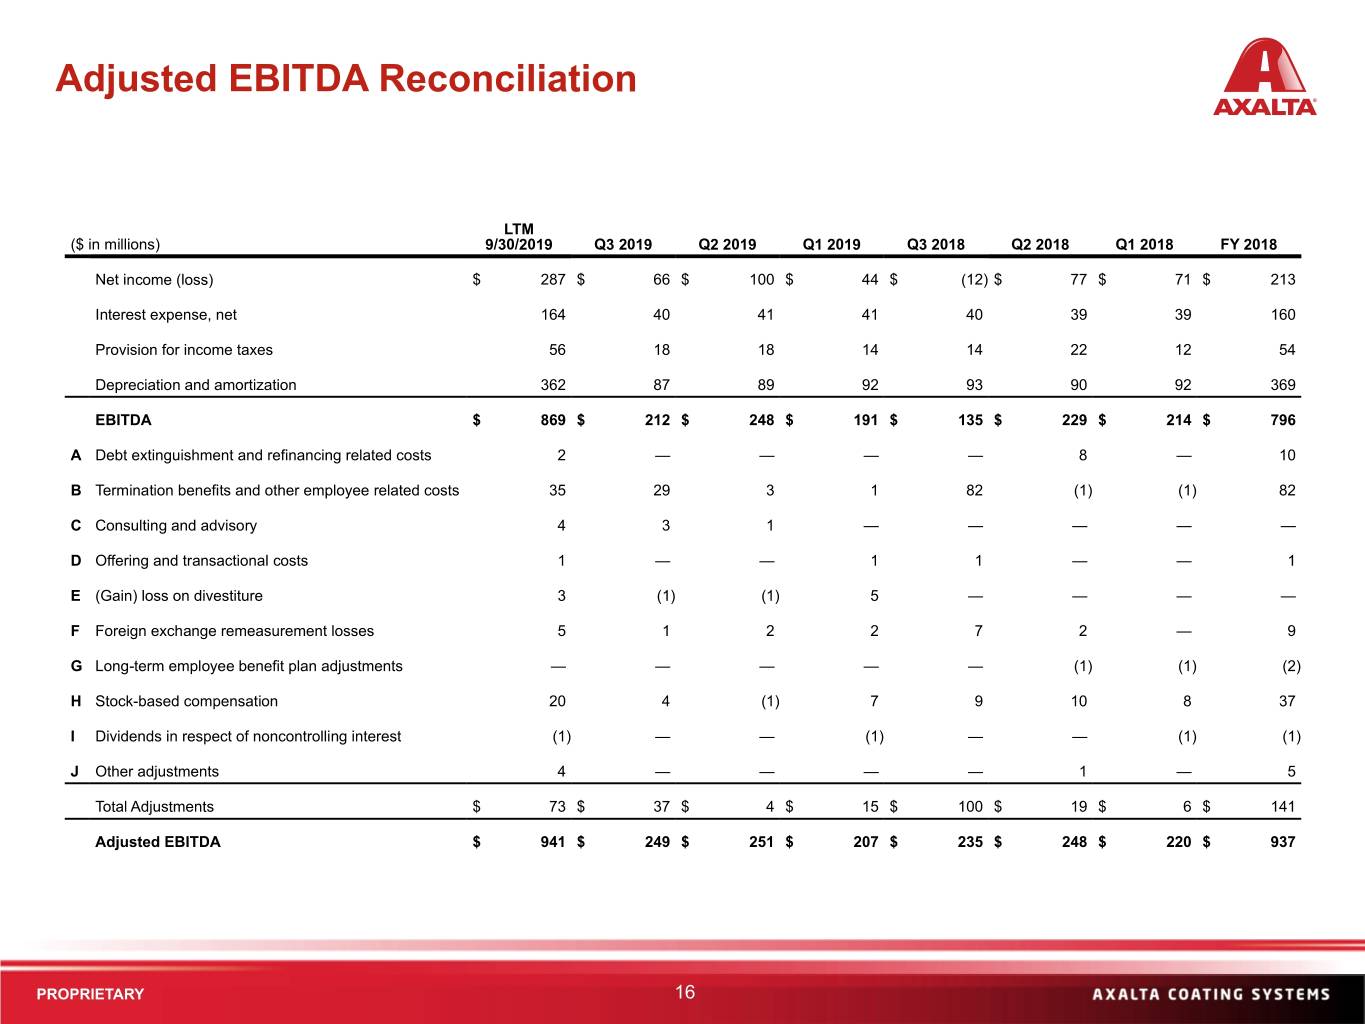
Adjusted EBITDA Reconciliation LTM ($ in millions) 9/30/2019 Q3 2019 Q2 2019 Q1 2019 Q3 2018 Q2 2018 Q1 2018 FY 2018 Net income (loss) $ 287 $ 66 $ 100 $ 44 $ (12) $ 77 $ 71 $ 213 Interest expense, net 164 40 41 41 40 39 39 160 Provision for income taxes 56 18 18 14 14 22 12 54 Depreciation and amortization 362 87 89 92 93 90 92 369 EBITDA $ 869 $ 212 $ 248 $ 191 $ 135 $ 229 $ 214 $ 796 A Debt extinguishment and refinancing related costs 2 — — — — 8 — 10 B Termination benefits and other employee related costs 35 29 3 1 82 (1) (1) 82 C Consulting and advisory 4 3 1 — — — — — D Offering and transactional costs 1 — — 1 1 — — 1 E (Gain) loss on divestiture 3 (1) (1) 5 — — — — F Foreign exchange remeasurement losses 5 1 2 2 7 2 — 9 G Long-term employee benefit plan adjustments — — — — — (1) (1) (2) H Stock-based compensation 20 4 (1) 7 9 10 8 37 I Dividends in respect of noncontrolling interest (1) — — (1) — — (1) (1) J Other adjustments 4 — — — — 1 — 5 Total Adjustments $ 73 $ 37 $ 4 $ 15 $ 100 $ 19 $ 6 $ 141 Adjusted EBITDA $ 941 $ 249 $ 251 $ 207 $ 235 $ 248 $ 220 $ 937 PROPRIETARY 16
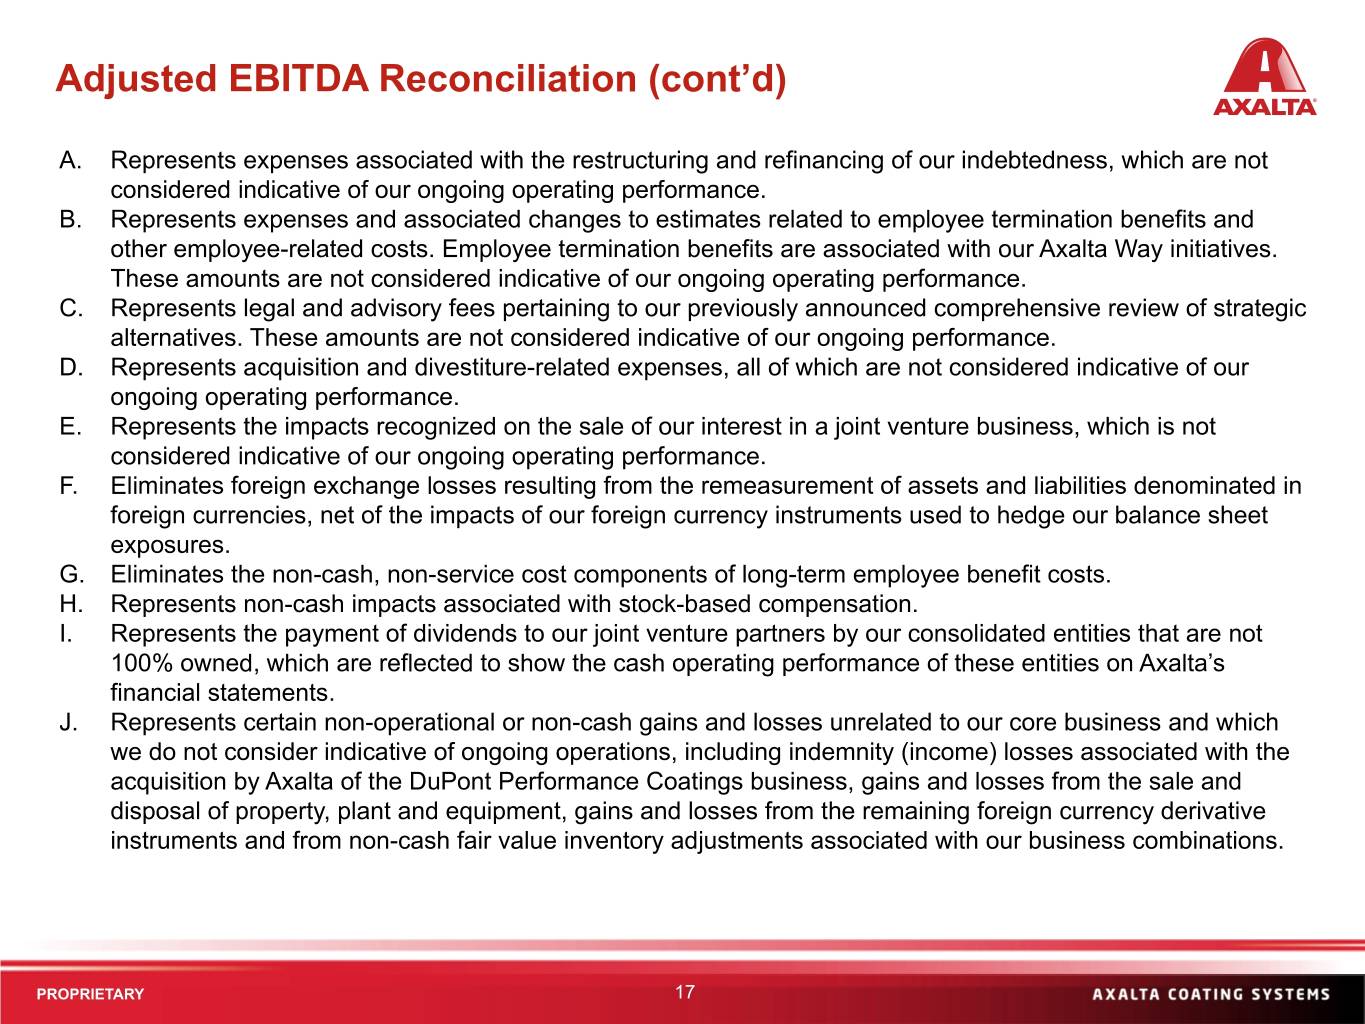
Adjusted EBITDA Reconciliation (cont’d) A. Represents expenses associated with the restructuring and refinancing of our indebtedness, which are not considered indicative of our ongoing operating performance. B. Represents expenses and associated changes to estimates related to employee termination benefits and other employee-related costs. Employee termination benefits are associated with our Axalta Way initiatives. These amounts are not considered indicative of our ongoing operating performance. C. Represents legal and advisory fees pertaining to our previously announced comprehensive review of strategic alternatives. These amounts are not considered indicative of our ongoing performance. D. Represents acquisition and divestiture-related expenses, all of which are not considered indicative of our ongoing operating performance. E. Represents the impacts recognized on the sale of our interest in a joint venture business, which is not considered indicative of our ongoing operating performance. F. Eliminates foreign exchange losses resulting from the remeasurement of assets and liabilities denominated in foreign currencies, net of the impacts of our foreign currency instruments used to hedge our balance sheet exposures. G. Eliminates the non-cash, non-service cost components of long-term employee benefit costs. H. Represents non-cash impacts associated with stock-based compensation. I. Represents the payment of dividends to our joint venture partners by our consolidated entities that are not 100% owned, which are reflected to show the cash operating performance of these entities on Axalta’s financial statements. J. Represents certain non-operational or non-cash gains and losses unrelated to our core business and which we do not consider indicative of ongoing operations, including indemnity (income) losses associated with the acquisition by Axalta of the DuPont Performance Coatings business, gains and losses from the sale and disposal of property, plant and equipment, gains and losses from the remaining foreign currency derivative instruments and from non-cash fair value inventory adjustments associated with our business combinations. PROPRIETARY 17

Thank you Investor Relations Contact: Chris Mecray Christopher.Mecray@axalta.com 215-255-7970