10-K: Annual report pursuant to Section 13 and 15(d)
Published on February 18, 2022
UNITED STATES
SECURITIES AND EXCHANGE COMMISSION
Washington, D.C. 20549
FORM 10-K
| ANNUAL REPORT PURSUANT TO SECTION 13 OR 15(d) OF THE SECURITIES EXCHANGE ACT OF 1934 | ||||||||
For the fiscal year ended December 31 , 2021
or
| TRANSITION REPORT PURSUANT TO SECTION 13 OR 15(d) OF THE SECURITIES EXCHANGE ACT OF 1934 | ||||||||
For the transition period from to .
Commission File Number: 001-36733
(Exact name of registrant as specified in its charter)
| 2851 | ||||||||||||||
| (State or other jurisdiction of incorporation or organization) |
(Primary Standard Industrial Classification Code Number) |
(I.R.S. Employer Identification No.) |
||||||||||||
(855 ) 547-1461
(Address, including zip code, and telephone number, including area code, of the registrant’s principal executive offices)
Securities registered pursuant to Section 12(b) of the Act:
| (title of class) | (Trading symbol) | (Exchange on which registered) | ||||||||||||
Securities registered pursuant to Section 12(g) of the Act: None
Indicate by check mark if the registrant is a well-known seasoned issuer, as defined in Rule 405 of the Securities Act Yes ☒ No ☐
Indicate by check mark if the registrant is not required to file reports pursuant to Section 13 or 15(d) of the Act Yes ☐ No ☒
Indicate by check mark whether the registrant (1) has filed all reports required to be filed by Section 13 or 15(d) of the Securities Exchange Act of 1934 during the preceding 12 months (or for such shorter period that the registrant was required to file such reports), and (2) has been subject to such filing requirements for the past 90 days. Yes ☒ No ☐
Indicate by check mark whether the Registrant has submitted electronically every Interactive Data File required to be submitted pursuant to Rule 405 of Regulation S-T (§232.405 of this chapter) during the preceding 12 months (or for such shorter period that the Registrant was required to submit such files). Yes ☒ No ☐
Indicate by check mark whether the Company is a large accelerated filer, an accelerated filer, a non-accelerated filer, or a smaller reporting company, or an emerging growth company. See definitions of “large accelerated filer,” “accelerated filer,” and “smaller reporting company” in Rule 12b-2 of the Exchange Act. (Check one): Large accelerated filer ☒ Non-accelerated filer ☐ Accelerated filer ☐ Small reporting company ☐ Emerging growth company ☐
If an emerging growth company, indicate by check mark if the registrant has elected not to use the extended transition period for complying with any new or revised financial accounting standards provided pursuant to Section 13(a) of the Exchange Act ☐
Indicate by check mark whether the registrant has filed a report on and attestation to its management’s assessment of the effectiveness of its internal control over financial reporting under Section 404(b) of the Sarbanes-Oxley Act (15 U.S.C. 7262(b)) by the registered public accounting firm that prepared or issued its audit report. ☒
Indicate by a check mark whether the registrant is a shell company (as defined in Rule 12b-2 of the Exchange Act). Yes ☐ No ☒
As of June 30, 2021, the last day of the registrant’s most recently completed second fiscal quarter, the aggregate market value of the registrant's common stock held by non-affiliates of the registrant was approximately $7,049.9 million (based on the closing sale price of the common stock on that date on the New York Stock Exchange).
As of February 10, 2022, there were 224,532,960 shares of the registrant’s common shares outstanding.
DOCUMENTS INCORPORATED BY REFERENCE
Table of Contents
2
PART I
ITEM 1. BUSINESS
Axalta Coating Systems Ltd. ("Axalta," the "Company," "we," "our" and "us"), a Bermuda exempted holding company incorporated in 2012, is a leading global manufacturer, marketer and distributor of high-performance coatings systems. We have over a 150-year heritage in the coatings industry and are known for manufacturing high-quality products with well-recognized brands supported by market-leading technology and customer service. Over the course of our history, we have remained at the forefront of our industry by continually developing innovative coatings technologies designed to enhance the performance and appearance of our customers' products, while improving their productivity and profitability.
Our diverse global footprint allows us to meet the needs of our customer base through an extensive sales force and technical support organization, as well as independent, locally based distributors. Our scale and strong local presence are critical to our success, allowing us to leverage our technology portfolio and customer relationships globally while meeting customer demands locally. We operate our business in two operating segments, Performance Coatings and Mobility Coatings, serving four end-markets globally as highlighted below. See the discussion and reconciliation of segment Adjusted EBIT to income before income taxes in Note 20 to our consolidated financial statements included elsewhere in this Annual Report on Form 10-K.
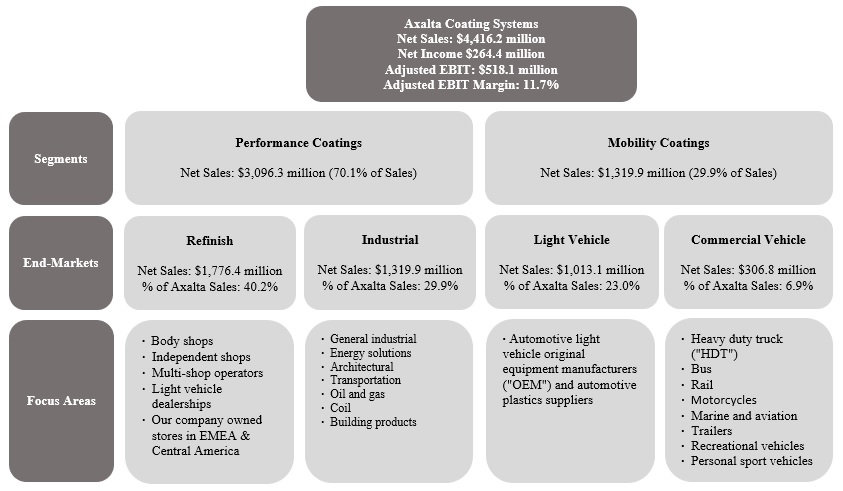
The table above reflects numbers for the year ended December 31, 2021. Adjusted EBIT Margin is calculated as Adjusted EBIT divided by net sales.
3
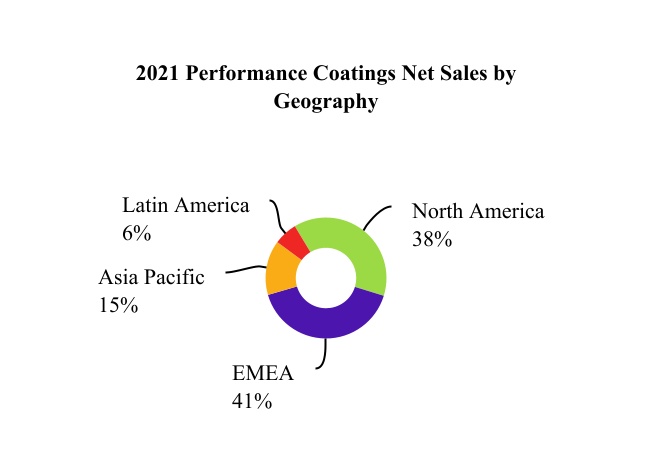
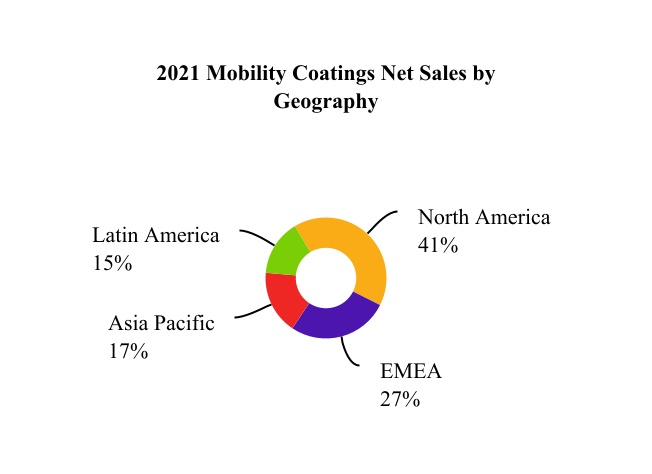
Net sales for our four end-markets and four regions for the year ended December 31, 2021 are highlighted below:
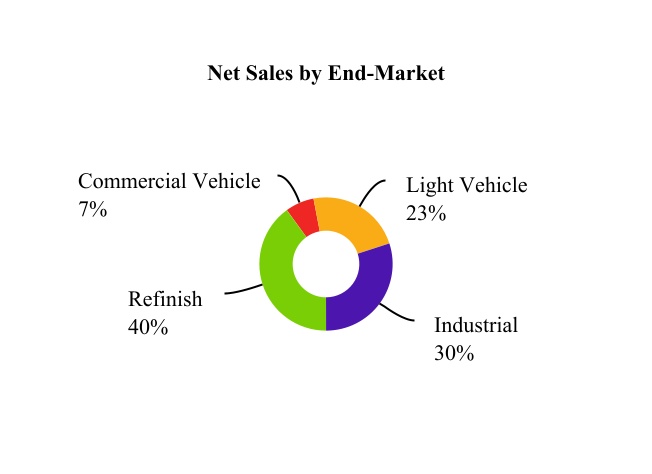
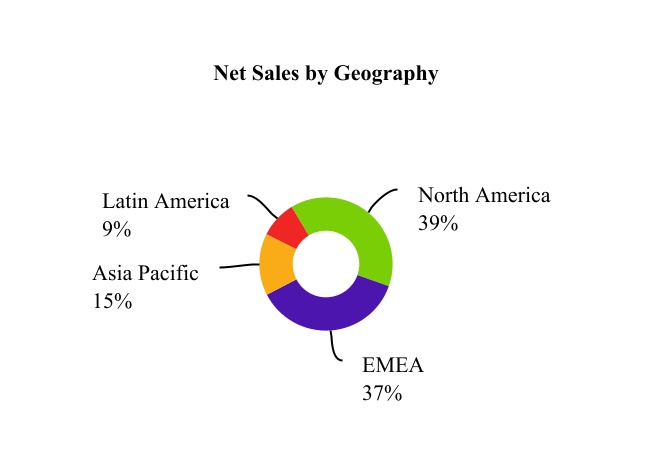
Note: Latin America includes Mexico. EMEA represents Europe, Middle East and Africa.
SEGMENT OVERVIEW
Performance Coatings
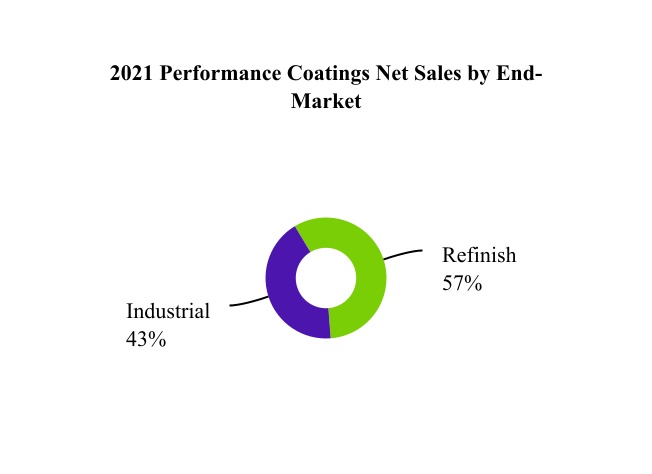
Through our Performance Coatings segment, we provide high-quality liquid and powder coatings solutions to both large regional and global original equipment manufacturers ("OEMs") and to a fragmented and local customer base. We are one of only a few suppliers with the technology to provide precise color matching and highly durable coatings systems. The end-markets within this segment are refinish and industrial.
Performance Coatings End-Markets
Refinish
Sales in the refinish end-market are driven by the number of vehicle collisions, owners' propensity to repair their vehicles, the number of miles vehicle owners drive and the size of the car parc. Although refinish coatings typically represent only a small portion of the overall vehicle repair cost, they are critical to the vehicle owner's satisfaction given their impact on appearance. As a result, body shop operators are most focused on coatings brands with a strong track record of performance and reliability. Body shops look for suppliers and brands with productivity enhancements, regulatory compliance, consistent quality, the presence of ongoing technical support and exact color match technologies. Color matching is a critical component of coatings supplier selection, since inexact matching adversely impacts vehicle appearance, and if repainting is required due to a poor match, it can reduce the speed and volume of repairs at a given shop.
We develop, market and supply a complete portfolio of innovative coatings systems and color matching technologies to facilitate faster automotive collision repairs relative to competing technologies. Our color matching technology provides Axalta-specific formulations that enable body shops to accurately match thousands of vehicle colors, regardless of vehicle brand, color, age or supplier of the original paint during production. It would be time consuming and costly for a new entrant to create such an extensive color inventory.
4
During 2021, we acquired U-POL Holdings Limited ("U-POL") a leading manufacturer of repair and refinish products used primarily for automotive refinish and aftermarket protective applications. The business produces a wide range of high-quality automotive refinishing products including fillers, aerosols, and adhesives as well as industry leading protective coatings. U-POL sells its products in over 100 countries and is widely known for its leading brands, including Raptor®, Dolphin®, and Gold™, among others. Axalta expects to accelerate the growth of U-POL's products by expanding market access through our existing sales and distribution channels while leveraging U-POL's distribution channels to extend the reach of its Refinish Coatings portfolio to new customers. U-POL's expertise in refinish accessories and protective coatings is highly complementary to Axalta's business and expands our addressable market into the important and growing mainstream and economy-based refinish segment as well as the consumer do-it-yourself aftermarket.
Industrial
The industrial end-market is comprised of liquid and powder coatings used in a broad array of end-business applications. Within the industrial end-market, we focus on the following:
•General Industrial: coatings for a wide and diverse array of applications, including racking and shelving, metal furniture, pipe and tube, metal enclosures and fencing, industrial components, and power storage and electrical boxes.
•Energy Solutions: liquid solutions to insulate copper wire used in motors and transformers and coatings to insulate sheets forming magnetic circuits of motors and transformers, computer elements and other electrical devices to provide increased motor and power efficiency, critical for today's automotive applications and focused on support for wind energy and new electric vehicles. Powder solutions provide motor and battery protection and insulation to enable engineering design.
•Architectural: powder and liquid coatings for applications such as window frames, curtain walls, and claddings, typically used in residential, industrial, commercial, and monumental buildings. Architects and designers can benefit from the advice of color experts and the latest trend collections available in our dedicated color experience rooms and online tools.
•Transportation: liquid and powder coatings for vehicle components, chassis, and wheels to protect against corrosion, provide increased durability and impart appropriate aesthetics. Total solutions to support agriculture, construction and earth moving market for protection and appearance requirements.
•Oil & Gas: liquid and powder products to coat tanks, pipelines, valves and fittings protecting against chemicals, corrosion and extreme temperatures in the oil & gas industry.
•Coil: coatings utilized in various applications such as metal building roof and wall panels, residential and commercial steel roofing, gutters, appliances, lighting, garage and entry doors, HVAC, office furniture and truck trailers.
•Building Products: coatings utilized in OEM and aftermarket industrial construction and building markets, including external building materials, cabinets, flooring and furniture.
Demand in this end-market is driven by a wide variety of macroeconomic factors, such as growth in GDP, new residential and commercial construction, as well as automotive and industrial production. There has also been an increase in demand for products that enhance environmental sustainability, corrosion resistance, productivity, and color aesthetics, which we provide through a combination of e-coat, waterborne, solventborne and powder technologies. Customers select industrial coatings based on protection, durability and appearance, with a drive for improved product and application sustainability.
With the increased global demand for electric vehicles skyrocketing, electric vehicle ("EV") manufacturers are designing and searching for solutions to power their vehicles, with innovation to extend performance and improve safety. Electric motors, batteries and EV powertrain components require protective coatings to maintain optimal temperatures, reduce the risk of fire and corrosion damage as well as to prevent electromagnetic interference. By leveraging Axalta's deep expertise in energy solutions coupled with our deep knowledge of the automotive industry and the eMobility market, Axalta has developed coating solutions tailored to the unique needs of the evolving EV industry.
Performance Coatings Products and Brands
We offer a comprehensive range of specially-formulated waterborne and solventborne products and systems used by the global automotive refinish industry to repair damaged vehicles. Our refinish products and systems comprise a range of coatings layers, including fillers, aerosols and adhesives acquired with the 2021 U-POL acquisition, required to match the vehicle's color and appearance, producing a repair surface indistinguishable from the adjacent surface.
5
We provide systems that enable body shops to match more than 200,000 color variations, using a database with more than four million formulations, in the global market. Our color technology is manifested in the pigment and dispersion technology that are utilized in our tints, one of the most technologically advanced parts of the refinish coatings system, which makes up most of our products in a body shop. We have a large color library and several well-known, long-standing premium brands, including Cromax®, Standox®, Spies Hecker®, Syrox™, and Raptor®, as well as other regional and local brands.
Our color matching and retrieval systems allow customers to quickly match any color, preventing body shop technicians from having to repeat the color matching process, saving time and materials. The color matching process begins with a technician scanning a damaged vehicle with one of our advanced color matching tools, such as our Acquire Plus EFX™ hand-held spectrophotometer. The Acquire Plus EFX reads the vehicle color, evaluating both the unique flake and color characteristics of the specific vehicle. These characteristics may vary significantly, even for vehicles of the same make, model and original color, due to a variety of factors, including a vehicle's age, plant at which it was assembled, weather conditions and operating history. The Acquire Plus EFX electronically connects with our ColorNet® database and generates for the body shop technician the precise mix of tints and colors needed to recreate that specific color for the part being repaired. In addition to the Acquire Plus EFX, we offer customers several other color matching tools, including our VINdicator® database, which identifies vehicle color based on its vehicle identification number, and traditional color matching fan decks.
We are also a leading global developer, manufacturer and supplier of functional and decorative liquid and powder coatings for a large number of diversified applications in the industrial end-market. Through an acquisition completed in 2017, we have also become a leading manufacturer and supplier of coatings sold into the building materials, cabinet, wood and luxury vinyl flooring and furniture markets in North America. Our liquid systems are used to provide insulation and thermo-mechanical protection for electrical conductors and devices, protect automotive parts and serve as primers, basecoats, and clearcoats for alloy and steel wheels, and provide weatherability and corrosion protection for metal building and infrastructure projects. Powder coatings, both thermoset and thermoplastic, products are an environmentally responsible, higher transfer efficiency alternative to liquid coatings. These coatings are typically electrostatically sprayed using a specialized spray gun and cured to create a uniform, high-quality finish. In the oil & gas industry, our powder and liquid products are used to protect components from corrosion and severe conditions such as extreme temperatures, pressures, and harsh chemicals.
Our major industrial brands include Imron® Industrial, Tufcote™ Industrial, Corlar™ Industrial, Strenex™ Industrial, PercoTop®, Voltatex®, AquaEC™, Durapon®, Hydropon™, UNRIVALED™, and Ceranamel® for liquid coatings and Alesta®, Teodur®, Nap-Gard®, Abcite® and Plascoat® for powder coatings.
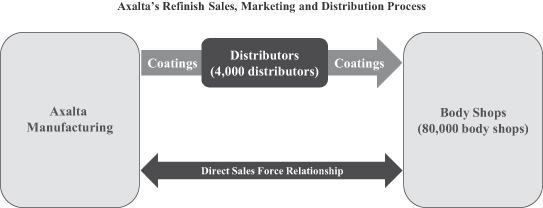
Performance Coatings Sales, Marketing and Distribution
We leverage a large global refinish sales and technical support team to effectively serve our broad refinish customer base of approximately 80,000 body shops. Most of our products are supplied by our network of approximately 4,000 independent local distributors. In select regions, including parts of Europe, we also sell directly to body-shop customers. Distributors maintain an inventory of our products to fill orders from body shops in their market and assume credit risk and responsibility for logistics, delivery and billing. In certain countries, we utilize importers that buy directly from us and actively market our products to body shops. Our relationships with our top ten distributors are longstanding and continue to contribute to our success in the global refinish market.
Our large sales force manages relationships directly with our end-customers to drive demand for our products, which in turn are purchased through customers in our distributor network. Due to the local nature of the refinish industry, our sales force operates on a regional/country basis to provide clients with responsive customer service and local insight. As part of their coverage efforts, salespeople introduce new products to body shops and provide technical support and ongoing training. We have 48 customer training centers established globally, which helps to deepen our customer relationships.
6
Our sales force also helps to drive shop productivity improvements and to install or upgrade body shop color matching and mixing equipment to improve shop profitability. Once a coating and color system is installed, a body shop almost exclusively uses its specific supplier's products. The proprietary nature of a coatings supplier's color systems, the substantial inventory needed to support a body shop and the body shop's familiarity with an established brand lead to high levels of customer retention. Our customer retention rate levels have been and continue to be strong.
Our large direct sales team in industrial serves the end customers, driving demand which is then primarily filled directly or through channels of distribution and e-commerce. We leverage this dedicated sales force and technical service team to provide regional support and focus global innovation projects to meet the evolving market needs. We are one of only three truly global powder coatings producers that can satisfy the needs and specifications of a customer in multiple regions of the world, while maximizing productivity from the broad scale and scope of our operations.
Performance Coatings Customers
Within our Performance Coatings segment, we sell coatings to customers in more than 140 countries. Our top ten customers accounted for approximately 18% of our Performance Coatings net sales during the year ended December 31, 2021.
In our industrial and refinish end-markets we serve both large OEMs and a broad, fragmented customer base. Our industrial end-market is comprised of a wide variety of industrial manufacturers, while our refinish end-market is primarily comprised of approximately 80,000 body shops, including:
•Independent Body Shops: Single location body shops that utilize premium, mainstream or economy brands based on the local market.
•Multi-Shop Operators ("MSOs"): Body shops with more than five locations focused on providing premium paint jobs with industry leading efficiency. MSOs use premium/mainstream coatings and state-of-the-art painting technology to increase shop productivity, allowing them to repair more vehicles faster.
•Original Equipment Manufacturer Dealership Body Shops: High-productivity body shops, located in OEM car dealerships, that operate like MSOs and provide premium services to customers using premium/mainstream coatings.
Performance Coatings Competition
Our primary competitors in the refinish end-market include AkzoNobel, BASF and PPG, but we also compete against local and regional players in local markets. Similarly, in the industrial end-market, we compete against multi-national suppliers, such as AkzoNobel, PPG and Sherwin-Williams, as well as a large number of local and regional players in local markets. We are one of the few performance coatings companies that can provide the customer service, total technology solutions, color design capability and the product performance necessary to deliver exceptional value to our customers.
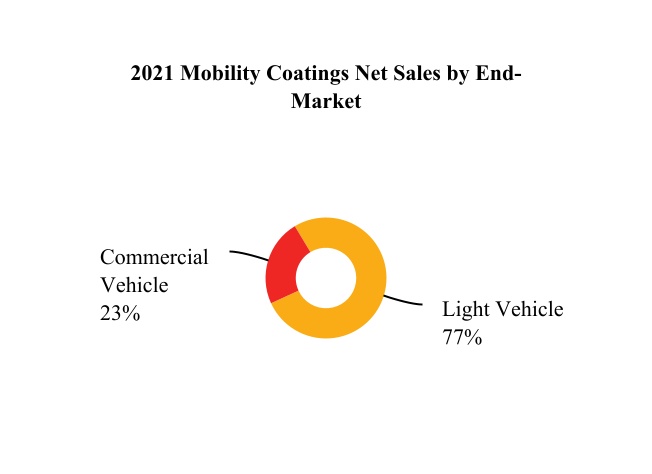
Mobility Coatings
Through our Mobility Coatings segment, we provide coatings technologies while focusing on supporting the accelerating demand for e-mobility and the evolving coatings needs of established and emerging light and commercial vehicle OEMs, fleet owners and shared mobility providers. These global customers are faced with evolving megatrends in sustainability, personalization and autonomous driving that require a high level of technical support coupled with productive, environmentally responsible coatings systems that can be applied with a high degree of precision, consistency and speed.
7
Our solutions portfolio brings together the best of Axalta's experience and innovation into three categories: Core Mobility Solutions, Advanced Mobility Solutions and Axalta Advantage.
•Core Mobility Solutions comprises Axalta's best-in-class basecoats and clearcoats for color and beautification along with primers, electrocoats and powder applications for surface protection.
•Advanced Mobility Solutions encompasses products and applications for mass customization, two-tone and digital paint. It includes coatings with enhanced functionality that improve LiDAR and radar performance and exterior protection for electric vehicle platforms and components.
•Axalta Advantage features expert services and consulting to improve productivity in and outside the paint shop, including application design, process improvement, cost and CO2 modeling, and troubleshooting.
Mobility Coatings End-Markets
Light Vehicle
Demand for light vehicle products is driven by the production of light vehicles in a particular region. Light vehicle OEMs select coatings providers on the basis of their global ability to deliver core and advanced technological solutions that improve exterior appearance and durability and provide long-term corrosion protection. These customers also look for suppliers that offer sustainable solutions that aid in the customer portfolio transformation and can enhance process efficiency to improve productivity and provide superior technical service support. Rigorous environmental and durability testing as well as obtaining engineering approvals are also key criteria used by global light vehicle OEMs when selecting coatings providers. Globally integrated suppliers are important because they offer products with consistent standards across regions and are able to deliver high-quality products in sufficient quantity while meeting OEM service requirements. Our global scale, people expertise, innovative technology platforms, and customer focus, position us to be a global partner and solutions provider to the most discerning and demanding light vehicle OEMs. We are one of the few coatings producers that can provide OEMs with global product specifications, standardized color development, compatibility with an ever-increasing number of substrates, automotive plastics supplies, increasingly complex colors and environmentally responsible coatings while continuing to simplify and reduce steps in the coating application process.
Commercial Vehicle
Sales in the commercial vehicle end-market are generated from a variety of applications, including non-automotive transportation (i.e., HDT, bus and rail), motorcycles, marine and aviation, as well as related markets such as trailers, recreational vehicles and personal sport vehicles. This end-market is primarily driven by global commercial vehicle production, which is influenced by overall economic activity, government infrastructure spending, equipment replacement cycles and evolving environmental standards for sustainability.
Commercial vehicle OEMs select coatings providers on the basis of their ability to consistently deliver advanced technological solutions that improve exterior appearance, protection and durability and provide extensive color libraries and matching capabilities at the lowest total cost-in-use, while meeting stringent environmental requirements. Particularly for HDT applications, truck owners demand a significant variety of custom colors and advanced product technologies to enable custom designs. Our strong market position and growth are driven by our ability to provide customers with our market-leading brand, Imron®, as well as leveraging our global product lines, regional knowledge and service.
Mobility Coatings Products and Brands
We develop and supply a complete coatings product line for light vehicle OEMs. Our products are designed to enhance the styling and appearance of a vehicle's exterior while providing protection from the elements, extending the life of the vehicle. Widely recognized in the industry for our advanced and patented technologies, our products not only increase productivity and profitability for OEMs but also produce attractive and durable finishes. Our light vehicle coatings portfolio is one of the broadest in the industry.
The coatings operation is a critical component of the vehicle assembly process, requiring a high degree of precision, speed and productivity. The paint shop process typically includes a dip process, three application zones and three high-temperature ovens that cure each coating layer at temperatures ranging from 320°F to 400°F (i.e., "high bake"). Our key products consist of the four main coatings layers: electrocoat (AquaEC™), primer (HyperDur™), basecoat (ChromaDyne™) and clearcoat (Lumeera™).
The coatings process accounts for a majority of the total energy consumed during the vehicle manufacturing process. As a result, we have developed Harmonized Coating TechnologiesTM, including 3-Wet, Eco-Concept and 2-Wet Monocoat, that help our OEM customers lower costs by reducing energy consumption while increasing productivity.
8
In today's existing transportation ecosystem, coatings provide essential beauty and color to vehicle bodies while adding corrosion and impact protection. As the industry evolves, each dimension of mobility – electric vehicles, shared transportation and autonomous driving – requires coatings with advanced functionality that, in addition to aesthetics and protection, contributes to the efficiency of electrification, vehicle design, navigation and passenger safety, among other areas. The evolution of mobility creates tremendous opportunities for OEMs but requires them to undertake significant shifts in how they design and produce vehicles. OEMs are also increasingly looking to reduce the weight of vehicles in response to increasing vehicle emissions and fuel consumption regulations. As a result, OEMs are constructing vehicle platforms using a variety of new materials in addition to steel and plastic, including aluminum, carbon fiber and other substrates, LiDAR and Radar sensory, each of which requires specialized coatings formulations to create a uniform color and finish. We continue to innovate with our OEM customers in driving this trend, as evidenced by use of our coatings on their flagship vehicle platforms.
We also develop and supply a wide array of coatings systems for a broad range of commercial vehicle applications including HDT, bus and rail. These products simultaneously enhance aesthetic appearance and provide protection from the elements. We meet the demands of commercial vehicle customers with our extensive offering of over 75,000 different colors. In the HDT market, because the metal and composite components are painted simultaneously in an automatic process, most truck OEMs use low bake coatings to ensure that the plastic composite parts on a truck's exterior do not deform during the bake process. Truck owners demand a wide variety of custom colors that are formulated using a combination of on-site mixing machines at the OEM or direct shipments of premixed high-volume colors from us. Our commercial vehicle brands include Imron®, Imron Elite®, Centari®, Rival®, Corlar® epoxy undercoats and AquaEC™.
Mobility Coatings Sales, Marketing and Distribution
We have full-time technical representatives stationed at certain OEM facilities around the world. These on-site representatives provide customer support, monitor the painting process and track paint demand at each assembly plant. Monitoring OEM line performance in real-time allows our technical support teams to help improve paint department operating efficiency and provide performance feedback to our formulating chemists and paint manufacturing teams. Our customer technical support representatives also help OEMs manage their physical inventory by forecasting facility coatings demand based on the customer's build schedule.
We sell and ship products directly to light vehicle OEMs in each of our four regions coordinated via a global point of contact for each customer and assist OEMs with on-site customer support. Located in 11 countries, our manufacturing facilities provide a local presence that enables us to cultivate strong relationships, gain intimate customer knowledge, provide superior technical support to our key customers and maintain "just-in-time" product delivery capabilities critical to OEMs. Our local presence also allows us to quickly react to changing local dynamics, offer high-quality products and provide excellent customer service.
In the commercial vehicle end-market, we employ a dedicated sales and technical service team to support our diverse customer base, including a direct sales force supporting the HDT market. We ship our coatings directly to commercial vehicle OEMs and provide on-site technical service representatives that play an important role by helping to optimize the painting process and by providing responsive customer support.
Mobility Coatings Customers
We provide our products and services to light and commercial vehicle customers at over 200 assembly plants worldwide, including all of the top ten global automotive manufacturers. We have a stable customer base with several relationships dating back approximately 90 years and believe we are well positioned with the fastest growing OEMs in both the developed and emerging markets. Our top ten customers accounted for approximately 67% of our Mobility Coatings net sales during the year ended December 31, 2021.
Mobility Coatings Competition
We primarily compete against large multi-national suppliers such as PPG and BASF in the light and commercial vehicle end-markets. Additionally, we compete against certain regional players in Asia Pacific and EMEA. With our state-of-the-art coatings solutions and local presence in key OEM markets, we are one of the few competitors in the industry that offers global OEM manufacturers the combination of high-quality products, personalized, top-rate technical service and short lead-times for product delivery.
KEY RAW MATERIALS
We use thousands of different raw materials, which fall into seven broad categories: liquid resins, powder resins, pigments, solvents, monomers, isocyanates and additives. On average, our total raw material spend represents between 40% and 50% of our cost of sales, even during 2021 despite significant raw material inflation experienced throughout the year. We purchase raw materials from a diverse group of suppliers, with our top ten suppliers representing approximately 33% of our 2021 spending on raw materials.
9
Approximately 65% of the raw materials we procure are derived from crude oil and natural gas. While prices for these raw materials fluctuate with energy prices, such fluctuations are somewhat mitigated by the fact that the majority of our raw materials are fourth to sixth generation derivatives of crude oil and natural gas. The dynamics of supply and demand play a much more critical role in our cost of raw materials than just the price of crude oil. Non-petrochemical based inputs such as minerals that are used to manufacture coating pigments are not significantly affected by volatility in crude oil prices but tend to be impacted by the supply-demand dynamics of their industry.
Historically, to manage raw material volatility, we have used a combination of price increases to customers and, in certain limited circumstances, contractual raw material recovery mechanisms. Since 2001, our variable cost of sales has remained stable between 35% and 45% of net sales, even during 2021 despite significant raw material inflation experienced throughout the year.
RESEARCH AND DEVELOPMENT
Our focus on technology has allowed us to proactively provide customers with next-generation offerings that enhance product performance, improve productivity and satisfy increasingly strict environmental regulations. Since our entry into the coatings industry over 150 years ago, we believe we have consistently been at the forefront of coatings technology innovation. These innovations have played a fundamental role in our ability to maintain and grow our global market share as well as deliver substantial financial returns.
We believe that we are a technology leader well positioned to benefit from continued industry shifts in customer needs. Our markets are among the most demanding in the coatings industry with high levels of product performance that continuously evolves, with increasing expectations for productivity on customer lines and with environmentally responsible products. Our technology development is led by a highly experienced and educated workforce that is focused on new product development, color development, technical customer support and improving our manufacturing processes. As such, our technology development covers two critical interrelated aspects for us, research and development as well as technical support and manufacturing. In total, as of December 31, 2021, we have approximately 1,300 people dedicated to technology development. We operate four major technology centers throughout the world where we develop and align our technology investments with regional business needs complemented by approximately 28 regional laboratories which provide local connection to our global customer base. This includes our Global Innovation Center located in Philadelphia, Pennsylvania, which opened in 2018 for global research, product development and technology initiatives.
PATENTS, LICENSES AND TRADEMARKS
As of December 31, 2021, we had a global portfolio of approximately 740 issued patents and more than 480 trademarks. We actively apply for and obtain U.S. and foreign patents and trademarks on new products and process innovations and as of December 31, 2021, approximately 230 patent applications were pending throughout the world.
Our primary purpose in obtaining patents is to protect the results of our research for use in operations and licensing. We are also party to a substantial number of patent licenses and other technology agreements. We have a significant number of trademarks and trademark registrations in the United States and in other countries, as described below.
We own or otherwise have rights to the trademarks, service marks, copyrights and trade names used in conjunction with the marketing and sale of our products and services. These trademarks include Abcite®, Alesta®, AquaEC®, AudurraTM, Centari®, Ceranamel®, ChallengerTM, ChemophanTM, ColorNet®, Corlar®, Cromax®, Cromax Mosaic®, Durapon 70®, DuxoneTM, Harmonized Coating Technologies®, Hydropon®, Imron®, Imron EliteTM, Imron ExcelProTM, LutophenTM, Nap-Gard®, Nason®, Raptor®, Rival®, Spies Hecker®, Standox®, StollaquidTM, SyntopalTM, SyroxTM, U-POLTM, Vermeera® and Voltatex®, which are protected under applicable intellectual property laws and are the property of us and our subsidiaries.
Although we consider that our patents, licenses and trademarks in the aggregate constitute a valuable asset, we do not regard our business as being materially dependent on any single or group of related patents, licenses or trademarks.
JOINT VENTURES
At December 31, 2021 we were party to eight joint ventures, of which three were focused in the industrial end-market, three were focused in the light vehicle end-market and two were focused in the refinish end-market. At December 31, 2021 we were the majority shareholder, and/or exercise control, in six joint ventures, which we consolidated. Our fully consolidated joint venture-related net sales were $80.7 million, $76.3 million, and $254.7 million for the years ended December 31, 2021, 2020 and 2019, respectively. See Part I, Item 1A, "Risk Factors—Risks Related to our Business—Risks Related to Other Aspects of our Business—Our joint ventures may not operate according to our business strategy if our joint venture partners fail to fulfill their obligations".
10
ENVIRONMENTAL, SOCIAL AND GOVERNANCE
During January 2022, we announced a new environmental, social and governance ("ESG") framework, which is structured under three key pillars and the related goals:
•Planet Solutions: Focused on ensuring a more sustainable future for the planet, this first pillar includes a series of goals aimed at improving the Company's environmental performance and reducing the impact of its global operations, including our goals to achieve an absolute reduction of 50 percent of Scope 1 and 2 greenhouse gas (GHG) emissions by 2030, as well as a goal to become carbon neutral in our operations by 2040 – one decade ahead of the deadline set by the Paris Agreement on Climate Change. In addition to these reduction targets, Axalta is taking steps towards our goal of a 10 percent reduction of VOC emissions, process waste, and water use from operations by 2030.
•Business Solutions: This second pillar concentrates on how Axalta's products, services, and technology can help customers design and manufacture their finished products to help accelerate their own sustainability initiatives and achievements. Axalta is committing to deliver sustainability benefits from 80 percent of its new technology and innovation developments by 2030 and increasing, by at least 20 percent, the total percentage of net sales derived from products, services, and tools that offer sustainability benefits.
•People Solutions: Building on Axalta's corporate culture, which is rooted in inclusivity, integrity, safety, and engagement, this third pillar will ensure that the Company continues operating and fostering an environment where all of our people can thrive. The Company is committing to creating a more diverse and inclusive environment that results in increasing the representation of women in management positions globally to at least 30 percent by 2030. Axalta will continue to support its local communities via its Bright Futures Program, which includes STEM and vocational scholarships.
HUMAN CAPITAL RESOURCES
Our success is realized through the engagement and commitment of our people. As of December 31, 2021, we had approximately 13,000 team members, including 12,000 employees and 1,000 contractors, with 25% of our team members based in the U.S. and 75% based in international locations. Our workforce is distributed globally, with approximately 44% in the Americas, 39% in EMEA and 17% in Asia Pacific.
Axalta's ability to attract, develop and retain highly skilled talent requires us to focus on the growth and well-being of each team member. As a global coatings manufacturer, we have a wide range of employees, including but not limited to management professionals, scientists, technicians, engineers, sales, technical, manufacturing operations, supply chain, administrative and customer service personnel. We drive to create a performance-driven culture where employees feel included and find a sense of belonging. It is also important that we provide an environment that fosters inclusivity and embraces diversity where everyone feels they have a voice and their contributions are valued. In support of this, our first all employee engagement survey took place in 2021. Capturing the voice of our employees through this survey provided actionable insights into the specific tools, processes, and other factors that enable our employees to perform at their best.
We strive to provide a wide variety of opportunities for growth for our employees, including online trainings, on-the-job experience, education tuition assistance and financial counseling. We also aim to provide competitive compensation and benefits across all of our global locations.
In addition, the health and well-being of our employees is foundational to Axalta's success. In 2020, we launched "Flex Your Work", a program that is intended to support the work-life balance of our office-based employees by allowing them to work from home up to two days a week. We are also committed to providing a workplace that enables team members to operate safely, including safety protocols to ensure the health and safety of our employees during the COVID-19 pandemic. Safety is ingrained in the way we do business and our safety program is structured on the foundation that every employee is engaged and committed to improving safe operating practices and eliminating injuries. When health and safety incidents do occur, we strive to determine the causes and eliminate the potential for future similar incidents. In 2021, Axalta's injury and illness performance resulted in a 0.24 OSHA Recordable Incident Rate ("TRIR"), compared to the 1.6 OSHA Recordable Incident Rate for the Paint and Coating Manufacturing Industry (according to the US Bureau of Labor Statistics 2020 data). An internal review revealed that, for 2017-2020, we had miscalculated our TRIR. Our TRIR for each of 2017, 2018, 2019 and 2020, as recalculated, was 0.40, 0.46, 0.30 and 0.16, respectively.
The Compensation Committee of our Board of Directors has oversight of the Company's human capital management efforts. The Environment, Health, Safety and Sustainability Committee of our Board of Directors has oversight of the Company's policies to protect the health and safety of our employees and contractors, and this committee regularly reviews data on our safety metrics and performance.
We encourage you to visit the sustainability section, and other sections, of our website for more detailed information regarding our human capital resources, programs, and initiatives. Nothing on our website shall be deemed incorporated by reference into this Annual Report on Form 10-K.
11
REGULATORY COMPLIANCE
Our business is subject to significant regulations in all of the markets that we operate and we are committed to operating our business in compliance with all applicable laws and regulations.
Environmental
We are subject to applicable federal, state, local and foreign laws and regulations relating to environmental protection and workers' safety, including those required by the U.S. Environmental Protection Agency. Our Environment, Health, Safety ("EHS") and Sustainability policies and standards are a key element of the foundation upon which we develop, market, manufacture, and distribute products and services to our global customers. In 2017, we established a Board-level committee responsible for the oversight of our EHS and Sustainability policies, performance, strategy and compliance matters. We operate our manufacturing facilities using a common set of internal standards. These standards support a consistent approach to EHS and Sustainability performance improvement. We strive to assure that all our manufacturing and distribution facilities are operated in compliance in all known material respects to applicable environmental requirements. Investigation, remediation, operation and maintenance costs associated with environmental compliance and management of sites are a normal recurring part of our operations. We do not expect outstanding remediation obligations to have a material impact on our financial position; however, the ultimate cost of remediation is subject to a number of variables and is difficult to accurately predict. We may also incur significant additional costs as a result of contamination that is discovered and/or government required remediation obligations that are imposed at these or other properties in the future.
Non-U.S. Sales
Our non-U.S. sales are subject to both U.S. and non-U.S. governmental regulations and procurement policies and practices, including regulations relating to import-export control, tariffs, investment, exchange controls, anti-corruption and repatriation of earnings. Non-U.S. sales are also subject to varying currency, political and economic risks.
Privacy Regulations
We are also subject to and comply with increasingly complex privacy and data protection laws and regulations in the United States and other jurisdictions. This includes the European Union's General Data Protection Regulation ("GDPR"), which enforces rules relating to the protection of processing and movement of personal data. The interpretation and enforcement of such regulations are continuously evolving and there may be uncertainty with respect to how to comply with them. Noncompliance with GDPR and other data protection laws could result in damage to our reputation and payment of significant monetary penalties.
WHERE YOU CAN FIND MORE INFORMATION
Our website address is www.axalta.com. We post, and shareholders may access without charge, our recent filings and any amendments thereto of our annual reports on Form 10-K, quarterly reports on Form 10-Q and proxy statements as soon as reasonably practicable after such reports are filed with the Securities and Exchange Commission ("SEC"). We also post all financial press releases, including earnings releases, to our website. All other reports filed or furnished to the SEC on the SEC's website, www.sec.gov, including current reports on Form 8-K, are available via direct link on our website. Reference to our and the SEC's websites herein do not incorporate by reference any information contained on those websites and such information should not be considered part of this Form 10-K.
12
ITEM 1A. RISK FACTORS
As a global manufacturer, marketer and distributor of high-performance coatings systems, we operate in a business environment that includes risks. These risks are not unlike the risks we have faced in the recent past nor are they unlike risks faced by our competitors. If any of the events contemplated by the following discussion of risks should occur, our business, results of operations, financial condition and cash flows could suffer materially and adversely. While the factors listed here are considered to be the more significant factors, they should not be considered to be a complete statement of all potential risks and uncertainties. Unlisted factors, including those in other documents we file from time to time with the Securities and Exchange Commission, may materially and adversely affect our businesses, results of operations, financial condition and cash flows.
Risks Related to our Business
Risks Related to Execution of our Strategic and Operating Plans
Our business, results of operations, financial condition, cash flows and stock price has been, and may in the future be, adversely affected by the COVID-19 pandemic.
Axalta continues to monitor closely the impact of COVID-19 on all aspects of our business and geographies, including effects on customers, employees, suppliers, vendors and distribution channels, as well as macroeconomic consequences. COVID-19 has had and may continue to have an adverse impact on demand for our products and, thus, our income from operations. Although we have continued to operate our facilities to date, consistent with applicable governmental orders, the effects of COVID-19 may have a material adverse effect on our operations, supply chain, customers, labor availability and logistics networks, including business shutdowns, employee vaccination requirements or similar mandates and other disruptions. The extent to which COVID-19 may adversely impact our business depends on future developments, which are highly uncertain and unpredictable, the severity and duration of the virus, including novel variants, and the effectiveness of actions taken globally to contain or mitigate its effects, including any ongoing actions in response to changing health conditions over time. Any resulting financial impact cannot be estimated reasonably at this time, but may materially adversely affect our business, results of operations, financial condition and cash flows. Even after the COVID-19 pandemic has subsided, we may experience materially adverse impacts to our business due to any resulting economic recession or depression, as well as other resulting macroeconomic conditions. Additionally, concerns over the economic impact of COVID-19 have caused extreme volatility in financial and other capital markets which has and may continue to adversely impact our stock price and our ability to access to debt financing and capital markets.
Our financial position, results of operations and cash flows could be materially adversely affected by difficult economic conditions, and/or significant volatility in the capital, credit and commodities markets.
Several of the end-markets we serve are cyclical, and macroeconomic and other factors beyond our control could reduce demand from these end-markets for our products, including as a result of depressed demand for our customers' products or services, and materially adversely affecting our business, financial condition and results of operations and cash flows. For example, weak economic and other macroeconomic conditions, such as the semiconductor chip shortage during 2021, has in the past and could in the future depress new car sales and/or production, reducing demand for our light vehicle OEM coatings and limit the growth of the car parc. This could, in turn, cause a related decline in demand for our automotive refinish coatings because, as the age of a vehicle increases, the propensity of car owners to pay for cosmetic repairs generally decreases. Also, during difficult economic times, car owners may refrain from seeking repairs for their damaged vehicles. Similarly, periods of reduced global economic activity could hinder global industrial output, which could decrease demand for our industrial and commercial vehicle coating products.
Our global business is adversely affected by decreases in the general level of economic activity, such as decreases in business and consumer spending, construction activity and industrial manufacturing. Disruptions in the U.S., Europe or other economies, or weakening of emerging markets, such as China, could adversely affect our sales, profitability and/or liquidity.
Further, a tightening of credit in financial markets could adversely affect the ability of our customers and suppliers to obtain financing for significant purchases and operations, could result in a decrease in or cancellation of orders for our products and services and could impact the ability of our customers to make payments owed to us. Similarly, a tightening of credit in financial markets could adversely affect our supplier base and increase the potential for one or more of our suppliers to experience financial distress or bankruptcy.
Improved safety features on vehicles, commercialization of autonomous vehicles, insurance company influence, the introduction of new business models or new methods of travel, and weather conditions may reduce the demand for some of our products and could have a negative effect on our business, financial condition, results of operations and cash flows.
Vehicle manufacturers continue to develop new safety features such as collision avoidance technology and self-driving vehicles that may reduce the rate and amount of vehicle collisions, potentially negatively impacting demand for our refinish
13
coatings. Insurance companies may influence vehicle owners to use body shops that do not use our products, which could also negatively impact demand for our refinish coatings. In addition, through the introduction of new technologies, new business models or new methods of travel, such as ridesharing, the number of automotive OEM new-builds may decline, potentially reducing demand for our automotive OEM coatings. Furthermore, from time to time, weather conditions have an adverse effect on our sales of coatings and related products. For example, unusually mild weather during winter months may lead to fewer vehicle collisions, reducing market demand for our refinish coatings. Any resulting reduction in demand for our refinish coatings could have a material adverse effect on our business, financial condition, results of operations and cash flows.
The loss of or reduced purchases by any of our largest customers, or the consolidation of MSOs, distributors and/or body shops, could adversely affect our business, financial condition, results of operations and cash flows.
We have some customers that purchase a large amount of products from us and we are also reliant on distributors to assist us in selling our products. Our largest single customer accounted for approximately 5% of our 2021 net sales and our largest distributor accounted for approximately 3% of our 2021 net sales. Consolidation of any of our customers, including MSOs, distributors and body shops, could decrease our customer base and impact our results of operations if the resulting business seeks different sales terms or chooses to use one of our competitors for the consolidated business. The loss of any of our large customers or significant changes in their level of purchases, as a result of changes in business conditions, working capital levels, product requirements, consolidation or otherwise, could have a material adverse effect on our business, financial condition, results of operations and cash flows.
We rely on our distributor network and third-party delivery services for the distribution and export of certain of our products. A significant disruption in these services or significant increases in prices for those services may disrupt our ability to export material or increase our costs.
We ship a significant portion of our products to our customers through our distributor network as well as independent third-party delivery companies. If any of our key distributors or third-party delivery providers experiences a significant disruption, our products may not be delivered in a timely fashion. In addition, if our key distributors or third-party delivery providers increase prices and we are not able to pass along these increases to customers, find comparable alternatives or adjust our delivery network, our business, financial condition, results of operations and cash flows could be adversely affected.
Price increases, business and supply chain interruptions, declines in the supply of raw materials or disruptions to our major tolling arrangements could have a significant impact on our ability to grow or sustain earnings.
Our manufacturing processes consume significant amounts of raw materials, the costs of which are subject to change based on fluctuations in worldwide supply and demand as well as other factors beyond our control, including inflationary pressures like those seen during 2021. We use a significant amount of raw materials derived from crude oil and natural gas. As a result, volatile oil and gas prices, as well as other unrelated factors, can cause significant variations in our raw materials costs, affecting our operating results. In rising raw material price environments, we may be unable to pass along these increased costs to our customers. In declining raw material price environments, customers may seek price concessions from us greater than any raw material cost savings we realize. If we are not able to fully offset the effects of higher raw materials costs, or if customers demand greater raw material price concessions than we obtain in low raw material cost environments, our financial results could deteriorate. Additionally, we obtain certain of our raw materials from selected key suppliers. If any sole source supplier of raw materials ceases supplying raw materials to us, or if any of our key suppliers is unable to meet its obligations in a timely fashion or at an acceptable price, or at all, we may be forced to incur higher costs to obtain the necessary raw materials elsewhere or, in limited instances, we may not be able to obtain the necessary raw materials. Additionally, in certain instances, we rely on third parties to toll manufacture certain of our intermediates and products. If any of our key tolling partners cease to provide toll manufacturing services to us, either permanently or temporarily, we would be required to procure alternative manufacturing arrangements, which we may not be able to arrange on a timely basis or at all.
In addition to the risks associated with raw materials prices, supplier capacity constraints, supplier production disruptions, including supply disruptions from our sole source or other key suppliers, supply chain and logistics congestion and disruptions, increasing costs for energy, the unavailability of certain raw materials or disruptions to our key tolling arrangements could result in harm to our manufacturing capabilities or supply imbalances that may have a material adverse effect on our business, financial condition, results of operations and cash flows.
Failure to develop and market new products and manage product life cycles could impact our competitive position and have a material adverse effect on our business, financial condition, results of operations and cash flows.
Our operating results are largely dependent on our development and management of our portfolio of current, new and developing products and services as well as our ability to bring those products and services to market. Difficulties or delays in product development, such as the inability to identify viable new products, successfully complete research and development, obtain relevant regulatory approvals, effectively manage our manufacturing process or costs, obtain intellectual property protection, or gain market acceptance of new products and services could have a material adverse effect on our
14
business, financial condition, results of operations and cash flows. Because of the lengthy and costly development process, technological challenges and intense competition, we cannot assure you that any of the products we are currently developing, or that we may develop in the future, will achieve commercial success. For example, in addition to developing technologically advanced products, commercial success of those products will depend on customer acceptance and implementation of those products as well as the products and services offered and developed by our current and future competitors. A failure to develop commercially successful products or to develop additional uses for existing products could materially adversely affect our business, financial results, results of operations or cash flows. Further, sales of our new products could replace sales of some of our current products, offsetting the benefit of even a successful product introduction.
Risks Related to our Global Operations
As a global business, we are subject to risks associated with our non-U.S. operations that are not present in the United States.
We conduct our business on a global basis, with approximately 64% of our 2021 net sales occurring outside the United States. We anticipate that international sales will continue to represent a substantial portion of our net sales and that our strategy for continued growth and profitability will entail further international expansion, particularly in emerging markets. Changes in local and regional economic conditions could affect product demand in our non-U.S. operations. Specifically, our financial results could be affected by changes in trade, monetary and fiscal policies, laws and regulations, or other activities of U.S. and non-U.S. governments, agencies and similar organizations. These conditions include, but are not limited to, changes in a country's or region's social, economic or political conditions, trade regulations affecting production, pricing and marketing of products, local labor conditions and regulations, reduced protection of intellectual property rights, changes in the regulatory or legal environment, restrictions on currency exchange activities, burdensome taxes and tariffs and other trade barriers, as well as the imposition of economic or other trade sanctions, each of which could impact our ability to do business in certain jurisdictions or with certain persons. For example, the U.S. government has taken actions or made proposals that are intended to address trade imbalances or trade practices, specifically with China, among other countries, which include encouraging increased production in the United States. These actions and proposals have resulted or could result in increased customs duties and the renegotiation of some U.S. trade agreements, as well as other retaliatory actions.
Risks Related to Legal and Regulatory Compliance and Litigation
Our failure to comply with the anti-corruption laws of the United States and various international jurisdictions could negatively impact our reputation and results of operations.
Doing business on a global basis requires us to comply with the laws and regulations of the U.S. government and those of various international and sub-national jurisdictions, and our failure to successfully comply with these rules and regulations may expose us to liabilities which may be significant. These laws and regulations apply to companies, individual directors, officers, employees and agents, and may restrict our operations, trade practices, investment decisions and partnering activities. In particular, our international operations are subject to U.S. and foreign anti-corruption laws and regulations, such as the U.S. Foreign Corrupt Practices Act (the "FCPA"), the United Kingdom Bribery Act 2010 (the "Bribery Act") as well as anti-corruption laws of the various jurisdictions in which we operate. The FCPA, the Bribery Act and other laws prohibit us and our officers, directors, employees and agents acting on our behalf from corruptly offering, promising, authorizing or providing anything of value to foreign officials for the purposes of influencing official decisions or obtaining or retaining business or otherwise obtaining favorable treatment. As part of our business, we may, from time to time, deal with state-owned business enterprises, the employees and representatives of which may be considered foreign officials for purposes of the FCPA or the Bribery Act. We are subject to the jurisdiction of various governments and regulatory agencies outside of the U.S., which may bring our personnel into contact with foreign officials responsible for issuing or renewing permits, licenses or approvals or for enforcing or overseeing other governmental regulations. In addition, some of the international locations in which we operate lack a developed legal system and have elevated levels of corruption. Our global operations expose us to the risk of violating, or being accused of violating, the foregoing or other anti-corruption laws. Such violations could be punishable by criminal fines, imprisonment, civil penalties, disgorgement of profits, injunctions and exclusion from government contracts, as well as other remedial measures. Investigations of alleged violations can be very expensive, disruptive and damaging to our reputation. Although we have implemented anti-corruption policies and procedures and provide training on these matters, there can be no guarantee that these policies, procedures and training will effectively prevent violations by our employees or representatives in the future. Additionally, we face a risk that our distributors and other business partners may violate the FCPA, the Bribery Act or similar laws or regulations. Such violations could expose us to FCPA and Bribery Act liability and/or our reputation may potentially be harmed by their violations and resulting sanctions and fines.
Evolving environmental, safety or other regulations and laws could have a material adverse effect on our business and consolidated financial condition.
Our manufacturing activities and products, both in and outside of the U.S., are subject to regulation by various federal, state, provincial and local laws, regulations and government agencies, including the U.S. Environmental Protection Agency, as well
15
as other authorities both inside and outside of the U.S. In addition, legal and regulatory systems in emerging and developing markets may be less developed, and less certain. Laws and regulations, and the interpretation and enforcement thereof, may change as a result of a variety of factors, including political, economic, regulatory or social events. The specific impact of changing laws and regulations, or the interpretation or enforcement of current or future laws and regulations, on our business may vary depending on a number of factors. As a result of changing laws and regulations, or the interpretation or enforcement of current or future laws and regulations, we may be required to make expenditures to modify operations, relocate operations, perform site cleanups or other environmental remediation, or curtail or cease operations, which could have a material adverse effect on our business, financial condition, results of operations and cash flows.
As a result of our current and past operations and/or products, including operations and/or products related to our businesses prior to the Acquisition, we could incur significant environmental liabilities and costs.
We are subject to various laws and regulations around the world governing the protection of the environment and health and safety, including the discharge of pollutants to air and water and the management and disposal of hazardous substances. These laws and regulations not only govern our current operations and products, but also impose potential liability on us for our or our predecessors' past operations. We could incur fines, penalties and other sanctions as a result of violations of such laws and regulations. In addition, as a result of our operations and/or products, including our past operations and/or products related to our businesses prior to the acquisition of DuPont Performance Coatings ("DPC"), a business formerly owned by E. I. du Pont de Nemours and Company ("DuPont"), including certain assets of DPC and all of the capital stock and other equity interests of certain entities engaged in the DPC business (the "Acquisition"), we could incur substantial costs, including costs relating to remediation and restoration activities and third-party claims for property damage or personal injury. The ultimate costs under environmental laws and the timing of these costs are difficult to accurately predict. Our accruals for costs and liabilities at sites where contamination is being investigated or remediated may not be adequate because the estimates on which the accruals are based depend on a number of factors, including the nature of the matter, the complexity of the site, site geology, the nature and extent of contamination, the type of remedy, the outcome of discussions with regulatory agencies and, at multi-party sites, other Potentially Responsible Parties ("PRPs") and the number and financial viability of other PRPs. Additional contamination may also be identified, and/or additional cleanup obligations may be incurred, at these or other sites in the future. For example, periodic monitoring or investigation activities are ongoing at a number of our sites where contaminants have been detected or are suspected, and we may incur additional costs if more active or extensive remediation is required. In addition, in connection with the Acquisition, DuPont has, subject to certain exceptions and exclusions, agreed to indemnify us for certain liabilities relating to environmental remediation obligations and certain claims relating to the exposure to hazardous substances and products manufactured prior to our separation from DuPont. We could incur material additional costs if DuPont fails to meet its obligations, if the indemnification proves insufficient or if we otherwise are unable to recover costs associated with such liabilities. The costs of our current operations, complying with complex environmental laws and regulations, as well as internal voluntary programs, are significant and will continue to be so for the foreseeable future as environmental regulations become more stringent. We cannot predict the impact that changing climate conditions or more frequent and severe weather events, if any, will have on our business, results of operations, financial condition or cash flows. Moreover, we cannot predict how legal, regulatory and social responses to concerns about global climate change will impact our business.
We handle and transport certain materials that are inherently hazardous due to their toxic nature.
In our business, we handle and transport hazardous materials. If mishandled or released into the environment, these materials could cause substantial property damage or personal injuries resulting in significant legal claims against us. In addition, evolving regulations concerning the handling and transportation of certain materials could result in increased future capital or operating costs.
Our results of operations could be adversely affected by litigation and claims.
We face risks arising from various litigation matters and other claims that have been asserted against us or that may be asserted against us in the future, including, but not limited to, claims for product liability, patent and trademark infringement, antitrust, warranty, contract and third-party property damage or personal injury, including claims arising from the matters described in Note 6 to our consolidated financial statements included elsewhere in the Annual Report on Form 10-K. For instance, we have noted a nationwide trend in purported class actions against chemical manufacturers generally seeking relief such as medical monitoring, property damages, off-site remediation and punitive damages arising from alleged environmental torts without claiming present personal injuries. We have also noted a trend in public and private nuisance suits being filed on behalf of states, counties, cities and utilities alleging harm to the general public. In addition, various factors or developments can lead to changes in current estimates of liabilities such as a final adverse judgment, significant settlement or changes in applicable law. A future adverse ruling or unfavorable development could result in future charges that could have a material adverse effect on us. An adverse outcome in any one or more of these matters could be material to our business, financial condition, results of operations and cash flows. In particular, product liability claims, regardless of their merits, could be costly, divert management's attention and adversely affect our reputation and demand for our products.
16
Risks Related to Human Resources
If we are required to make unexpected payments to any pension plans applicable to our employees, our financial condition may be adversely affected.
We have defined benefit pension plans in which many of our current and former employees outside the U.S. participate or have participated. Many of these plans are underfunded or unfunded and the liabilities in relation to these plans will need to be satisfied as they mature from our operating reserves. In jurisdictions where the defined benefit pension plans are intended to be funded with assets in a trust or other funding vehicle, the liabilities exceed the corresponding assets in many of the plans. Various factors, such as changes in actuarial estimates and assumptions (including as to life expectancy, discount rates and rate of return on assets) as well as changes in asset allocations and actual return on assets, can increase the expenses and liabilities of the defined benefit pension plans. The assets and liabilities of the plans must be valued from time to time under applicable funding rules and as a result we may be required to increase the cash payments we make in relation to these defined benefit pension plans.
Our financial condition, results of operations and cash flows may be adversely affected to the extent that we are required to make any additional payments to any relevant defined benefit pension plans in excess of the amounts assumed in our current projections and assumptions or report higher pension plan expenses under relevant accounting rules.
We are subject to work stoppages, union negotiations, labor disputes and other matters associated with our labor force, which may adversely impact our operations and cause us to incur incremental costs.
Many of our employees globally are in unions or otherwise covered by labor agreements, including works councils. As of December 31, 2021, substantially all of our U.S. workforce was not unionized and approximately half of our workforce outside the U.S. was unionized or otherwise covered by labor agreements. Consequently, we may be subject to potential union campaigns, work stoppages, union negotiations and other potential labor disputes. Additionally, negotiations with unions or works councils in connection with existing labor agreements may result in significant increases in our cost of labor, limit our ability to restructure or manage our operations, divert management's attention away from operating our business or break down and result in the disruption of our operations. The occurrence of any of the preceding outcomes could impair our ability to manufacture our products and result in increased costs and/or worsened operating results. Further, we may be impacted by work stoppages at our suppliers or customers that are beyond our control.
We may not be able to recruit and retain the experienced and skilled personnel we need to compete.
Our future success depends on our ability to attract, retain, develop and motivate highly skilled personnel. We must have talented personnel to succeed and competition for management and skilled employees in our industry is intense. Our ability to meet our performance and growth goals depends upon the personal efforts and abilities of our management and skilled employees. We cannot assure you that we will retain or successfully recruit senior management, or that their services will remain available to us. We also cannot assure you that we will successfully respond to changing employee preferences spurred by the COVID-19 pandemic. Failures in these areas could adversely affect our business, financial condition, results of operations and cash flows.
Risks Related to Intellectual Property
Our inability to protect and enforce our intellectual property rights could adversely affect our financial results.
Intellectual property rights both in the U.S. and in foreign countries, including patents, trade secrets, confidential information, trademarks and trade names, are important to our business and will be critical to our ability to grow and succeed in the future. We make strategic decisions on whether to apply for intellectual property protection and what kind of protection to pursue based on a cost benefit analysis. While we endeavor to protect our intellectual property rights in certain jurisdictions in which our products are produced or used and in jurisdictions into which our products are imported, the decision to file for intellectual property protection is made on a case-by-case basis. Because of the differences in foreign trademark, patent and other laws concerning intellectual property rights, our intellectual property rights may not receive the same degree of protection in foreign countries as they would in the U.S. Our failure to obtain or maintain adequate protection of our intellectual property rights for any reason could have a material adverse effect on our business, financial condition, results of operations and cash flows.
We have applied for patent protection relating to certain existing and proposed products, processes and services in certain jurisdictions. While we generally consider applying for patents in those countries where we intend to make, have made, use or sell patented products, we may not accurately assess all of the countries where patent protection will ultimately be desirable. If we fail to timely file a patent application in any such country, we may be precluded from doing so at a later date. Furthermore, we cannot assure you that our pending patent applications will not be challenged by third parties or that such applications will eventually be issued by the applicable patent offices as patents. We also cannot assure you that the patents issued as a result of our foreign patent applications will have the same scope of coverage as our U.S. patents. It is possible
17
that only a limited number of the pending patent applications will result in issued patents, which may have a materially adverse effect on our business and results of operations.
The patents we own could be challenged, invalidated or circumvented by others and may not be of sufficient scope or strength to provide us with any meaningful protection or commercial advantage. Furthermore, our existing patents are subject to challenges from third parties that may result in invalidations and will all eventually expire, after which we will not be able to prevent our competitors from using our previously patented technologies, which could materially adversely affect our competitive advantage stemming from the applicable products and technologies. We also cannot assure you that competitors will not infringe our patents, or that we will have adequate resources to enforce our patents.
We also rely on unpatented proprietary technology. It is possible that others will independently develop the same or similar technology or otherwise obtain access to our unpatented technology. To protect our trade secrets and other proprietary information, we require certain employees, consultants, advisors and collaborators to enter into confidentiality agreements as we deem appropriate. We cannot assure you that we will be able to enter into these confidentiality agreements or that these agreements will provide meaningful protection for our trade secrets, know-how or other proprietary information in the event of any unauthorized use, misappropriation or disclosure of such trade secrets, know-how or other proprietary information. If we are unable to maintain the proprietary nature of our technologies, we could be materially adversely affected.
We rely on our trademarks, trade names and brand names to distinguish our products from the products of our competitors and have registered or applied to register many of these trademarks. We cannot assure you that our trademark applications will be approved. Third parties may also oppose our trademark applications, or otherwise challenge our use of the trademarks. In the event that our trademarks are successfully challenged, we could be forced to rebrand our products, which could result in loss of brand recognition, and could require us to devote resources to advertising and marketing new brands. Further, we cannot assure you that competitors will not infringe our trademarks, or that we will have adequate resources to enforce our trademarks. We also license certain of our trademarks for use by third parties. In an effort to preserve our trademark rights, we enter into license agreements with these third parties that govern the use of our trademarks and contain limitations on their use. Although we make efforts to police the use of our trademarks by our licensees, we cannot assure you that these efforts will be sufficient to ensure that our licensees abide by the terms of their licenses. In the event that our licensees fail to do so, our trademark rights could be diluted.
If we are sued for infringing intellectual property rights of third parties, it may be costly and time consuming, and an unfavorable outcome in any litigation could harm our business.
We cannot assure you that our activities will not, unintentionally or otherwise, infringe on the patents, trademarks or other intellectual property rights owned by others. We may spend significant time and effort and incur significant litigation costs if we are required to defend ourselves against claims of intellectual property rights infringement brought against us, regardless of whether the claims have merit. If we are found to have infringed on the patents, trademarks or other intellectual property rights of others, we may be subject to substantial claims for damages, which could materially impact our cash flow, business, financial condition and results of operations. We may also be required to cease development, use or sale of the relevant products or processes, or we may be required to obtain a license on the disputed rights, which may not be available on commercially reasonable terms, if at all.
Risks Related to Other Aspects of our Business
We may continue to engage in acquisitions and divestitures, and may encounter difficulties integrating acquired businesses with, or disposing of divested businesses from, our current operations and, as a result, we may not realize the anticipated benefits of these acquisitions and divestitures.
We may continue to seek to grow through strategic acquisitions, joint ventures or other arrangements. Our due diligence reviews in these transactions may not identify all of the material issues necessary to accurately estimate the cost or potential loss contingencies with respect to a particular transaction, including potential exposure to regulatory sanctions resulting from a counterparty's previous activities. We may incur unanticipated costs or expenses, including post-closing asset impairment charges, expenses associated with eliminating duplicate facilities, litigation and other liabilities. We may also face regulatory scrutiny as a result of perceived concentration in certain markets, which could cause additional delay or prevent us from completing certain acquisitions that would be beneficial to our business. We may also encounter difficulties in integrating acquisitions with our operations, applying our internal controls processes to these acquisitions or in managing strategic investments. Additionally, we may not achieve the benefits, including synergies and cost savings, we anticipate when we first enter into a transaction in the amount or on the timeframe anticipated. Any of the foregoing could adversely affect our business and results of operations. In addition, accounting requirements relating to business combinations, including the requirement to expense certain acquisition costs as incurred, may cause us to experience greater earnings volatility and generally lower earnings during periods in which we acquire new businesses. Furthermore, we may make strategic divestitures from time to time. These divestitures may result in continued financial involvement in the divested businesses, such as through indemnities, guarantees or other financial arrangements. These arrangements could result in financial obligations imposed upon us and could affect our future financial condition, results of operations and cash flows.
18
Acquisitions and divestitures may also require us to devote significant internal resources and could divert management's attention away from operating our business.
Our joint ventures may not operate according to our business strategy if our joint venture partners fail to fulfill their obligations.
As part of our business, we have entered into certain, and may in the future enter into additional, joint venture arrangements. The nature of a joint venture requires us to share control over significant decisions with unaffiliated third parties. Since we may not exercise control over our current or future joint ventures, we may not be able to require our joint ventures to take actions that we believe are necessary to implement our business strategy. Additionally, differences in views among joint venture participants may result in delayed decisions or failures to agree on major issues. If these differences cause the joint ventures to deviate from our business strategy, our results of operations could be materially adversely affected.
DuPont's potential breach of its obligations in connection with the Acquisition, including failure to comply with its indemnification obligations, may materially affect our business and operating results.
Although the Acquisition closed on February 1, 2013, DuPont still has performance obligations to us, including fulfilling certain indemnification requirements. We could incur material additional costs if DuPont fails to meet its obligations or if we otherwise are unable to recover costs associated with such liabilities.
We may be classified as a passive foreign investment company, which could result in adverse U.S. federal income tax consequences to U.S. holders of our common shares.
Based on the market price of our common shares and the composition of our income, assets and operations, we do not expect to be treated as a passive foreign investment company ("PFIC") for U.S. federal income tax purposes for the current taxable year or in the foreseeable future. However, the application of the PFIC rules is subject to uncertainty in several respects, and we cannot assure you the U.S. Internal Revenue Service will not take a contrary position. Furthermore, this is a factual determination that must be made annually after the close of each taxable year. If we are a PFIC for any taxable year during which a U.S. person holds our common shares, certain adverse U.S. federal income tax consequences could apply to such U.S. person.
Risks Related to our Indebtedness
Our substantial indebtedness could adversely affect our ability to raise additional capital to fund our operations, limit our ability to react to changes in the economy and our industry and our flexibility in managing our business, expose us to interest rate risk to the extent of our variable rate debt and prevent us from meeting our obligations with respect to our indebtedness.
As of December 31, 2021, we had approximately $3.8 billion of indebtedness on a consolidated basis. As of December 31, 2021, we were in compliance with all of the covenants under our outstanding debt instruments. We are more leveraged than some of our competitors, which could adversely affect our business plans.
Our substantial indebtedness could have important consequences to you. For example, it could:
•limit our ability to obtain additional financing to fund future working capital, capital expenditures, acquisitions, general corporate purposes or other purposes;
•require us to devote a substantial portion of our annual cash flow to the payment of interest on our indebtedness;
•expose us to the risk of increased interest rates as, over the term of our debt, the interest cost on a significant portion of our indebtedness is subject to changes in interest rates;
•limit our ability to repurchase our common shares or pay dividends;
•hinder our ability to adjust rapidly to changing market conditions;
•limit our flexibility in managing our business through our obligation to comply with customary financial and other covenants in the indentures governing our Senior Notes and the credit agreement governing our Senior Secured Credit Facilities, which covenants are described in further detail in Note 18 to our consolidated financial statements included elsewhere in this Annual Report on Form 10-K;
•limit our ability to secure adequate bank financing in the future with reasonable terms and conditions or at all; and
•increase our vulnerability to and limit our flexibility in planning for, or reacting to, a potential downturn in general economic conditions or in one or more of our businesses.
19
To service all of our indebtedness, we will require a significant amount of cash and our ability to generate cash depends on many factors beyond our control.
As described below in "Risks Related to Ownership of our Common Shares," our ability to generate cash is dependent on the earnings and receipt of funds from our subsidiaries and joint ventures, which businesses are subject to prevailing economic and competitive conditions and to financial, business, legislative, regulatory and other factors beyond our control. Our business may not generate sufficient cash flow from operations and future borrowings may not be available under our Senior Secured Credit Facilities in an amount sufficient to enable us to pay the principal, premium, if any, and interest on our indebtedness, or to fund our other liquidity needs, including planned capital expenditures. In such circumstances, we may need to refinance all or a portion of our indebtedness on or before maturity. We may not be able to refinance any of our indebtedness on commercially reasonable terms or at all. If we cannot service our indebtedness, we may have to take actions such as selling assets, issuing additional equity or reducing or delaying capital expenditures, strategic acquisitions and investments. Such actions, if necessary, may not be effected on commercially reasonable terms or at all. The instruments governing our indebtedness restrict our ability to sell assets and our use of the proceeds from such sales, and we may not be able to consummate those dispositions or to obtain proceeds in an amount sufficient to meet any debt service obligations then due.
If we are unable to generate sufficient cash flow or are otherwise unable to obtain funds necessary to meet required payments of principal, premium, if any, and interest on our indebtedness, or if we otherwise fail to comply with the various covenants in the instruments governing our indebtedness, we could be in default under the terms of the agreements governing such indebtedness, and we may not be able to obtain waivers of such defaults from our lenders. In the event of such un-waived default, the holders of such indebtedness could elect to declare all the funds borrowed thereunder to be due and payable, together with accrued and unpaid interest, the lenders under our Revolving Credit Facility could elect to terminate their commitments thereunder, cease making further loans and institute foreclosure proceedings against our assets, and we could be forced into bankruptcy or liquidation.
Despite our current level of indebtedness and restrictive covenants, we and our subsidiaries may incur additional indebtedness. This could further exacerbate the risks associated with our substantial financial leverage.
We and our subsidiaries may incur significant additional indebtedness under the agreements governing our indebtedness. Although the indentures governing the Senior Notes and the credit agreement governing our Senior Secured Credit Facilities contain restrictions on the incurrence of additional indebtedness, these restrictions are subject to a number of thresholds, qualifications and exceptions, and the additional indebtedness incurred in compliance with these restrictions could be substantial. Additionally, these restrictions also will not prevent us from incurring obligations that, although preferential to our common shares in terms of payment, do not constitute indebtedness.
In addition, if new debt is added to our and/or our subsidiaries' debt levels, the related risks that we now face as a result of our leverage would intensify. See Part II, Item 7, "Management's Discussion and Analysis of Financial Condition and Results of Operations—Liquidity and Capital Resources—Financial Condition."
We are dependent upon our lenders for financing to execute our business strategy and meet our liquidity needs. If our lenders are unable or unwilling to fund borrowings under their credit commitments or we are unable to borrow, it could negatively impact our business.
We are dependent upon our lenders for financing to execute our business strategy and meet our liquidity needs. If our lenders are unable to fund borrowings under their credit commitments or we are unable to borrow from them for any reason, our business could be negatively impacted. During periods of volatile credit markets, there is risk that any lenders, even those with strong balance sheets and sound lending practices, could fail or refuse to honor their legal commitments and obligations under existing credit commitments, including, but not limited to, extending credit up to the maximum permitted by a credit facility, allowing access to additional credit features and otherwise accessing capital and/or honoring loan commitments. If our lenders are unable or unwilling to fund borrowings under their revolving credit commitments or we are unable to borrow from them, it could be difficult in such environments to obtain sufficient liquidity to meet our operational needs.
Our ability to obtain additional capital on commercially reasonable terms may be limited.
Although we believe our cash and cash equivalents, together with cash we expect to generate from operations and unused capacity available under our Revolving Credit Facility, provide adequate resources to fund ongoing operating requirements, we may need to seek additional financing to compete effectively.
20
If we are unable to obtain capital on commercially reasonable terms, it could:
•reduce funds available to us for purposes such as working capital, capital expenditures, research and development, strategic acquisitions and other general corporate purposes;
•restrict our ability to introduce new products or exploit business opportunities;
•increase our vulnerability to economic downturns and competitive pressures in the markets in which we operate; and
•place us at a competitive disadvantage.
Difficult and volatile conditions in the capital, credit and commodities markets and in the overall economy could have a material adverse effect on our financial position, results of operations and cash flows.
Difficult global economic conditions, including significant volatility in the capital, credit and commodities markets, low levels of business and consumer confidence and high levels of unemployment in certain parts of the world, could have a material adverse effect on our financial position, results of operations and cash flows. The difficult conditions in these markets and the overall economy affect our business in a number of ways. For example:
•as a result of the volatility in commodity prices, we may encounter difficulty in achieving sustained market acceptance of past or future price increases;
•under difficult market conditions there can be no assurance that borrowings under our Revolving Credit Facility would be available or sufficient, and in such a case, we may not be able to successfully obtain additional financing on reasonable terms, or at all;
•in order to respond to market conditions, we may need to seek waivers from the applicability of various provisions in the credit agreement governing our Senior Secured Credit Facilities or the indentures governing the Senior Notes, and in such case, there can be no assurance that we can obtain such waivers at a reasonable cost, if at all;
•market conditions could cause the counter-parties to the derivative financial instruments we may use to hedge our exposure to interest rate, commodity or currency fluctuations to experience financial difficulties and, as a result, our efforts to hedge these exposures could prove unsuccessful and, furthermore, our ability to engage in additional hedging activities may decrease or become more costly; and
•market conditions could result in our key customers experiencing financial difficulties and/or electing to limit spending, which in turn could result in decreased sales and earnings for us.
In general, downturns in economic conditions can cause fluctuations in demand for our and our customers' products, product prices, volumes and margins. A decline in the demand for our products or a shift to lower-margin products due to deteriorating economic conditions could have a material adverse effect on our financial condition, results of operations and cash flows and could also result in impairments of certain of our assets. We do not know if market conditions or the state of the overall economy will continue to improve in the near future. We cannot provide assurance that a continuation of current economic conditions or a further economic downturn in one or more of the geographic regions in which we sell our products would not have a material adverse effect on our business, financial condition and results of operations.
We are subject to risks associated with the current interest rate environment and, to the extent we use debt to fund our operations, changes in interest rates will affect our cost of debt.
A substantial portion of our indebtedness bears interest at variable rates, including LIBOR, which is the subject of recent proposals for reform. After years of preparation and signaling, on March 5, 2021, the ICE Benchmark Administrator ("IBA"), LIBOR's administrator, announced that it would permanently cease to publish some LIBOR settings after December 31, 2021 and cease to publish all other LIBOR settings after June 30, 2023. Uncertainty remains as to whether the United Kingdom's Financial Conduct Authority ("FCA"), LIBOR's regulator, will use its legal powers to require IBA to continue to publish certain USD LIBOR settings after June 30, 2023. Financial regulators across the globe have begun to advise against the use by regulated financial institutions of LIBOR in new contracts, subject to certain exceptions. For example, the five federal financial institution regulatory agencies in the United States have issued supervisory guidance that, among other things, strongly discourages regulated institutions from entering into new LIBOR-based contracts after December 31, 2021. While certain replacement rates for LIBOR have gained market traction in certain jurisdictions, for example, the Secured Overnight Financing Rate ("SOFR") in the United States and the Sterling Overnight Interbank Average Rate ("SONIA") in the United Kingdom, uncertainty remains as to future interest rate benchmarks in global markets, and, as such, the potential effect of the LIBOR transition on our cost of debt cannot yet be determined.
Risks Related to Ownership of our Common Shares
Axalta Coating Systems Ltd. is a holding company with no operations of its own. Because our operations are conducted almost entirely through our subsidiaries and joint ventures, we are largely dependent on our receipt of distributions and
21
dividends or other payments from our subsidiaries and joint ventures for cash to fund all of our operations and expenses, including to make future dividend payments, if any.
Our operations are conducted almost entirely through our subsidiaries and joint ventures and our ability to generate cash to meet our debt service obligations or to make future dividend payments, if any, is highly dependent on the earnings and the receipt of funds from our subsidiaries in the form of dividends, loans or advances and through repayment of loans or advances from us. Payments to us by our subsidiaries and joint ventures will be contingent upon our subsidiaries' or joint ventures' earnings and other business considerations and may be subject to statutory or contractual restrictions. In addition, there may be significant tax and other legal restrictions on the ability of foreign subsidiaries or joint ventures to remit money to us. Any payment of distributions, loans or advances to and from our subsidiaries and joint ventures could be subject to restrictions on or taxation of, dividends or repatriation of earnings under applicable local law, monetary transfer restrictions, foreign currency exchange regulations in the jurisdictions in which our subsidiaries operate or other restrictions imposed by current or future agreements, including debt instruments, to which our non-U.S. subsidiaries may be a party. In particular, our operations in Brazil, China and India where we maintain local currency cash balances are subject to import authorization or pricing controls.
The price of our common shares may fluctuate significantly, and you could lose all or part of your investment.
Volatility in the market price of our common shares may prevent you from being able to sell your common shares at or above the price you paid for your common shares. The market price of our common shares could fluctuate significantly for various reasons, including the realization of any risks described under this "Risk Factors" section.
In addition, over the past several years, the stock markets have experienced significant price and volume fluctuations. This volatility has had a significant impact on the market price of securities issued by many companies, including companies in our industry. The changes frequently appear to occur without regard to the operating performance of the affected companies. Hence, the price of our common shares could fluctuate based upon factors that have little or nothing to do with our Company, and these fluctuations could materially reduce our share price and cause you to lose all or part of your investment. Further, in the past, market fluctuations and price declines in a company's stock have led to securities class action litigation. If such a suit were to arise, it could have a substantial cost and divert our resources regardless of the outcome.
We do not expect to pay dividends on our common shares and, consequently, your ability to achieve a return on your investment will depend on appreciation in the price of our common shares.
At this time, we currently do not declare and pay dividends on our common shares. Therefore, the success of an investment in our common shares will depend upon any future appreciation in their value. There is no guarantee that our common shares will appreciate in value or even maintain the price at which our shareholders have purchased their shares. The payment of future dividends, however, will be at the discretion of our Board of Directors and will depend on, among other things, our earnings, financial condition, capital requirements, level of indebtedness, statutory and contractual restrictions applying to the payment of dividends and other relevant considerations. The credit agreement governing our Senior Secured Credit Facilities and the indentures governing the Senior Notes also limit our ability to pay dividends. In addition, Bermuda law imposes requirements that may restrict our ability to pay dividends to holders of our common shares. As a consequence of these limitations and restrictions, we may not be able to make, or may have to reduce or eliminate, the payment of dividends on our common shares.
Future sales of our common shares in the public market could lower our share price, and any additional capital raised by us through the sale of equity or convertible debt securities may dilute your ownership in us and may adversely affect the market price of our common shares.
We and our shareholders may sell additional common shares in subsequent offerings. We may also issue additional common shares or convertible debt securities. As of February 10, 2022, we had 1,000,000,000 common shares authorized and 224,532,960 common shares outstanding.
We cannot predict the size of future issuances or sales of our common shares or the effect, if any, that future issuances and sales of our common shares will have on the market price of our common shares. Sales of substantial amounts of our common shares (including sales by members of management and shares that may be issued in connection with an acquisition), or the perception that such sales could occur, may adversely affect prevailing market prices for our common shares. See Part III, Item 13, "Certain Relationships and Related Transactions and Director Independence."
We are a Bermuda company and it may be difficult for you to enforce judgments against us or our directors and executive officers.
We are a Bermuda exempted company. As a result, the rights of our shareholders are governed by Bermuda law and our memorandum of association and bye-laws. The rights of shareholders under Bermuda law may differ from the rights of shareholders of companies incorporated in another jurisdiction, and a substantial portion of our assets are located outside the U.S. As a result, it may be difficult for investors to effect service of process on those persons in the U.S. or to enforce in the U.S. judgments obtained in U.S. courts against us or those persons based on the civil liability provisions of the U.S. securities
22
laws. It is doubtful whether courts in Bermuda will enforce judgments obtained in other jurisdictions, including the United States, against us or our directors or officers under the securities laws of those jurisdictions or entertain actions in Bermuda against us or our directors or officers under the securities laws of other jurisdictions.
Bermuda law differs from the laws in effect in the U.S. and may afford less protection to our shareholders.
We are organized under the laws of Bermuda. As a result, our corporate affairs are governed by the Companies Act 1981 (the "Companies Act"), which differs in some material respects from laws typically applicable to U.S. corporations and shareholders, including the provisions relating to interested directors, amalgamations, mergers and acquisitions, takeovers, shareholder lawsuits and indemnification of directors. Generally, the duties of directors and officers of a Bermuda company are owed to the company only. Shareholders of Bermuda companies typically do not have rights to take action against directors or officers of the company and may only do so in limited circumstances. Shareholder class actions are not available under Bermuda law. The circumstances in which shareholder derivative actions may be available under Bermuda law are substantially more limiting and less clear than they would be to shareholders of U.S. corporations. The Bermuda courts, however, would ordinarily be expected to permit a shareholder to commence an action in the name of a company to remedy a wrong to the company where the act complained of is alleged to be beyond the corporate power of the company or illegal, or would result in the violation of the company's memorandum of association or bye-laws. Furthermore, consideration would be given by a Bermuda court to acts that are alleged to constitute a fraud against the minority shareholders or, for instance, where an act requires the approval of a greater percentage of the company's shareholders than those who actually approved it.
When the affairs of a company are being conducted in a manner that is oppressive or prejudicial to the interests of some shareholders, one or more shareholders may apply to the Supreme Court of Bermuda, which may make such order as it sees fit, including an order regulating the conduct of the company's affairs in the future or ordering the purchase of the shares of any shareholders by other shareholders or by the company. Additionally, under our bye-laws and as permitted by Bermuda law, each shareholder has waived any claim or right of action against our directors or officers for any action taken by directors or officers in the performance of their duties, except for actions involving fraud or dishonesty. In addition, the rights of our shareholders and the fiduciary responsibilities of our directors under Bermuda law are not as clearly established as under statutes or judicial precedent in existence in jurisdictions in the U.S., particularly the State of Delaware. Therefore, our shareholders may have more difficulty protecting their interests than would shareholders of a corporation incorporated in a jurisdiction within the U.S.
We have anti-takeover provisions in our bye-laws that may discourage a change of control.
Our bye-laws contain provisions that could make it more difficult for a third party to acquire us without the consent of our Board of Directors, including that directors may only be removed for cause and our Board of Directors can determine the powers, preferences and rights of our preference shares and to issue the preference shares without shareholder approval.
These anti-takeover defenses could discourage, delay or prevent a transaction involving a change in control of our Company and may prevent our shareholders from receiving the benefit from any premium to the market price of our common shares offered by a bidder in a takeover context. Even in the absence of a takeover attempt, the existence of these provisions may adversely affect the prevailing market price of our common shares if the provisions are viewed as discouraging takeover attempts in the future. These provisions could also discourage proxy contests, make it more difficult for you and other shareholders to elect directors of your choosing and cause us to take corporate actions other than those you desire.
General Risk Factors
We may be unable to successfully execute on our growth initiatives, business strategies or operating plans.
We are executing on a number of growth initiatives, strategies and operating plans designed to enhance our business, including productivity enhancements and cost reduction. The anticipated benefits from these efforts are based on several assumptions that may prove to be inaccurate. A variety of risks could cause us not to realize some or all of the expected benefits, including growth and cost savings. These risks include, among others, delays in the anticipated timing of activities related to such growth initiatives, strategies and operating plans; increased difficulty and cost in implementing these efforts; and the incurrence of other unexpected costs associated with operating the business. Further, our continued implementation of these programs may disrupt our operations and performance. As a result, we cannot assure you that we will realize these benefits. If, for any reason, the benefits we realize are less than our estimates or the implementation of these growth initiatives, strategies and operating plans adversely affect our operations or cost more or take longer to effectuate than we expect, or if our assumptions prove inaccurate, our results of operations may be materially adversely affected. From time to time, we may commence operations at new manufacturing facilities and cease operations at existing manufacturing facilities, including through relocating, eliminating or utilizing alternative sources for such operations. We may not be able to successfully commence such new operations or cease such existing operations and our failure to successfully do so could have a material adverse impact on our business results.
23
Increased competition may adversely affect our business, financial condition, results of operations and cash flows.
As described in greater detail in the "Performance Coatings Competition" section on page 7 and the "Mobility Coatings Competition" section on page 9, we face substantial competition from many international, national, regional and local competitors of various sizes in the manufacturing, distribution and sale of our coatings and related products. Our inability to compete successfully could have a material adverse effect on our business, financial condition, results of operations and cash flows.
We take on credit risk exposure from our customers in the ordinary course of our business.
We routinely offer customers pre-bates, loans and other financial incentives to purchase our products. These arrangements generally obligate the customer to purchase products from us and/or repay us such incentives. In the event that a customer is unwilling or unable to fulfill its obligations under these arrangements, we may incur a financial loss. In addition, in the ordinary course of our business, we guarantee certain of our customers' obligations to third parties. Any default by our customers on their obligations could force us to make payments to the applicable creditor. It is possible that customer defaults on obligations owed to us and on third-party obligations that we have guaranteed could be significant, which could have a material adverse effect on our business, financial condition, results of operations and cash flows. Our level of credit risk exposure from our customers has remained stable in recent years.
Currency risk may adversely affect our financial condition, results of operations and cash flows.
We derive a significant portion of our net sales from outside the United States and conduct our business and incur costs in the local currency of most countries in which we operate. Because our financial statements are presented in U.S. dollars, we must translate our financial results as well as assets and liabilities into U.S. dollars for financial statement reporting purposes at exchange rates in effect during or at the end of each reporting period, as applicable. Therefore, increases or decreases in the value of the U.S. dollar against other currencies in countries where we operate will affect our results of operations and the value of balance sheet items denominated in foreign currencies. In particular, we are exposed to the Euro, the Brazilian Real, the Chinese Renminbi, the British Pound, the Australian Dollar and the Russian Ruble. Furthermore, many of our local businesses import or buy raw materials in a currency other than their functional currency, which can impact the operating results for these operations if we are unable to mitigate the impact of the currency exchange fluctuations. We cannot accurately predict the effects of exchange rate fluctuations upon our future operating results because of the number of currencies involved, the variability of currency exposures and the potential volatility of currency exchange rates. Accordingly, fluctuations in foreign exchange rates may have an adverse effect on our financial condition, results of operations and cash flows.
Terrorist acts, conflicts, wars, natural disasters, pandemics and other health crises, among other events beyond our control, may materially adversely affect our business, financial condition, results of operations and cash flows.
As a multinational company with a large international footprint, we are subject to increased risk of damage or disruption to us, our employees, facilities, partners, suppliers, distributors, resellers or customers due to terrorist acts, conflicts, wars, adverse weather conditions, natural disasters, power outages, pandemics or other public health crises and environmental incidents, wherever located around the world. The potential for future terrorist acts, conflicts, wars, adverse weather conditions, natural disasters, power outages, pandemics or other public health crises and environmental incidents, the national and international responses to such events or perceived threats or potential conflicts relating to or arising out of such events may create economic and political uncertainties and challenges for us, our customers, suppliers and logistic partners that could have a materially adverse effect our business, financial condition, results of operations and cash flows. A loss of the use of all or a portion of one of our key manufacturing facilities due to accident, labor issues, weather conditions, acts of war, political unrest, geopolitical risk, terrorist activity, pandemic or other public health crises, natural disaster or otherwise, whether short- or long-term, and any interruption in production capability could require us to make substantial capital expenditures to remedy the situation, which could negatively affect our business, financial condition, results of operations and cash flows.
Interruption, interference with, or failure of our information technology and communications systems could hurt our ability to effectively provide our products and services, which could harm our reputation, financial condition, operating results and cash flows.
The availability of our products and services and fulfillment of our customer obligations depend on the continuing operation of our information technology and communications systems. Our systems are vulnerable to damage, interference, or interruption from modifications or upgrades, terrorist attacks, natural disasters or pandemics (including COVID-19), power loss, telecommunications failures, user errors, computer viruses, ransomware attacks, computer denial of service attacks, phishing schemes, or other attempts to harm or access our systems. Some of our systems are not fully redundant, and disaster recovery planning cannot account for all eventualities. Any such event relating to our systems (or the systems of third parties that we rely on), could result in theft, misuse, modification or destruction of information, including trade secrets and confidential business information, and cause business disruptions, including those that may disrupt production at our
24
manufacturing facilities, reputational damage and third-party claims, any of which could have a material adverse effect on our business, financial condition, results of operations or cash flows.
Since the techniques used to obtain unauthorized access to systems, or to otherwise sabotage them, change frequently and are often not recognized until launched against a target, we may be unable to anticipate these techniques or to implement adequate preventative measures. As these threats continue to evolve, particularly around cybersecurity, we may be required to expend significant resources to enhance our control environment, processes, practices, and other countermeasures. While we have designed and implemented controls to restrict access to our data and information technology infrastructure, it is still vulnerable to unauthorized access through cyber attacks, theft and other security breaches. These types of attacks have occurred against our systems from time to time, with no material adverse impacts to date. We expect these attacks to continue and our protective measures may not be adequate to ensure that our operations will not be disrupted, should another such event occur in the future. Although we continually seek to improve our countermeasures to prevent such events, we may be unable to anticipate every scenario and it is possible that certain cyber threats or vulnerabilities will be undetected or unmitigated in time to prevent an attack on us and our customers.
In addition, we rely extensively on information systems and technology to manage our business and summarize operating results. We are in the process of a multi-year implementation of a new enterprise resource planning ("ERP") system, which will replace much of our existing core financial systems. The ERP system is designed to accurately maintain our financial records, enhance the flow of financial information, improve data management, and provide timely information to our management team. We may not be able to successfully implement the ERP system without experiencing delays, increased costs, and other difficulties. Failure to successfully design and implement the new ERP system as planned could harm our business, financial condition, operating results and cash flows. Additionally, if we do not effectively implement the ERP system as planned or the ERP system does not operate as intended, the effectiveness of our internal control over financial reporting could be negatively affected.
The insurance we maintain may not fully cover all potential exposures.
Our product liability, property, business interruption and casualty insurance coverages may not cover all risks associated with the operation of our business and may not be sufficient to offset the costs of any losses, lost sales or increased costs experienced during business interruptions. For some risks, we may elect not to obtain insurance. As a result of market conditions, premiums and deductibles for certain insurance policies can increase substantially and, in some instances, certain insurance policies may become unavailable or available only for reduced amounts of coverage. As a result, we may not be able to renew our insurance policies or procure other desirable insurance on commercially reasonable terms, if at all. Losses and liabilities from uninsured or underinsured events and delay in the payment of insurance proceeds could have a material adverse effect on our business, financial condition, results of operations and cash flows.
We are subject to complex and evolving data privacy laws.
Our business is subject to complex and evolving U.S. and foreign laws and regulations regarding privacy, data protection and other matters. We could be liable for loss or misuse of our customers' personal information and/or our employee's personally-identifiable information if we fail to prevent or mitigate such misuse or loss. Although we have developed systems and processes that are designed to protect customer and employee information and prevent misuse of such information and other security breaches, failure to prevent or mitigate such misuse or breaches may affect our reputation and operating results negatively and may require significant management time and attention.
We may be subject to changes in our tax rates and the adoption of tax legislation or exposure to additional tax liabilities that may adversely affect our results of operations.
We are subject to taxes in the U.S. and non-U.S. jurisdictions where our subsidiaries are organized. Due to economic and political conditions, tax rates, tax laws and other non-tax legislation, such as economic substance regulations, in various jurisdictions may be subject to significant change. Our effective tax rates could be affected by changes in the mix of earnings in countries with differing statutory tax rates, changes in the valuation of deferred tax assets and liabilities, changes in available tax credits or tax deductions and changes in tax and other non-tax laws or their interpretation, such as interpretations as to the legality of tax advantages granted under the European Union ("EU") state aid rules and the impacts of the EU's Anti-Tax Avoidance Directive. In 2021, more than 140 countries tentatively signed on to a framework that imposes a minimum tax rate of 15% among other provisions. As this framework is subject to further negotiation and implementation by each member country, the timing and ultimate impact of any such changes on our tax obligations are uncertain. Additionally, we and our subsidiaries are engaged in a number of intercompany transactions across multiple tax jurisdictions. Although we believe we have clearly reflected the economics of these transactions and the proper local transfer pricing documentation is in place, tax authorities may propose and sustain adjustments that could result in changes that may impact our mix of earnings in countries with differing statutory tax rates.
Our tax returns and other tax matters are subject to examination by local tax authorities and governmental bodies. We regularly assess the likelihood of an adverse outcome resulting from these examinations to determine the adequacy of our
25
provision for taxes. There can be no assurance as to the outcome of these examinations. If our effective tax rates were to increase, or if the ultimate determination of the taxes owed by us is for an amount in excess of amounts previously accrued, our operating results, cash flows and financial condition could be adversely affected.
Increasing scrutiny and evolving expectations from customers, regulators, investors, and other stakeholders with respect to our environmental, social and governance practices may impose additional costs on us or expose us to new or additional risks.
Companies are facing increasing scrutiny from customers, regulators, investors, and other stakeholders related to their environmental, social and governance ("ESG") practices and disclosure. Investor advocacy groups, investment funds, and influential investors are also increasingly focused on these practices, especially as they relate to the environment, health and safety, diversity, labor conditions, and human rights. Increased ESG-related compliance costs could result in increases to our overall operational costs. Failure to adapt to or comply with regulatory requirements or investor, employee, customer, or other stakeholder expectations and standards, including any perceived failure, could negatively impact our reputation, ability to do business with certain partners, and our stock price. New government regulations could also result in new or more stringent forms of ESG oversight, including increased greenhouse gas limitations, and the expansion of mandatory and voluntary reporting, diligence, and disclosure.
In January 2022, we announced a number of 2030 ESG targets, including our aim for a 50% absolute reduction of our Scope 1 and Scope 2 greenhouse gas emissions by 2030 and our goal to have carbon neutral operations by 2040. Achievement of these targets depends on our execution of various operational strategies relating to each discrete target. Execution of these strategies and achievements of our 2030 targets are subject to risk and uncertainties, many of which are outside of our control. There are no assurances that we will be able to successfully execute our strategies and achieve our 2030 targets, and the failure to achieve any target could damage our reputation, customer and investor relationships, or our access to, and the terms of, financing. Further, given investors' increased focus related to ESG matters, such a failure could cause stockholders to reduce their ownership holdings, all of which, in turn could adversely affect our business, financial condition, results of operations and cash flows, and reduce our stock price.
26
ITEM 1B. UNRESOLVED STAFF COMMENTS
None.
ITEM 2. PROPERTIES
Our corporate headquarters is located in Glen Mills, PA. Our extensive geographic footprint is comprised of 47 manufacturing facilities (including five manufacturing sites operated by our joint ventures), four major technology centers and 48 customer training centers supporting our global operations. The table below presents summary information regarding our facilities as of December 31, 2021.
| Type of Facility/Country | Location | Segment | ||||||||||||
| Manufacturing Facilities | ||||||||||||||
| North America | ||||||||||||||
| Canada |
Ajax (1)
|
Mobility | ||||||||||||
| Cornwall | Performance | |||||||||||||
| United States of America | Fridley, MN | Performance | ||||||||||||
| Front Royal, VA | Performance; Mobility | |||||||||||||
| Ft. Madison, IA | Performance; Mobility | |||||||||||||
| High Point, NC | Performance | |||||||||||||
| Hilliard, OH | Performance; Mobility | |||||||||||||
| Houston, TX | Performance | |||||||||||||
| Jacksonville, TX | Performance | |||||||||||||
| Madison, AL | Performance | |||||||||||||
| Mt. Clemens, MI | Performance; Mobility | |||||||||||||
| Orrville, OH | Performance | |||||||||||||
| Riverside, CA | Performance | |||||||||||||
| Sacramento, CA | Performance | |||||||||||||
| Latin America | ||||||||||||||
| Brazil | Guarulhos | Performance; Mobility | ||||||||||||
| Guatemala | Amatitlan | Performance | ||||||||||||
| Mexico | Apodaca | Performance | ||||||||||||
| Ocoyoacac | Performance | |||||||||||||
| Tlalnepantla | Performance; Mobility | |||||||||||||
| EMEA | ||||||||||||||
| Austria | Guntramsdorf | Performance; Mobility | ||||||||||||
| France | Montbrison | Performance | ||||||||||||
| Germany | Landshut | Performance | ||||||||||||
| Wuppertal | Performance; Mobility | |||||||||||||
| Netherlands | Zuidland | Performance | ||||||||||||
| Sweden | Västervik | Performance | ||||||||||||
| Switzerland | Bulle | Performance | ||||||||||||
| Turkey | Gebze | Performance; Mobility | ||||||||||||
| Çerkezköy | Performance | |||||||||||||
| United Kingdom | Tewkesbury | Performance | ||||||||||||
| Darlington | Performance | |||||||||||||
| Farnham | Performance | |||||||||||||
| Huthwaite | Performance | |||||||||||||
| Wellingborough | Performance | |||||||||||||
| United Arab Emirates | Ras Al Khaimah | Performance | ||||||||||||
| Asia Pacific | ||||||||||||||
| China |
Changchun (1)
|
Performance; Mobility | ||||||||||||
| Jiading | Performance; Mobility | |||||||||||||
| Qingpu | Performance | |||||||||||||
| Ma'anshan | Performance | |||||||||||||
27
| Type of Facility/Country | Location | Segment | ||||||||||||
| India | Savli | Performance; Mobility | ||||||||||||
| Malaysia | Shah Alam | Performance | ||||||||||||
| Shah Alam | Performance | |||||||||||||
| Thailand | Bangplee | Performance; Mobility | ||||||||||||
|
Joint Venture Manufacturing Facilities
|
||||||||||||||
| Colombia | Cartagena de Indias | Performance | ||||||||||||
| Indonesia | Cikarang | Performance | ||||||||||||
| Taiwan | Taipei | Mobility | ||||||||||||
| Joint Venture Partner Manufacturing Facilities | ||||||||||||||
| South Africa | Port Elizabeth | Mobility | ||||||||||||
| Russia | Moscow | Mobility | ||||||||||||
| Technology Centers | ||||||||||||||
| China | Shanghai | Performance; Mobility | ||||||||||||
| Germany | Wuppertal | Performance; Mobility | ||||||||||||
| United States of America | Mt. Clemens, MI | Performance; Mobility | ||||||||||||
| Philadelphia, PA | Performance; Mobility | |||||||||||||
| Customer Training Centers | Location by Region | Number of Facilities | ||||||||||||
| North America | 12 | |||||||||||||
| Latin America | 2 | |||||||||||||
| EMEA | 14 | |||||||||||||
| Asia Pacific | 20 | |||||||||||||
(1) Manufacturing and distribution operations at these facilities are in process of being relocated to other Axalta facilities.
We own 31 of our manufacturing facilities, 2 of our technology centers, and 10 of our customer training centers, while the rest of the facilities and centers are leased. We believe that our properties as currently constituted are suitable, adequate and provide sufficient productive capacity for our current operations.
ITEM 3. LEGAL PROCEEDINGS
We are from time to time party to legal proceedings that arise in the ordinary course of business. We are not involved in any litigation other than that which has arisen in the ordinary course of business. We do not expect that any currently pending lawsuits will have a material adverse effect on us as discussed in Note 6 to the consolidated financial statements included elsewhere in this Annual Report on Form 10-K.
The Securities and Exchange Commission regulations require disclosure of certain environmental matters when a governmental authority is a party to the proceedings and such proceedings involve potential monetary sanctions that the Company reasonably believes will exceed a specified threshold. Pursuant to recent Securities and Exchange Commission amendments to this requirement, the Company will be using a threshold of $1 million for such proceedings. At this time, the Company is not aware of any matters that exceed this threshold and that meet the other conditions for disclosure except for the following matter summarized below.
In January 2022, the Company entered into a settlement agreement with the California South Coast Air Quality Management District (the "District") in order to settle claims by the District alleging that certain of the Company's products failed to comply with applicable volatile organic compound limits imposed under California law. Pursuant to the terms of the settlement agreement, the Company agreed to pay the District $1,377,328 in full settlement of the claims and without admitting any liability or wrongdoing.
ITEM 4. MINE SAFETY DISCLOSURES
Not applicable.
INFORMATION ABOUT OUR EXECUTIVE OFFICERS
28
The executive officers of the Company are appointed by the Board of Directors. The information required by this item is set forth below.
The following table provides information regarding our executive officers:
| Name | Age* | Position | ||||||||||||
| Robert W. Bryant | 53 | Chief Executive Officer and President | ||||||||||||
| Sean M. Lannon | 43 | Senior Vice President and Chief Financial Officer | ||||||||||||
| Brian A. Berube | 59 | Senior Vice President, General Counsel and Corporate Secretary | ||||||||||||
| Troy D. Weaver | 50 | Senior Vice President, Global Refinish | ||||||||||||
| Hadi H. Awada | 43 | Senior Vice President, Global Mobility Coatings | ||||||||||||
| Shelley J. Bausch | 56 | Senior Vice President, Global Industrial Coatings | ||||||||||||
| Jeremy Rohen | 46 | Senior Vice President, Strategy and Business Development | ||||||||||||
| Jacqueline Scanlan | 49 | Senior Vice President and Chief Human Resources Officer | ||||||||||||
*As of February 18, 2022
Robert W. Bryant
Mr. Bryant has served as our Chief Executive Officer and President since October 7, 2018. Prior to that, Mr. Bryant served as our Executive Vice President and Chief Financial Officer from February 2013 until October 2018. Previously, Mr. Bryant served as the Senior Vice President and Chief Financial Officer of Roll Global LLC. Before joining Roll Global in 2007, he was the Executive Vice President of Strategy, New Business Development, and Information Technology at Grupo Industrial Saltillo, S.A.B. de C.V. Prior to joining Grupo Industrial Saltillo in 2004, Mr. Bryant was President of Bryant & Company, which he founded in 2001. Prior positions included serving as Managing Principal with Texas Pacific Group's Newbridge Latin America, L.P., a Senior Associate with Booz Allen & Hamilton Inc. and an Assistant Investment Officer with the International Finance Corporation (IFC). Mr. Bryant began his career at Credit Suisse First Boston in the Mergers & Acquisitions Group. Mr. Bryant graduated summa cum laude and Phi Beta Kappa with a B.A. in Economics from the University of Florida and received his M.B.A. from the Harvard Business School.
Sean M. Lannon
Mr. Lannon has served as our Senior Vice President and Chief Financial Officer since October 12, 2018. Prior to that, Mr. Lannon served as Vice President, Corporate Finance and Global Controller of Axalta since 2016, and was Vice President and Global Controller from 2013 until that promotion. Previously, Mr. Lannon served as the Vice President, Global Controller of Trinseo. Prior to joining Trinseo in 2011, he was the Senior Manager, Financial Reporting at Endo Pharmaceuticals. Mr. Lannon began his career at PricewaterhouseCoopers where he spent more than nine years within the organization's Assurance Practice. Mr. Lannon graduated summa cum laude with a B.A. in Accounting from Philadelphia University.
Brian A. Berube
Mr. Berube has served as our Senior Vice President, General Counsel and Corporate Secretary since June 2019. Previously, Mr. Berube was Senior Vice President and General Counsel of Cabot Corporation, a position he held from March 2003 until June 2019. Prior to this appointment, Mr. Berube held various roles at Cabot, which he joined in 1994. Prior to joining Cabot, Mr. Berube was a corporate attorney at Choate, Hall & Stewart, a Boston law firm, and a law clerk with the New Hampshire Supreme Court. He earned his B.A. in Political Science from the College of the Holy Cross and a J.D. from Boston College Law School.
Troy D. Weaver
Mr. Weaver has served as our Senior Vice President, Global Refinish since October 2020. Prior to that, Mr. Weaver served as our Vice President, Global Refinish from August 2019 until October 2020 and, as our Vice President, North America Refinish from January 2017 until August 2019 where he was responsible for Axalta's high performing Refinish business in the USA and Canada. Mr. Weaver also led Axalta's initiative to secure and grow market share with multiple location collision shop operators, mega-dealers, and nationally recognized collision shop networks. Mr. Weaver began his career at DuPont Performance Coatings in 1992 where he held various Sales and Marketing leadership roles. He is also a two-time recipient of DuPont's Prestigious Marketing Excellence Award, first in 2007 and again in 2010. Mr. Weaver is active in the industry and has served as Chairman of the Board of CIECA (Collision Industry Electronic Commerce Association).
29
Hadi H. Awada
Mr. Awada has served as our Senior Vice President, Global Mobility Coatings since October 2020. Previously, Mr. Awada was President, Faurecia Clean Mobility – North America, where he also served as a member of Faurecia's North American Board of Management and President, Faurecia Clean Mobility – Asia Pacific, serving on multiple boards with joint venture partners. In those roles, Mr. Awada ran a multibillion-dollar business and led efforts to develop and deploy an operational turnaround and transform the product line to focus on new technologies for customers seeking sustainability and innovation. Previously at Faurecia, he worked in Europe where he led sales and programs for many international customers. He also spent four years in Asia as the Vice President for light vehicle customer business units, product line, marketing and communications. Mr. Awada was employed by Faurecia from 2004 to 2010 and again from 2013 to 2020. Mr. Awada started his career after earning his B.A. from the University of Toledo, serving the Ford Motor Company in various roles within the Ford customer service division.
Shelley J. Bausch
Ms. Bausch has served as our Senior Vice President, Global Industrial Coatings since January 2021. Previously, Ms. Bausch led the Asia Pacific region and the Fluid Technologies business unit for the Carlisle Companies Inc., a manufacturer of engineered products used in roofing, architectural metal, aerospace, medical technologies, industrial, transportation, refinish, and agriculture, mining and construction equipment markets. Before Carlisle, she led the Industrial Coatings business for PPG from 2014 to 2017 and, before that, spent 25 years at Dow Corning Corporation in a variety of senior management and commercial roles. Ms. Bausch serves on the board of directors of the Kraton Corporation. She earned a B.S. in Business Administration, summa cum laude, from Alma College and a M.B.A. from the University of Michigan – Flint.
Jeremy Rohen
Mr. Rohen has served as our Senior Vice President, Strategy and Business Development since January 2021. Previously, Mr. Rohen led corporate development, M&A and investor relations at W.R. Grace & Co., a global specialty chemical company, where he spent over ten years. Before W.R. Grace, he managed acquisitions, divestitures, mergers, joint ventures and growth strategy projects at Seale & Associates, an investment bank, where he spent ten years. He started his career at PricewaterhouseCoopers after earning both a bachelor's degree in Finance and a master's degree in Taxation from The George Washington University School of Business.
Jacqueline Scanlan
Ms. Scanlan has served as our Senior Vice President and Chief Human Resources Officer since June 2021. From 2017 to 2021, Ms. Scanlan served as Senior Vice President, Human Resources at Haemonetics Corporation, a global medical technology company. Before Haemonetics, from 2014 to 2016, she served as Corporate Vice President, Human Resources, North America at Novo Nordisk, a global healthcare company. Prior to Novo Nordisk, she held leadership positions at Campbell Soup Company, Bristol-Myers Squibb, DuPont Pharmaceuticals Company and Accenture. She received a B.A. in Political Science from St. Joseph's University and a M.S. in Organizational Dynamics from the University of Pennsylvania.
30
PART II
ITEM 5. MARKET FOR THE REGISTRANT'S COMMON EQUITY, RELATED SHAREHOLDER MATTERS AND ISSUER PURCHASES OF EQUITY SECURITIES
Share Information
Our common shares are traded on the New York Stock Exchange under the symbol "AXTA."
As of February 10, 2022, there were five registered holders of record of Axalta's common shares as shown on the records of the Company's transfer agent. A substantially greater number of holders of Axalta common shares are "street name" or beneficial holders, whose shares of record are held by banks, brokers and other financial institutions.
Since our incorporation in August 2012, we have not paid dividends on our common shares, and we do not currently intend to pay dividends in the foreseeable future.
Recent Sales of Unregistered Securities
None.
Issuer Purchases of Equity Securities
The following table summarizes the Company's share repurchase activity through its share repurchase program for the three months ended December 31, 2021:
| (in millions, except per share data) | ||||||||||||||||||||||||||
| Month |
Total Number of Shares Purchased(1)
|
Average Price Paid per Share(1)
|
Total Number of Shares Purchased as Part of Publicly Announced Programs(1)
|
Approximate Dollar Value of Shares That May Yet Be Purchased Under Our Share Repurchase Program(1)
|
||||||||||||||||||||||
| October 2021 | — | $ | — | — | $ | 647.4 | ||||||||||||||||||||
| November 2021 | 0.5 | 31.28 | 0.5 | 632.4 | ||||||||||||||||||||||
| December 2021 | 0.5 | 30.61 | 0.5 | 617.4 | ||||||||||||||||||||||
| Total | 1.0 | $ | 30.94 | 1.0 | $ | 617.4 | ||||||||||||||||||||
(1) All shares were repurchased through the share repurchase program announced in March 2017 (the "Program"). In April 2021, our Board of Directors authorized an increase in the Program by $625.0 million, bringing the total size of the Program to $1.3 billion, of which we have already purchased $682.6 million. Under the Program, we repurchased $30.0 million of our common shares during the three months ended December 31, 2021. At December 31, 2021, the Company had remaining authorization to repurchase $617.4 million of shares. There is no expiration date on the Program.
31
Stock Performance
The line graph illustrated below compares the cumulative total shareholder value return of our common shares with the cumulative total returns of an overall stock market index, the Standard & Poor's Composite 500 Index ("S&P 500"), and our peer group index, Standard & Poor's 500 Chemicals Index ("S&P 500 Chemicals"). This graph assumes an investment of $100 in our common shares and each index (with all dividends reinvested) on December 31, 2016.
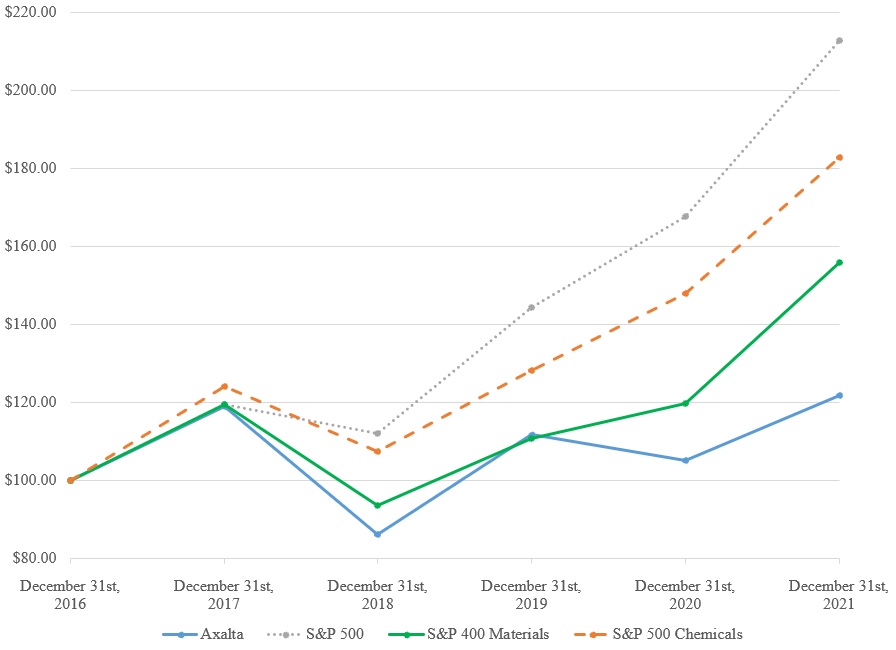
In the Annual Report on Form 10-K for the year ended December 31, 2020, the comparison of cumulative total shareholder value return compared the return on Axalta's common shares to the S&P 500 and the S&P 500 Chemicals. For 2021, we have replaced the S&P 500 Chemicals with the Standard & Poor's 400 Materials Index ("S&P 400 Materials") as one of our comparative indices. The S&P 400 Materials is used as a benchmark for certain of our compensation plans, and we believe that the companies in this index are more comparable to the Company and, therefore, the index serves as a better comparison to the return on Axalta's common shares. A comparison of the S&P 500 Chemicals appears in this Annual Report on Form 10-K but will not appear in subsequent Annual Reports.
ITEM 6. RESERVED
32
ITEM 7. MANAGEMENT'S DISCUSSION AND ANALYSIS OF FINANCIAL CONDITION AND RESULTS OF OPERATIONS
The following discussion and analysis of our financial condition and results of operations should be read in conjunction with our consolidated financial statements and the notes thereto included elsewhere in this Annual Report on Form 10-K.
This discussion and analysis deals with comparisons of material changes in the consolidated financial statements for 2021 and 2020. For the comparison of 2020 and 2019, see Management's Discussion and Analysis of Financial Condition and Results of Operations in Part II, Item 7 of our 2020 Annual Report on Form 10-K, filed with the Securities and Exchange Commission on February 18, 2021.
FORWARD-LOOKING STATEMENTS
Many statements made in the following discussion and analysis of our financial condition and results of operations and elsewhere in this Annual Report on Form 10-K that are not statements of historical fact, including statements about our beliefs and expectations, are "forward-looking statements" within the meaning of federal securities laws and should be evaluated as such. Forward-looking statements include information concerning possible or assumed future results of operations, including descriptions of our business plan, strategies and capital structure. These statements often include words such as "anticipate," "expect," "believe," "intend," "estimates," "targets," "projected," "projections," "can," "committing," "should," "could," "would," "may," "will," "forecasts" and the negative of these words or other comparable or similar terminology. We base these forward-looking statements or projections on our current expectations, plans and assumptions that we have made in light of our experience in the industry, as well as our perceptions of historical trends, current conditions, expected future developments and other factors we believe are appropriate under the circumstances and at such time. As you read and consider this Annual Report on Form 10-K, you should understand that these statements are not guarantees of performance or results. The forward-looking statements and projections are subject to and involve risks, uncertainties and assumptions, including, but not limited to, the risks and uncertainties described in "Forward-Looking Statements," as well as "Risk Factors" in this Annual Report on Form 10-K and in other document we have filed with, or furnished to, the SEC, and you should not place undue reliance on these forward-looking statements or projections. Although we believe that these forward-looking statements and projections are based on reasonable assumptions at the time they are made, you should be aware that many factors, including, but not limited to, those described in "Risk Factors," could affect our actual financial results or results of operations and could cause actual results to differ materially from those expressed in the forward-looking statements and projections.
These cautionary statements should not be construed by you to be exhaustive and are made only as of the date of this Annual Report on Form 10-K. We undertake no obligation to update or revise any forward-looking statements, whether as a result of new information, future events or otherwise.
OVERVIEW
We are a leading global manufacturer, marketer and distributor of high-performance coatings systems and products. We have over a 150-year heritage in the coatings industry and are known for manufacturing high-quality products with well-recognized brands supported by market-leading technology and customer service. Our diverse global footprint of 47 manufacturing facilities, four technology centers, 48 customer training centers and approximately 13,000 people allows us to meet the needs of customers in over 140 countries. We serve our customer base through an extensive sales force and technical support organization, as well as through approximately 4,000 independent, locally based distributors.
We operate our business in two operating segments, Performance Coatings and Mobility Coatings. Previously named Transportation Coatings, our Mobility Coatings segment was renamed in 2021 with no changes to the underlying business or segment structure. Our segments are based on the type and concentration of customers served, service requirements, methods of distribution and major product lines.
Through our Performance Coatings segment, we provide high-quality liquid and powder coatings solutions to a fragmented and local customer base. We are one of only a few suppliers with the technology to provide precise color matching and highly durable coatings systems. The end-markets within this segment are refinish and industrial.
Through our Mobility Coatings segment, we provide advanced coating technologies to OEMs of light and commercial vehicles. These increasingly global customers require a high level of technical support coupled with cost-effective, environmentally responsible, coatings systems that can be applied with a high degree of precision, consistency and speed. The end-markets within this segment are light vehicle and commercial vehicle.
33
BUSINESS HIGHLIGHTS
General Business Highlights
Our net sales increased 18.2% for the year ended December 31, 2021 compared with the year ended December 31, 2020. The increased sales were driven by higher volumes of 10.5% as a result of demand recovery from the impacts of COVID-19, higher average selling price and product mix of 4.0%, contributions from acquisitions of 1.9% and a 1.8% benefit from foreign currency translation partially offset by significant impacts of the semiconductor chip and other supply chain shortages that affected our customers. The following trends have impacted our segment and end-market net sales performance:
•Performance Coatings: Net sales increased 23.0% compared to 2020. The increased sales were primarily driven by higher volumes of 13.1% as a result of demand recovery from the impacts of COVID-19, higher average selling prices and product mix of 5.0%, and contributions from acquisitions of 2.8%. Net sales also benefited 2.1% from foreign currency translation driven primarily by fluctuations of the Euro, Chinese Renminbi, and British Pound compared to the U.S. Dollar.
•Mobility Coatings: Net sales increased 8.1% compared to 2020. The increased sales were primarily driven by higher volumes of 5.0% as a result of demand recovery from the impacts of COVID-19 as well as higher average selling prices and product mix of 1.8%, partially offset by significant impacts of semiconductor chip and other supply chain shortages. Net sales also benefited 1.3% from foreign currency translation driven primarily by fluctuations of the Chinese Renminbi and Euro partially offset by fluctuations in the Brazilian Real and Turkish Lira compared to the U.S. Dollar.
Our business serves four end-markets globally with net sales for the years ended December 31, 2021 and 2020 as follows:
| (In millions) | Year Ended December 31, | 2021 vs 2020 | ||||||||||||||||||
| 2021 | 2020 | % change | ||||||||||||||||||
| Performance Coatings | ||||||||||||||||||||
| Refinish | $ | 1,776.4 | $ | 1,449.0 | 22.6 | % | ||||||||||||||
| Industrial | 1,319.9 | 1,067.4 | 23.7 | % | ||||||||||||||||
| Total Net sales Performance Coatings | 3,096.3 | 2,516.4 | 23.0 | % | ||||||||||||||||
| Mobility Coatings | ||||||||||||||||||||
| Light Vehicle | 1,013.1 | 960.5 | 5.5 | % | ||||||||||||||||
| Commercial Vehicle | 306.8 | 260.7 | 17.7 | % | ||||||||||||||||
| Total Net sales Mobility Coatings | 1,319.9 | 1,221.2 | 8.1 | % | ||||||||||||||||
| Total Net sales | $ | 4,416.2 | $ | 3,737.6 | 18.2 | % | ||||||||||||||
Semiconductor chip shortages, supply chain constraints and raw material inflation
During the year ended December 31, 2021, we were impacted globally by semiconductor chip shortages, primarily affecting our Light Vehicle end-market, supply chain shortages as a result of severe weather in the U.S., inflation of raw material costs and logistics constraints. We anticipate the semiconductor chip and supply chain constraints, including the tightness of raw materials and freight and logistic challenges, will continue to impact our results through 2022 and raw material inflation to continue to impact our results into 2022 with potential abatement as the year progresses. We will continue to monitor these conditions and take appropriate actions that we believe will help mitigate costs and other operational impacts.
Coronavirus ("COVID-19") Pandemic
During the year ended December 31, 2021, our business continued to recover from the significant adverse impact on the demand for our products and, thus, our income from operations, caused by the COVID-19 pandemic, which began in early 2020. While we have seen a return to more stable quarter-over-quarter demand for our products and services, we remain cognizant of future COVID-19 developments, such as impacts from new variants, including employee absenteeism, shutdowns or other restrictions, that could impact our future results of operations, financial condition and cash flows. The risks and uncertainties related to the COVID-19 pandemic are discussed in further detail within Note 1 to the consolidated financial statements included elsewhere in this Annual Report on Form 10-K.
Acquisitions Highlights
During the year ended December 31, 2021, we successfully completed two strategic acquisitions within our Performance Coatings segment, including the acquisition of U-POL, which are discussed in further detail within Note 3 to the consolidated financial statements included elsewhere in this Annual Report on Form 10-K.
34
Capital and Liquidity Highlights
During the year ended December 31, 2021, we repurchased 8.2 million shares for total consideration of $243.7 million as we continue to execute against our previously approved share repurchase program. In April 2021, our Board of Directors authorized an increase in our common share repurchase program of $625.0 million, bringing the size of the program, initially announced in March 2017, to a total of $1.3 billion, of which we have repurchased $682.6 million through December 31, 2021.
During the year ended December 31, 2021, in connection with the Tenth Amendment to the Credit Agreement (the "Tenth Amendment") discussed within Note 18 to the consolidated financial statements included elsewhere in this Annual Report on Form 10-K, we increased the borrowing capacity under our revolving credit facility from $400.0 million to $550.0 million and extended the maturity of the revolving credit facility from 2024 to 2026, provided that such date will be accelerated in certain circumstances as set forth in the Tenth Amendment.
See Note 18 to the consolidated financial statements included elsewhere in this Annual Report on Form 10-K for additional information.
Environmental, Social and Governance Framework
In January 2022, we announced a new ESG framework that details longer-term ESG goals and strategies. See Part I, Item 1, "Business—Environmental, Social and Governance" included elsewhere in this Annual Report on Form 10-K for additional information.
Factors Affecting Our Operating Results
The following discussion sets forth certain components of our statements of operations as well as factors that impact those items.
Net sales
We generate revenue from the sale of our products and services across all major geographic areas. Our net sales include total sales less estimates for returns and price allowances. Price allowances include discounts for prompt payment as well as volume-based incentives. Our overall net sales are generally impacted by the following factors:
•fluctuations in overall economic activity within the geographic markets in which we operate;
•underlying growth in one or more of our end-markets, either worldwide or in particular geographies in which we operate;
•the type of products used within existing customer applications, or the development of new applications requiring products similar to ours;
•changes in product sales prices (including volume discounts and cash discounts for prompt payment);
•changes in the level of competition faced by our products, including price competition, quality competition and the launch of new products by competitors;
•our ability to successfully develop and launch new products and applications;
•changes in buying habits of our customers (including our distributors); and
•fluctuations in foreign exchange rates.
While the factors described above impact net sales in each of our operating segments, the impact of these factors on our operating segments can differ, as described below. For more information about risks relating to our business, see Part I, Item 1A, "Risk Factors—Risks Related to our Business."
Cost of goods sold ("cost of sales")
Our cost of sales consists principally of the following:
•Production materials costs. These include costs of the materials needed to manufacture products for distribution. These costs generally increase on an aggregate basis as production volumes increase, but product prices are also influenced by changes in market dynamics. A significant amount of the materials used in production are purchased on a global lowest-cost basis.
•Employee costs. These include the compensation and benefit costs, including share-based compensation expense, for employees involved in our manufacturing operations and on-site technical support services. These costs generally increase on an aggregate basis as production volumes increase and may decline as a percent of net sales as a result of economies of scale associated with higher production volumes.
35
•Depreciation expense. Property, plant and equipment are stated at cost and depreciated or amortized on a straight-line basis over their estimated useful lives. Property, plant and equipment acquired through the Acquisition were recorded at their estimated fair value on the acquisition date resulting in a new cost basis for accounting purposes.
•Other. Our remaining cost of sales consists of freight costs, warehousing expenses, purchasing costs, costs associated with closing or idling of production facilities, functional costs supporting manufacturing, cost of poor quality, including product claims and other general manufacturing expenses, such as expenses for utilities and energy consumption.
The main factors that influence our cost of sales as a percentage of net sales include:
•changes in the price of raw materials;
•changes in the costs of labor, logistics and energy;
•production volumes;
•the implementation of cost control measures aimed at improving productivity, including reduction of fixed production costs, refinements in inventory management and the coordination of purchasing within each subsidiary and at the business level;
•fluctuations in foreign exchange rates; and
•changes in sales volumes, average selling prices and product mix.
Selling, general and administrative expenses ("SG&A")
Our selling, general and administrative expense consists of all expenditures incurred in connection with the sales and marketing of our products, as well as technical support for our customers and administrative overhead costs, including:
•compensation and benefit costs for management, sales personnel and administrative staff, including share-based compensation expense. Expenses relating to our sales personnel increase or decrease principally with changes in sales volume due to the need to increase or decrease sales personnel to meet changes in demand. Expenses relating to administrative personnel generally do not increase or decrease directly with changes in sales volume; and
•depreciation, advertising and other selling expenses, such as expenses incurred in connection with travel and communications.
Changes in selling, general and administrative expense as a percentage of net sales have historically been impacted by a number of factors, including:
•changes in the costs of labor;
•changes in sales volume, as higher volumes enable us to spread the fixed portion of our administrative expense over higher sales;
•changes in our customer base, as new customers may require different levels of sales and marketing attention;
•new product launches in existing and new markets, as these launches typically involve a more intense sales activity before they are integrated into customer applications;
•customer credit issues requiring increases to the allowance for doubtful accounts; and
•fluctuations in foreign exchange rates.
Other operating charges
Our other operating charges include termination benefits and other employee related costs, strategic review and retention costs, acquisition and divestiture-related costs, impairment charges, an operational matter, which is discussed further in Note 6 to the consolidated financial statements included elsewhere in this Annual Report on Form 10-K, and gains of sales of facilities details of which are included in our reconciliations of segment operating performance to income before income taxes.
Research and development expenses
Research and development expenses represent costs incurred to develop new products, services, processes and technologies or to generate improvements to existing products or processes.
36
Interest expense, net
Interest expense, net consists primarily of interest expense on institutional borrowings and other financing obligations and changes in fair value of interest rate derivative instruments, net of capitalized interest expense. Interest expense, net also includes the amortization of debt issuance costs and debt discounts associated with our Senior Secured Credit Facilities, Senior Notes and other indebtedness.
Other (income) expense, net
Other (income) expense, net represents costs incurred, on various non-operational items including costs incurred in conjunction with our debt refinancing and extinguishment transactions, interest income, as well as foreign exchange gains and losses and non-operational impairment losses unrelated to our core business.
Provision for income taxes
We and our subsidiaries are subject to income tax in the various jurisdictions in which we operate. While the extent of our future tax liability is uncertain, changes to the debt and equity capitalization of our subsidiaries, and the realignment of the functions performed, and risks assumed by the various subsidiaries are among the factors that will determine the future book and taxable income of the respective subsidiary and the Company as a whole.
RESULTS OF OPERATIONS
The following discussion should be read in conjunction with the information contained in the accompanying financial statements and related notes included elsewhere in this Annual Report on Form 10-K. Our historical results of operations summarized and analyzed below may not necessarily reflect what will occur in the future.
Net sales
| Years Ended December 31, | 2021 vs 2020 | |||||||||||||||||||||||||
| 2021 | 2020 | $ Change | % Change | |||||||||||||||||||||||
| Net sales | $ | 4,416.2 | $ | 3,737.6 | $ | 678.6 | 18.2 | % | ||||||||||||||||||
| Volume effect | 10.5 | % | ||||||||||||||||||||||||
| Impact of portfolio changes | 1.9 | % | ||||||||||||||||||||||||
| Price/Mix effect | 4.0 | % | ||||||||||||||||||||||||
| Exchange rate effect | 1.8 | % | ||||||||||||||||||||||||
Net sales increased primarily due to the following: | ||
n Higher sales volumes across both segments as a result of demand recovery from the impacts of COVID-19 on 2020 results, partially muted by customer production limitations resulting from significant impacts of semiconductor and other supply-chain constraints
| ||
n Higher average selling price driven in both segments as a result of pricing actions taken to offset input price inflation
| ||
n Increased sales through the acquisitions discussed within Note 3 to the consolidated financial statements included elsewhere in this Annual Report on Form 10-K
| ||
n Favorable impacts of currency translation, due primarily to the fluctuations of the Euro, Chinese Renminbi and British Pound compared to the U.S. dollar
| ||
37
Cost of sales
| Years Ended December 31, | 2021 vs 2020 | |||||||||||||||||||||||||
| 2021 | 2020 | $ Change | % Change | |||||||||||||||||||||||
| Cost of sales | $ | 2,987.3 | $ | 2,457.9 | $ | 529.4 | 21.5 | % | ||||||||||||||||||
| % of net sales | 67.6 | % | 65.8 | % | ||||||||||||||||||||||
Cost of sales increased primarily due to the following: | ||
n Higher sales volumes across both segments as a result of demand recovery from the impacts of COVID-19 on 2020 results
| ||
n Higher variable input costs due to raw material inflation and supply chain impacts
| ||
n Increased compensation-related expenses because of the lapse of temporary COVID-19 related cost reduction actions in the prior year
| ||
n Increased costs associated with the acquisitions discussed within Note 3 to the consolidated financial statements included elsewhere in this Annual Report on Form 10-K
| ||
n Unfavorable impacts of currency translation, due primarily to the fluctuations of the Euro and Chinese Renminbi compared to the U.S. dollar
| ||
Cost of sales as a percentage of net sales increased primarily due to the following: | ||
n Higher variable input costs due to raw material inflation and supply chain impacts
| ||
n Increased compensation-related expenses because of the lapse of temporary COVID-19 related cost reduction actions in the prior year
| ||
| Partially offset by: | ||
n Higher sales volume covering fixed costs
| ||
Selling, general and administrative expenses
| Years Ended December 31, | 2021 vs 2020 | |||||||||||||||||||||||||
| 2021 | 2020 | $ Change | % Change | |||||||||||||||||||||||
| Selling, general and administrative expenses | $ | 738.7 | $ | 695.0 | $ | 43.7 | 6.3 | % | ||||||||||||||||||
Selling, general and administrative expenses increased primarily due to the following: | ||
n Unfavorable impacts of currency translation, due primarily to the fluctuations of the Euro and Chinese Renminbi compared to the U.S. dollar
| ||
n Increased expenses as a result of acquisitions discussed within Note 3 to the consolidated financial statements included elsewhere in this Annual Report on Form 10-K
| ||
n Higher operating costs including compensation-related costs, due to the lapse of temporary COVID-19 related cost reductions in the prior year, partially offset by the reduction in costs resulting from operational efficiencies associated with our structural cost savings initiatives
| ||
n Increase in commissions and sales incentive compensation driven by increased sales
| ||
Partially offset by: | ||
n Lower bad debt expenses in 2021 compared to 2020 of $10.0 million associated with trade receivables
| ||
38
Other operating charges
| Years Ended December 31, | 2021 vs 2020 | |||||||||||||||||||||||||
| 2021 | 2020 | $ Change | % Change | |||||||||||||||||||||||
| Other operating charges | $ | 44.0 | $ | 110.8 | $ | (66.8) | (60.3) | % | ||||||||||||||||||
Other operating charges changed primarily due to the following: | ||
n Decrease of $38.0 million in termination benefits and other employee related costs associated with our cost saving initiatives from $74.9 million in the prior year to $36.9 million in the current year
| ||
n Decrease of $21.0 million associated with retention awards and the review of strategic alternatives that was concluded in March 2020, from $30.7 million in the prior year to $9.7 million in the current year
| ||
n Gains of $18.7 million in the current year related to the sales of manufacturing facilities
| ||
n Decrease of $5.1 million in impairment charges primarily related to impairments and associated write-downs in the prior year resulting from our decision to exit the Performance Coatings segment business in Argentina, which did not re-occur in the current year
| ||
n Impacts of currency translation were immaterial when compared with 2020
| ||
Partially offset by: | ||
n Increase of $11.8 million in expenses for acquisition-related costs during the current year primarily associated with costs associated with the U-POL acquisition
| ||
Research and development expenses
| Years Ended December 31, | 2021 vs 2020 | |||||||||||||||||||||||||
| 2021 | 2020 | $ Change | % Change | |||||||||||||||||||||||
| Research and development expenses | $ | 62.4 | $ | 55.2 | $ | 7.2 | 13.0 | % | ||||||||||||||||||
Research and development expenses increased primarily due to the following: | ||
n Increase in compensation-related expenses and other spending due to the absence of temporary cost savings initiatives that were in place during 2020
| ||
n Impacts of currency translation were immaterial when compared with 2020
| ||
Amortization of acquired intangibles
| Years Ended December 31, | 2021 vs 2020 | |||||||||||||||||||||||||
| 2021 | 2020 | $ Change | % Change | |||||||||||||||||||||||
Amortization of acquired intangibles |
$ | 121.4 | $ | 113.2 | $ | 8.2 | 7.2 | % | ||||||||||||||||||
Amortization of acquired intangibles increased primarily due to the following: | ||
n Amortization related to intangible assets acquired in our acquisitions discussed within Note 3 to the consolidated financial statements included elsewhere in this Annual Report on Form 10-K
| ||
n Unfavorable impacts of foreign currency translation, primarily related to fluctuations of the Euro compared to the U.S. dollar
| ||
Interest expense, net
| Years Ended December 31, | 2021 vs 2020 | |||||||||||||||||||||||||
| 2021 | 2020 | $ Change | % Change | |||||||||||||||||||||||
| Interest expense, net | $ | 134.2 | $ | 149.9 | $ | (15.7) | (10.5) | % | ||||||||||||||||||
Interest expense, net decreased primarily due to the following: | ||
n Decrease in variable interest rates due to LIBOR decreases on our variable rate debt over the comparable period and benefits on our fixed rate debt issued with our debt refinancing activity in November 2020
| ||
n Impacts of currency translation were immaterial when compared with 2020
| ||
Partially offset by: | ||
n Unfavorable impacts of increased average principal over the comparable period resulting from our 2020 debt refinancing activities
| ||
n Unfavorable impacts of our derivative instruments used to hedge the variable interest rate exposure on certain debt arrangements
| ||
39
Other (income) expense, net
| Years Ended December 31, | 2021 vs 2020 | |||||||||||||||||||||||||
| 2021 | 2020 | $ Change | % Change | |||||||||||||||||||||||
| Other (income) expense, net | $ | (12.3) | $ | 33.4 | $ | (45.7) | (136.8) | % | ||||||||||||||||||
Other (income) expense, net changed primarily due to the following: | ||
n Reduction in debt extinguishment and refinancing related costs of $34.2 million
| ||
n Income of $8.3 million recorded in 2021 related to a tax law change with respect to certain Brazilian indirect taxes
| ||
n Favorable impact of foreign exchange losses of $4.9 million when compared with the prior-year period driven by the Euro and Swiss Franc
| ||
Partially offset by: | ||
n A net benefit of $0.8 million during the prior period as a result of changes in pension curtailment, settlements, and special termination benefits activity within accumulated other comprehensive loss
| ||
Provision for income taxes
| Years Ended December 31, | ||||||||||||||
| 2021 | 2020 | |||||||||||||
Income before income taxes |
$ | 340.5 | $ | 122.2 | ||||||||||
Provision for income taxes |
76.1 | 0.2 | ||||||||||||
Statutory U.S. Federal income tax rate |
21.0 | % | 21.0 | % | ||||||||||
Effective tax rate |
22.4 | % | 0.2 | % | ||||||||||
| Effective tax rate vs. statutory U.S. Federal income tax rate | 1.4 | % | (20.8) | % | ||||||||||
| (Favorable) Unfavorable Impact | ||||||||||||||
Items impacting the effective tax rate vs. statutory U.S. federal income tax rate |
2021 | 2020 | ||||||||||||
Earnings generated in jurisdictions where the statutory rate is lower than the U.S. Federal rate (1)
|
$ | (16.9) | $ | (13.9) | ||||||||||
Changes in valuation allowance |
18.1 | 10.0 | ||||||||||||
| Foreign exchange gain, net | 2.2 | 8.2 | ||||||||||||
| Stock-based compensation excess tax shortfalls (benefits) | 0.4 | (0.3) | ||||||||||||
Non-deductible expenses and interest |
5.7 | 4.6 | ||||||||||||
Change in unrecognized tax benefits (2)
|
(4.9) | 54.9 | ||||||||||||
Intra-entity asset transfer (3)
|
— | (50.8) | ||||||||||||
| Foreign taxes | 8.7 | 7.0 | ||||||||||||
Other - net (4)
|
(7.0) | (42.7) | ||||||||||||
(1) Primarily related to earnings in Bermuda, Germany, Luxembourg, and Switzerland.
(2) In 2020, we recorded charges of $14.3 million in connection with the income tax audit in Germany and $27.3 million in the Netherlands related to realized exchange gain. The Netherlands item is fully offset by a tax benefit of $27.3 million recorded in 2020 to adjust to the prior year tax filing position.
(3) In 2020, the Company recorded a tax benefit related to the step-up of tax-deductible basis upon transfer of certain intellectual property rights to our Swiss subsidiary.
(4) In 2021, the Company recorded a tax benefit of $2.9 million in the Netherlands, which is fully offset by a tax expense of $2.9 million for an increase to the valuation allowance. In 2020, the Company recorded a tax benefit of $41.8 million in the Netherlands, of which $27.3 million is related to realized exchange gain and $14.5 million related to rate change on deferred taxes, which are both fully offset by a tax expense of $27.3 million for the increase to unrecognized tax benefits and $14.5 million for an increase to the valuation allowance, respectively.
40
SEGMENT RESULTS
The Company's products and operations are managed and reported in two operating segments: Performance Coatings and Mobility Coatings. See Note 20 to the consolidated financial statements included elsewhere in this Annual Report on Form 10-K for additional information.
Performance Coatings Segment
| Years Ended December 31, | 2021 vs 2020 | |||||||||||||||||||||||||
| 2021 | 2020 | $ Change | % Change | |||||||||||||||||||||||
| Net sales | $ | 3,096.3 | $ | 2,516.4 | $ | 579.9 | 23.0 | % | ||||||||||||||||||
| Volume effect | 13.1 | % | ||||||||||||||||||||||||
| Impact of portfolio changes | 2.8 | % | ||||||||||||||||||||||||
| Price/Mix effect | 5.0 | % | ||||||||||||||||||||||||
| Exchange rate effect | 2.1 | % | ||||||||||||||||||||||||
| Adjusted EBIT | $ | 479.4 | $ | 344.3 | $ | 135.1 | 39.2 | % | ||||||||||||||||||
| Adjusted EBIT Margin | 15.5 | % | 13.7 | % | ||||||||||||||||||||||
Net sales increased primarily due to the following: | ||
n Higher sales volumes across both end-markets and all regions as a result of demand recovery from the impacts of COVID-19
| ||
n Higher average selling prices and product mix across both end-markets, driven by price actions within both end-markets and improved product mix in Refinish North America
| ||
n Favorable impact from portfolio changes as a result of acquisitions closed during 2021
| ||
n Favorable impacts of currency translation, due primarily to the fluctuations of the Euro, Chinese Renminbi and British Pound compared to the U.S. dollar
| ||
Adjusted EBIT increased primarily due to the following: | ||
n Higher sales volumes across both end-markets as a result of demand recovery from the impacts of COVID-19
| ||
n Higher average selling prices and product mix across both end-markets and most regions
| ||
n Favorable impacts of currency translation, due primarily to the fluctuations of the Canadian Dollar, Chinese Renminbi and British Pound compared to the U.S. dollar
| ||
Partially offset by: | ||
n Higher variable input costs across both end-markets and all regions primarily due to inflation of raw materials and logistics costs
| ||
n Higher operating costs due to the lapse of temporary cost savings in the prior year, partially offset by the reduction in costs resulting from operational efficiencies associated with our structural cost savings initiatives
| ||
| Adjusted EBIT margins increased primarily due to the following: | ||
n Higher sales volumes across both end-markets as a result of demand recovery from the impacts of COVID-19
| ||
n Higher average selling prices and product mix across both end-markets and most regions
| ||
n Favorable impacts of currency translation, due primarily to the fluctuations of the Canadian Dollar, Chinese Renminbi and British Pound compared to the U.S. dollar
| ||
| Partially offset by: | ||
n Higher variable input costs across both end-markets and all regions primarily due to inflation of raw materials and logistics costs
| ||
n Higher operating costs due to the lapse of temporary cost savings in the prior year, partially offset by the reduction in costs resulting from operational efficiencies associated with our structural cost savings initiatives
| ||
41
Mobility Coatings Segment
| Years Ended December 31, | 2021 vs 2020 | |||||||||||||||||||||||||
| 2021 | 2020 | $ Change | % Change | |||||||||||||||||||||||
| Net sales | $ | 1,319.9 | $ | 1,221.2 | $ | 98.7 | 8.1 | % | ||||||||||||||||||
| Volume effect | 5.0 | % | ||||||||||||||||||||||||
| Price/Mix effect | 1.8 | % | ||||||||||||||||||||||||
| Exchange rate effect | 1.3 | % | ||||||||||||||||||||||||
| Adjusted EBIT | $ | 38.7 | $ | 82.9 | $ | (44.2) | (53.3) | % | ||||||||||||||||||
| Adjusted EBIT Margin | 2.9 | % | 6.8 | % | ||||||||||||||||||||||
Net sales increased primarily due to the following: | ||
n Higher sales volumes across both end-markets as a result of demand recovery from the impacts of COVID-19, partially offset by customer production limitations due to significant impacts of semiconductor chip and other supply chain constraints
| ||
n Higher average selling prices and product mix driven by Light Vehicle price actions within most regions
| ||
n Favorable impacts of currency translation, due primarily to the fluctuations of the Chinese Renminbi and Euro compared to the U.S. dollar, partially offset by fluctuations of the Brazilian Real and Turkish Lira compared to the U.S. dollar
| ||
Adjusted EBIT decreased primarily due to the following: | ||
n Higher variable input costs across all regions and both end-markets due to raw material inflation
| ||
| Partially offset by: | ||
n Higher average selling price and product mix driven by price actions to offset inflation
| ||
n Lower operating expenses
| ||
n Higher sales volumes across both end-markets
| ||
| Adjusted EBIT margins decreased due to the following: | ||
n Higher variable input costs across all regions due to raw material inflation
| ||
| Partially offset by: | ||
n Higher average selling price and product mix driven by price actions to offset inflation
| ||
n Lower operating expenses
| ||
n Higher sales volumes across both end-markets
| ||
LIQUIDITY AND CAPITAL RESOURCES
Our primary sources of liquidity are cash on hand, cash flow from operations and available borrowing capacity under our Senior Secured Credit Facilities.
At December 31, 2021, availability under the Revolving Credit Facility was $527.9 million, net of $22.1 million of letters of credit outstanding. All such availability may be utilized without violating any covenants under the credit agreement governing such facility or the indentures governing the Senior Notes. At December 31, 2021, we had $24.0 million of outstanding borrowings under other lines of credit. Our remaining available borrowing capacity under other lines of credit in certain non-U.S. jurisdictions totaled $22.2 million.
We, or our affiliates, at any time and from time to time, may purchase shares of our common stock or the Senior Notes, and may prepay our Term Loans or other indebtedness. Any such purchases of our common stock or Senior Notes may be made through the open market or privately negotiated transactions with third parties or pursuant to one or more redemption, tender or exchange offers or otherwise, upon such terms and at such prices, as well as with such consideration, as we, or any of our affiliates, may determine.
We have various supplier finance programs in place around the world. We partner with large banking institutions and utilize these programs to enhance our liquidity profile. Depending on the program, the liabilities under the program are classified either as accounts payable or current portion of borrowings on our consolidated balance sheets. Our facility in China is more fully described in Note 18 to the consolidated financial statements included elsewhere in this Annual Report on Form 10-K.
42
Cash Flows
Years ended December 31, 2021 and 2020
| Years Ended December 31, | ||||||||||||||
| (In millions) | 2021 | 2020 | ||||||||||||
| Net cash provided by (used for): | ||||||||||||||
| Operating activities: | ||||||||||||||
| Net income | $ | 264.4 | $ | 122.0 | ||||||||||
| Depreciation and amortization | 316.5 | 320.3 | ||||||||||||
| Amortization of deferred financing costs and original issue discount | 8.9 | 9.0 | ||||||||||||
| Debt extinguishment and refinancing related costs | 0.2 | 34.4 | ||||||||||||
| Deferred income taxes | 15.0 | (55.4) | ||||||||||||
| Realized and unrealized foreign exchange losses, net | 10.1 | 3.9 | ||||||||||||
| Stock-based compensation | 14.9 | 15.1 | ||||||||||||
| Gain on sales of facilities | (19.7) | — | ||||||||||||
| Interest income on swaps designated as net investment hedges | (18.0) | (14.5) | ||||||||||||
| Other non-cash, net | 11.7 | 16.2 | ||||||||||||
| Net income adjusted for non-cash items | 604.0 | 451.0 | ||||||||||||
| Changes in operating assets and liabilities | (45.4) | 58.3 | ||||||||||||
| Operating activities | 558.6 | 509.3 | ||||||||||||
| Investing activities | (716.0) | (61.5) | ||||||||||||
| Financing activities | (334.5) | (130.9) | ||||||||||||
| Effect of exchange rate changes on cash | (20.9) | 26.6 | ||||||||||||
| Net (decrease) increase in cash | $ | (512.8) | $ | 343.5 | ||||||||||
Year Ended December 31, 2021
Net Cash Provided by Operating Activities
Net cash provided by operating activities for the year ended December 31, 2021 was $558.6 million. Net income before deducting non-cash items (depreciation, amortization and other non-cash items) generated cash of $604.0 million. This was offset by net uses of working capital of $45.4 million, for which the most significant drivers were increases in inventory, accounts and notes receivable and prepaid expenses and other assets of $111.6 million, $80.5 million and $45.3 million, respectively. These outflows were primarily driven by inflation of raw material costs, increased accounts receivable associated with net sales growth, insurance receivables related to an operational matter within the Mobility Coatings segment, which is discussed further in Note 6 to the consolidated financial statements included elsewhere in this Annual Report on Form 10-K, and timing of business incentive payments. The outflows were partially offset by increases in accounts payable of $140.1 million due to inflation of raw material costs and management of accounts payable and other accruals of $66.2 million primarily related to an operational matter within the Mobility Coatings segment which is discussed further in Note 6 to the consolidated financial statements included elsewhere in this Annual Report on Form 10-K.
Net Cash Used for Investing Activities
Net cash used for investing activities for the year ended December 31, 2021 was $716.0 million. The primary uses were $649.0 million for business acquisitions, which are discussed further in Note 3 of the consolidated financial statements included elsewhere in this Annual Report on Form 10-K, and purchases of property, plant and equipment of $121.6 million. The outflows were partially offset by proceeds received from sales of assets of $37.8 million, driven primarily by the sales of facilities discussed further in Note 5 to the consolidated financial statements included elsewhere in this Annual Report on Form 10-K, and $18.0 million of interest proceeds on swaps designated as net investment hedges, which are discussed further in Note 19 to the consolidated financial statements included elsewhere in this Annual Report on Form 10-K.
Net Cash Used for Financing Activities
Net cash used for financing activities for the year ended December 31, 2021 was $334.5 million. The primary uses were for the purchase of common stock totaling $243.8 million and payments of $100.9 million on borrowings.
43
Other Impacts on Cash
Currency exchange impact on cash for the year ended December 31, 2021 were unfavorable by $20.9 million, which was driven primarily by fluctuations in the Euro compared to the U.S. Dollar partially offset by fluctuations in the Chinese Renminbi compared to the U.S. Dollar.
Year Ended December 31, 2020
Net Cash Provided by Operating Activities
Net cash provided by operating activities for the year ended December 31, 2020 was $509.3 million. Net income before deducting non-cash items (depreciation, amortization and other non-cash items) generated cash of $451.0 million. This was aided by inflows from working capital of $58.3 million, for which the most significant drivers were inflows from accounts payable, inventory and other liabilities $103.0 million, $39.6 million and $31.7 million, respectively. These inflows were driven by management of accounts payable and other liabilities and sell through of inventory. The inflows were partially offset by outflows for other accrued liabilities of $70.1 million, primarily associated with accruals for employee termination expenses, accounts receivable of $26.0 million due to timing of collections and prepaid expenses and other assets of $19.9 million, primarily due to business incentive payments.
Net Cash Used for Investing Activities
Net cash used for investing activities for the year ended December 31, 2020 was $61.5 million, driven primarily by purchases of property, plant and equipment of $82.1 million, partially offset by interest proceeds on swaps designated as net investment hedges of $14.5 million.
Net Cash Used for Financing Activities
Net cash used for financing activities for the year ended December 31, 2020 was $130.9 million. This was driven by cash proceeds of $500.0 million and $700.0 million for the issuance of our 2027 Dollar Senior Notes and 2029 Dollar Senior Notes, respectively, partially offset by the voluntary prepayment of $300.0 million on the outstanding principal on the 2024 Dollar Term Loan, and redemptions of $500.0 million and $396.3 million of the 2024 Dollar Senior Notes and 2024 Euro Senior Notes, respectively. Also contributing to the net outflows were routine repayments on short-term and long-term borrowings of $65.8 million, payments for redemption fees and refinancing-related costs of $39.9 million and repurchases of our common shares of $26.0 million.
Other Impacts on Cash
Currency exchange impacts on cash for the year ended December 31, 2020 were favorable by $26.6 million, which was driven primarily by the strengthening of the Euro, Chinese Renminbi and British Pound compared to the U.S. Dollar.
Financial Condition
We had cash and cash equivalents at December 31, 2021 and 2020 of $840.6 million and $1,360.9 million, respectively. Of these balances, $471.9 million and $761.7 million were maintained in non-U.S. jurisdictions as of December 31, 2021 and 2020, respectively. We believe at this time our organizational structure allows us the necessary flexibility to move funds throughout our subsidiaries to meet our operational working capital needs.
Our business may not generate sufficient cash flow from operations and future borrowings may not be available under our Senior Secured Credit Facilities in an amount sufficient to enable us to pay our indebtedness, or to fund our other liquidity needs, including planned capital expenditures. In such circumstances, we may need to refinance all or a portion of our indebtedness on or before maturity. We may not be able to refinance any of our indebtedness on commercially reasonable terms or at all. If we cannot service our indebtedness, we may have to take actions such as selling assets, selling additional equity or reducing or delaying capital expenditures, strategic acquisitions, investments and alliances. Our primary sources of liquidity are cash on hand, cash flow from operations and available borrowing capacity under our Senior Secured Credit Facilities. Based on our forecasts, we believe that cash flow from operations, available cash on hand and available borrowing capacity under our Senior Secured Credit Facilities and existing lines of credit will be adequate to service debt, fund our cost saving initiatives, meet liquidity needs and fund necessary capital expenditures for the next twelve months.
Our ability to make scheduled payments of principal or interest on, or to refinance, our indebtedness or to fund working capital requirements, capital expenditures and other current obligations will depend on our ability to generate cash from operations. Such cash generation is subject to general economic, financial, competitive, legislative, regulatory and other factors that are beyond our control, including the effects of COVID-19.
If required, our ability to raise additional financing and our borrowing costs may be impacted by short and long-term debt ratings assigned by independent rating agencies, which are based, in significant part, on our performance as measured by certain credit metrics such as interest coverage and leverage ratios. Our highly leveraged nature may limit our ability to procure additional financing in the future.
44
The following table details our borrowings outstanding at the periods indicated:
| December 31, | ||||||||||||||
| (In millions) | 2021 | 2020 | ||||||||||||
| 2024 Dollar Term Loans | $ | 2,038.9 | $ | 2,063.2 | ||||||||||
| 2025 Euro Senior Notes | 508.8 | 552.1 | ||||||||||||
| 2027 Dollar Senior Notes | 500.0 | 500.0 | ||||||||||||
| 2029 Dollar Senior Notes | 700.0 | 700.0 | ||||||||||||
| Short-term and other borrowings | 113.8 | 118.0 | ||||||||||||
| Unamortized original issue discount | (4.6) | (6.3) | ||||||||||||
| Unamortized deferred financing costs | (27.3) | (34.3) | ||||||||||||
| Total borrowings, net | 3,829.6 | 3,892.7 | ||||||||||||
| Less: | ||||||||||||||
| Short-term borrowings | 55.4 | 29.9 | ||||||||||||
| Current portion of long-term borrowings | 24.3 | 24.3 | ||||||||||||
| Long-term debt | $ | 3,749.9 | $ | 3,838.5 | ||||||||||
Our indebtedness, including the Senior Secured Credit Facilities, Senior Notes and short-term borrowings, is more fully described in Note 18 to the consolidated financial statements included elsewhere in this Annual Report on Form 10-K.
We believe that we continue to maintain sufficient liquidity to meet our requirements, including our leverage and associated interest payments as well as our working capital needs. During the year ended December 31, 2021,we entered into the Tenth Amendment to the Credit Agreement in order to, among other things, increase the commitments available pursuant to the Revolving Credit Facility from $400.0 million to $550.0 million and extend the maturity from 2024 to 2026, provided that such date will be accelerated in certain circumstances as set forth in the Tenth Amendment. As a result, availability under the Revolving Credit Facility was $527.9 million and $366.0 million at December 31, 2021 and December 31, 2020, respectively, all of which may be borrowed by us without violating any covenants under the Credit Agreement governing such facility or the indentures governing the Senior Notes.
The following table details our borrowings outstanding, average effective interest rates and the associated interest expense. Interest expense is inclusive of the amortization of debt issuance costs, debt discounts and the impact of derivative instruments for the years ended December 31, 2021 and 2020, respectively:
| Years Ended December 31, | ||||||||||||||||||||||||||||||||||||||
| 2021 | 2020 | |||||||||||||||||||||||||||||||||||||
| (In millions) | Principal | Average Effective Interest Rate |
Interest Expense |
Principal | Average Effective Interest Rate |
Interest Expense |
||||||||||||||||||||||||||||||||
| Term Loans | $ | 2,038.9 | 2.2% | $ | 62.2 | $ | 2,063.2 | 3.0% | $ | 68.0 | ||||||||||||||||||||||||||||
| Revolving Credit Facility | — | N/A | 1.5 | — | N/A | 1.4 | ||||||||||||||||||||||||||||||||
| Senior Notes | 1,708.8 | 4.1% | 65.9 | 1,752.1 | 4.5% | 75.2 | ||||||||||||||||||||||||||||||||
| Short-term and other borrowings | 113.8 | Various | 4.6 | 118.0 | Various | 5.3 | ||||||||||||||||||||||||||||||||
| Total | $ | 3,861.5 | $ | 134.2 | $ | 3,933.3 | $ | 149.9 | ||||||||||||||||||||||||||||||
After giving effect to our cross-currency and interest rate hedges, our borrowings denominated in U.S. Dollar as of December 31, 2021 and 2020 were $2,481.4 million and $2,509.9 million, respectively, with weighted average interest rates of 3.4% and 3.6%. After giving effect to our cross-currency and interest rate hedges, borrowings denominated in Euro as of December 31, 2021 and 2020 were $1,380.1 million and $1,423.4 million, respectively, with weighted average interest rates of 2.5% and 2.5%.
Contractual Obligations
See Note 7 and Note 18 to the consolidated financial statements included elsewhere in this Annual Report on Form 10-K for disclosure of our material contractual obligations.
Off Balance Sheet Arrangements
See Note 6 to the consolidated financial statements included elsewhere in this Annual Report on Form 10-K for disclosure of our guarantees of certain customers' obligations to third parties.
45
Recent Accounting Guidance
See Note 1 to the consolidated financial statements included elsewhere in this Annual Report on Form 10-K for a summary of recent accounting guidance.
CRITICAL ACCOUNTING POLICIES AND ESTIMATES
Our discussion and analysis of results of operations and financial condition are based upon our consolidated financial statements. These financial statements have been prepared in accordance with U.S. GAAP unless otherwise noted. The preparation of these financial statements requires us to make estimates and judgments that affect the amounts reported in the financial statements. We base our estimates and judgments on historical experiences and assumptions believed to be reasonable under the circumstances and re-evaluate them on an ongoing basis. Actual results could differ from our estimates under different assumptions or conditions. Our significant accounting policies, which may be affected by our estimates and assumptions, are more fully described in Note 1 to the consolidated financial statements included elsewhere in this Annual Report on Form 10-K.
An accounting policy is deemed to be critical if it requires an accounting estimate to be made based on assumptions about matters that are highly uncertain at the time the estimate is made, and if different estimates that reasonably could have been used, or changes in the accounting estimates that are reasonably likely to occur periodically, could materially impact the financial statements. Management believes the following critical accounting policies reflect its most significant estimates and assumptions used in the preparation of the financial statements.
Accounting for Business Combinations
Determining the fair value of assets acquired and liabilities assumed requires management's judgment and often involves the use of significant estimates and assumptions, including assumptions with respect to future cash inflows and outflows, discount rates, royalty rates, customer attrition rates, technology migration rates, asset lives and market multiples, among other items.
The fair values of intangible assets are estimated using an income approach, either the excess earnings method (customer relationships) or the relief from royalty method (technology and trademarks). Under the excess earnings method, an intangible asset's fair value is equal to the present value of the incremental after-tax cash flows attributable solely to the intangible asset over its remaining useful life. With respect to customer relationships, fair values are calculated using the excess earnings method and customer attrition is a key input used to determine the applicable after-tax cash flows. Under the relief from royalty method, fair value is measured by estimating future revenue associated with the intangible asset over its useful life and applying a royalty rate to the revenue estimate. These intangible assets enable us to secure markets for our products, develop new products to meet the evolving business needs and competitively produce our existing products.
The fair values of real properties acquired are based on the consideration of their highest and best use in the market. The fair values of property, plant and equipment, other than real properties, are based on the consideration that unless otherwise identified, they will continue to be used "as is" and as part of the ongoing business. In contemplation of the in-use premise and the nature of the assets, the fair value is developed primarily using a cost approach.
The fair value of noncontrolling interests, when applicable, are estimated by applying an income approach and is based on significant inputs that are not observable in the market and thus represents a fair value measurement categorized within Level 3 of the fair value hierarchy. Key assumptions in the valuation of noncontrolling interest included a discount rate, a terminal value based on a range of long-term sustainable growth rates and adjustments because of the lack of control that market participants would consider when measuring the fair value of the noncontrolling interests.
The fair value of contingent consideration liabilities is estimated by applying an income approach using the Black-Scholes option pricing model. The fair value measurements are based on significant inputs that are not observable in the market and thus represents a fair value measurement categorized within Level 3 of the fair value hierarchy. Key assumptions in the valuation of contingent consideration liabilities include discount rates, expected terms, volatility rates and operating results as applicable based on the targets identified in the respective acquisition agreements.
At December 31, 2021, we have not finalized the purchase accounting related to $680.2 million of net assets acquired during the year in connection with the acquisitions described in Note 3 to the consolidated financial statements included elsewhere in this Annual Report on Form 10-K. The estimates used to determine the allocation of the purchase price may be modified up to one year from the date of the acquisition as more information is obtained about the fair value of assets acquired and liabilities assumed. Based on historical acquisitions, we do not expect any material adjustments to the current estimates at this time.
See Notes 1 and 3 to the consolidated financial statements included elsewhere in this Annual Report on Form 10-K for additional information.
46
Asset Impairments
Factors that could result in future impairment charges or changes in useful lives, among others, include changes in worldwide economic conditions, changes in technology, changes in competitive conditions and customer preferences, and fluctuations in foreign currency exchange rates. These risk factors are discussed in Part I, Item 1A, "Risk Factors," included elsewhere in this Annual Report on Form 10-K.
Goodwill and indefinite-lived intangible assets
The Company tests indefinite-lived intangible assets and goodwill for impairment annually by either performing a qualitative evaluation or a quantitative test. The qualitative evaluation is an assessment of factors to determine whether it is more likely than not that the fair values of a reporting unit or indefinite-lived intangible asset is less than its carrying amount. Fair values used under the quantitative impairment assessment are estimated using a combination of discounted projected future earnings or cash flow methods that are based on projections of the amounts and timing of future revenue and cash flows, and multiples of earnings in estimating fair value. In conjunction with our impairment assessments of indefinite-lived intangible assets, we also review the reasonableness of the indefinite useful lives associated with these assets, in which we evaluate whether indicators exist that future cash flows associated with these assets could be realized over a finite period.
In 2021, we performed a qualitative evaluation for impairment over our reporting units and indefinite-lived intangible assets and concluded that it was not more likely than not that the fair values are less than the respective carrying amounts.
The inputs utilized in a quantitative analysis are classified as Level 3 inputs within the fair value hierarchy as defined in ASC 820, "Fair Value Measurement." The process of evaluating the potential impairment of goodwill and indefinite-lived intangible assets is subjective because it requires the use of estimates and assumptions as to our future cash flows, discount rates commensurate with the risks involved in the assets, future economic and market conditions, as well as other key assumptions. Based on the results of our 2021 qualitative evaluation, we do not believe the meaningful estimates and assumptions supporting the goodwill and indefinite-lived intangible assets balances have changed materially from our most recent quantitative evaluation in 2019, which rendered cushions in excess of 77% for all reporting units. We believe that the amounts recorded in the financial statements related to goodwill and indefinite-lived intangible assets are based on the best estimates and judgments of the appropriate Axalta management, although actual outcomes could differ from our estimates.
See Note 1 to the consolidated financial statements included elsewhere in this Annual Report on Form 10-K for additional information.
Long-Lived Assets
Long-lived assets, which includes property, plant and equipment, and definite-lived intangible assets, such as technology, trademarks, customer relationships and non-compete agreements, are continually assessed for impairment at the asset group level whenever events or changes in circumstances indicate the carrying amount of the asset group may not be recoverable. Such impairment assessments involve comparing the carrying amount of the asset group, determined at the lowest level for which identifiable cash flows are largely independent of the cash flows of other groups of assets, to the forecasted undiscounted future cash flows generated by that asset group (i.e., a recoverability test). In the event the carrying amount of the asset group exceeds the undiscounted future cash flows generated by that asset group and the carrying amount is not considered recoverable, an impairment exists. An impairment loss is measured as the excess of the asset group's carrying amount over its fair value.
Stock-Based Compensation
Compensation expense related to service-based, non-qualified stock options is equivalent to the grant-date fair value of the awards determined under the Black-Scholes option pricing model and is recognized as compensation expense over the service period utilizing the graded vesting attribution method.
Compensation expense related to the restricted stock awards and restricted stock units is equal to the grant-date fair value of the awards determined by the closing share price on the date of the grant. The related expense is recognized as compensation expense over the service period utilizing the graded vesting attribution method.
Compensation expense related to performance stock awards and performance share units which are determined to have a market condition is determined at the grant-date of the awards using a valuation methodology (Monte Carlo simulation model) to account for the market conditions linked to these awards and are recognized as compensation expense over the service period utilizing the graded vesting attribution method.
We recognize compensation expense net of forfeitures, which we have elected to record at the time of occurrence.
See Note 9 to the consolidated financial statements included elsewhere in this Annual Report on Form 10-K for further detail on stock-based compensation.
47
Retirement Benefits
The amounts recognized in the audited financial statements related to pension benefits are determined from actuarial valuations. Inherent in these valuations are assumptions including expected return on plan assets, discount rates at which liabilities could have been settled, rate of increase in future compensations levels, and mortality rates. These assumptions are updated annually and are disclosed in Note 8 to the consolidated financial statements included elsewhere in this Annual Report on Form 10-K. In accordance with U.S. GAAP, actual results that differed from the assumptions are accumulated and amortized over future periods and therefore, affect expense recognized in future periods.
The estimated impact of either a 100 basis point increase or decrease of the discount rate to the net periodic benefit cost for 2022 would result in an increase of approximately $1.0 million or a decrease of approximately $0.3 million, respectively. The estimated impact of a 100 basis point increase or decrease of the expected return on assets assumption on the net periodic benefit cost for 2022 would result in a decrease or increase of approximately $2.3 million, respectively.
Income taxes
The provision for income taxes was determined using the asset and liability approach of accounting for income taxes. Under this approach, deferred taxes represent the future tax consequences expected to occur when the reported amounts of assets and liabilities are recovered or paid. The provision for income taxes represents income taxes paid or payable for the current year plus the change in deferred taxes during the period. Deferred taxes result from differences between the financial and tax basis of our assets and liabilities and are adjusted for changes in tax rates and tax laws when changes are enacted. Valuation allowances are recorded to reduce deferred tax assets when it is more likely than not that a tax benefit will not be realized. Deferred tax assets and liabilities are measured using enacted tax rates applicable in the years in which they are expected to be recovered or settled. The effect on deferred tax assets and liabilities of a change in tax law is recognized in income in the period that includes the enactment date.
The Company records a valuation allowance if, based upon the weight of the available evidence, it is more likely than not that some or all of the deferred tax assets will not be realized. The Company must generate approximately $373.1 million of taxable income to fully realize its consolidated net deferred tax assets as of December 31, 2021.
We evaluate the recoverability of deferred tax assets on a jurisdictional basis by assessing the adequacy of future expected taxable income from all sources, including the reversal of taxable temporary differences, forecasted core business earnings and available tax planning strategies. Our net deferred tax asset balance as of December 31, 2021 is $6.8 million, net of valuation allowances of $210.9 million. In instances where we are in a three-year cumulative loss, we assess all positive and negative factors including any potential aberrational items which may be included within our taxable results. The aberrational items which have impacted our results include debt extinguishment, refinancing and certain global restructuring costs. We believe, and have assumed, these types of losses are not indicative of our core earnings for purposes of assessing the appropriateness of a valuation allowance. Assumptions around sources of taxable income inherently rely heavily on estimates. We use our historical experience and our short and long-range business forecasts to provide insight. While the Company believes that its judgments and estimations regarding deferred tax assets are appropriate, significant differences in actual experience may require the Company to adjust its valuation allowance and could materially affect the Company's future financial results.
We provide for income and foreign withholding taxes, where applicable, on unremitted earnings of all subsidiaries and related companies to the extent that such earnings are not deemed to be permanently invested and cannot be repatriated in a tax-free manner. At December 31, 2021 and 2020, deferred income taxes of approximately $10.6 million and $7.1 million, respectively, have been provided on such subsidiary earnings, respectively. At December 31, 2021, and 2020, we have not recorded a deferred tax liability related to withholding taxes of approximately $177.5 million and $96.1 million, respectively, on unremitted earnings of subsidiaries that are permanently invested.
The breadth of our operations and the global complexity of tax regulations require assessments of uncertainties and judgments in estimating taxes we will ultimately pay. The final taxes paid are dependent upon many factors, including negotiations with taxing authorities in various jurisdictions, outcomes of tax litigation and resolution of disputes arising from federal, state and international tax audits in the normal course of business. A liability for unrecognized tax benefits is recorded when management concludes that the likelihood of sustaining such positions upon examination by taxing authorities is less than "more likely than not". Interest and penalties accrued related to unrecognized tax benefits are included in the provision for income taxes. At December 31, 2021 and 2020, the Company had gross unrecognized tax benefits, excluding interest and penalties, for both domestic and foreign operations of $91.4 million and $99.6 million, respectively.
See Note 11 to the consolidated financial statements included elsewhere in this Annual Report on Form 10-K for further detail on our accounting for income taxes.
48
Sales deductions
In our refinish end-market, our product sales are typically supplied through a network of distributors. Control transfers and revenue is recognized when our products are delivered to our distribution customers. Variable consideration in the form of price, less discounts and rebates, are estimated and recorded, as a reduction to net sales, upon the sale of our products based on our ability to make a reasonable estimate of the amounts expected to be received or incurred. The estimates of variable consideration involve significant assumptions based on the best estimates of inventory held by distributors, applicable pricing, as well as the use of historical actuals for sales, discounts and rebates, which may result in changes in estimates in the future.
The timing of payments associated with the above arrangements may differ from the timing associated with the satisfaction of our performance obligations. The period between the satisfaction of the performance obligation and the receipt of payment is dependent on terms and conditions specific to the customers. For transactions in which we expect, at contract inception, the period between the transfer of our products or services to our customer and when the customer pays for that good or service to be greater than one year, we adjust the promised amount of consideration for the effects of any significant financing components that materially change the amount of revenue under the contract.
See Note 2 to the consolidated financial statements included elsewhere in this Annual Report on Form 10-K for further detail on our revenue.
Contingencies
Contingencies, by their nature, relate to uncertainties that require management to exercise judgment both in assessing the likelihood that a liability has been incurred as well as in estimating the amount of potential loss. The most important contingencies impacting our financial statements are those related to environmental remediation, operational matters, pending or threatened litigation against the Company and the resolution of matters related to open tax years.
Costs related to the operational matter described in Note 6 to the consolidated financial statements included elsewhere in this Annual Report on Form 10-K are accrued when it is probable that a liability has been incurred and the amount can be reasonably estimated. Estimates of probable liabilities for the operational matter require assumptions pertaining to costs incurred by our customers to repair the impacted products. Assumptions include the ultimate number of impacted products that are repaired, re-use of damaged materials, labor rates and efficiency of individuals performing the repairs. A 10% decrease in the total number of products repaired would result in an approximately $5.5 million reduction in the estimated liability. Insurance recoveries related to the operational matter are recorded when probable to the extent they cover incurred or probable liabilities, while recoveries in excess of incurred or probable liabilities are recorded when collection is realizable.
Environmental remediation costs are accrued when it is probable that a liability has been incurred and the amount can be reasonably estimated. Estimates of environmental reserves require evaluating government regulation, available technology, site-specific information and remediation alternatives. We accrue an amount equal to our best estimate of the costs to remediate based upon the available information. The extent of environmental impacts may not be fully known, and the processes and costs of remediation may change as new information is obtained or technology for remediation is improved. Our process for estimating the expected cost for remediation considers the information available, technology that can be utilized and estimates of the extent of environmental damage. Adjustments to our estimates are made periodically as additional information is received and as remediation progresses. The amounts historically accrued for environmental remediation costs are not material to our financial statements.
We are subject to legal proceedings, claims and potential claims arising out of our business operations. We routinely assess the likelihood of any adverse outcomes to these matters, as well as ranges of probable losses. A determination of the amount of the reserves required, if any, for these contingencies is made after analysis of each known matter. We have an active risk management program consisting of numerous insurance policies secured from many carriers. These policies often provide coverage that is intended to minimize the financial impact, if any, of the legal proceedings. The required reserves may change in the future due to new developments in each matter.
For more information on these matters, see Note 6 and Note 11 to the consolidated financial statements included elsewhere in this Annual Report on Form 10-K.
49
ITEM 7A. QUANTITATIVE AND QUALITATIVE DISCLOSURES ABOUT MARKET RISK
We are exposed to changes in interest rates and foreign currency exchange rates because we finance certain operations through fixed and variable rate debt instruments and denominate our transactions in a variety of foreign currencies. We are also exposed to changes in the prices of certain commodities that we use in production. Changes in these rates and commodity prices may have an impact on future cash flows and earnings.
We manage these risks through normal operating and financing activities and, when deemed appropriate, through the use of derivative financial instruments. We do not enter into derivative financial instruments for trading or speculative purposes.
By using derivative instruments, we are subject to credit and market risk. The fair market value of the derivative instruments is determined by using valuation models whose inputs are derived using market observable inputs, including interest rate yield curves, as well as foreign exchange and commodity spot and forward rates, and reflects the asset or liability position as of the end of each reporting period. When the fair value of a derivative contract is positive, the counterparty owes us, thus creating a receivable risk for us. We are exposed to counterparty credit risk in the event of non-performance by counter-parties to our derivative agreements. We minimize counterparty credit (or repayment) risk by entering into transactions with major financial institutions of investment grade credit rating.
Our exposure to market risk is not hedged in a manner that completely eliminates the effects of changing market conditions on earnings or cash flow.
Interest rate risk
We are subject to interest rate market risk in connection with our borrowings. A one-eighth percent change in the applicable interest rate for borrowings under the Senior Secured Credit Facilities (assuming the Revolving Credit Facility is undrawn) would have an annual impact of approximately $0.9 million on cash interest expense considering the impact of our hedging positions currently in place.
We selectively use derivative instruments to reduce market risk associated with changes in interest rates. The use of derivatives is intended for hedging purposes only and we do not enter into derivative instruments for speculative purposes.
For further detail on our use of derivative instruments, see Note 19 to the consolidated financial statements included elsewhere in this Annual Report on Form 10-K.
Foreign exchange rates risk
We are exposed to foreign currency exchange risk by virtue of the translation of our international operations from local currencies into the U.S. Dollar. The majority of our net sales for the years ended December 31, 2021, 2020 and 2019 were from operations outside the United States. At December 31, 2021 and 2020, the accumulated other comprehensive loss account on the consolidated balance sheets included a cumulative translation loss of $331.3 million and $282.0 million, respectively. A hypothetical 10% increase in the value of the U.S. Dollar relative to all foreign currencies would have increased the cumulative translation loss by $244.3 million. This sensitivity analysis is inherently limited as it assumes that rates of multiple foreign currencies are moving in the same direction relative to the value of the U.S. Dollar.
Uncertainty in the global market conditions has resulted in, and may continue to cause, significant volatility in foreign currency exchange rates which could increase these risks.
In the majority of our jurisdictions, we earn revenue and incur costs in the local currency of such jurisdiction. We earn significant revenues and incur significant costs in foreign currencies including the Euro, Mexican Peso, Brazilian Real and the Chinese Renminbi. As a result, movements in exchange rates could cause our revenues and expenses to materially fluctuate, impacting our future profitability and cash flows. Our purchases of raw materials in Latin America, EMEA and Asia Pacific and future business operations and opportunities, including the continued expansion of our business outside North America, may further increase the risk that cash flows resulting from these activities may be adversely affected by changes in currency exchange rates. If and when appropriate, we intend to manage these risks through foreign currency hedges and/or by utilizing local currency funding of these expansions. We do not intend to hold financial instruments for trading or speculative purposes.
Additionally, in order to fund the purchase price for certain assets of DPC and the capital stock and other equity interests of certain non-U.S. entities, a combination of equity contributions and intercompany loans were utilized to capitalize certain non-U.S. subsidiaries. In certain instances, the intercompany loans are denominated in currencies other than the functional currency of the affected subsidiaries. Where intercompany loans are not a component of permanently invested capital of the affected subsidiaries, increases or decreases in the value of the subsidiaries' functional currency against other currencies will affect our results of operations. We use these intercompany loans to offset the exposure to profitability and cash flows created by external loans denominated in currencies that are different from the function currency of the issuing entities, including our 2025 Euro Senior Notes, which are denominated in Euros.
50
Commodity price risk
We are subject to changes in our cost of sales caused by movements in underlying commodity prices (primarily oil and natural gas). Between 40% and 50% of our cost of sales is represented by raw materials, even during 2021 despite significant raw material inflation experienced throughout the year. A substantial portion of the purchased raw materials include monomers, pigments, resins and solvents. Our price fluctuations generally follow industry indices. We historically have not entered into long-term purchase contracts related to the purchase of raw materials. If and when appropriate, we intend to manage these risks using purchase contracts with our suppliers.
Treasury policy
Our treasury policy seeks to ensure that adequate financial resources are available for the development of our businesses while managing our currency and interest rate risks. Our policy is to not engage in speculative transactions. Our policies with respect to the major areas of our treasury activity are set forth above.
51
ITEM 8. FINANCIAL STATEMENTS AND SUPPLEMENTARY DATA
Index
Report of Independent Registered Public Accounting Firm (PCAOB ID: |
||||||||
52
Report of Independent Registered Public Accounting Firm
To the Board of Directors and Shareholders of Axalta Coating Systems Ltd.
Opinions on the Financial Statements and Internal Control over Financial Reporting
We have audited the accompanying consolidated balance sheets of Axalta Coating Systems Ltd. and its subsidiaries (the "Company") as of December 31, 2021 and 2020, and the related consolidated statements of operations, of comprehensive income, of changes in shareholders' equity, and of cash flows for each of the three years in the period ended December 31, 2021, including the related notes and schedule of valuation and qualifying accounts for each of the three years in the period ended December 31, 2021 appearing under item 15(a)(2) (collectively referred to as the "consolidated financial statements"). We also have audited the Company's internal control over financial reporting as of December 31, 2021, based on criteria established in Internal Control - Integrated Framework (2013) issued by the Committee of Sponsoring Organizations of the Treadway Commission (COSO).
In our opinion, the consolidated financial statements referred to above present fairly, in all material respects, the financial position of the Company as of December 31, 2021 and 2020, and the results of its operations and its cash flows for each of the three years in the period December 31, 2021 in conformity with accounting principles generally accepted in the United States of America. Also in our opinion, the Company maintained, in all material respects, effective internal control over financial reporting as of December 31, 2021, based on criteria established in Internal Control - Integrated Framework (2013) issued by the COSO.
Change in Accounting Principle
As discussed in Note 7 to the consolidated financial statements, the Company changed the manner in which it accounts for leases in 2019.
Basis for Opinions
The Company's management is responsible for these consolidated financial statements, for maintaining effective internal control over financial reporting, and for its assessment of the effectiveness of internal control over financial reporting, included in Management's Report on Internal Control over Financial Reporting appearing under Item 9A. Our responsibility is to express opinions on the Company's consolidated financial statements and on the Company's internal control over financial reporting based on our audits. We are a public accounting firm registered with the Public Company Accounting Oversight Board (United States) (PCAOB) and are required to be independent with respect to the Company in accordance with the U.S. federal securities laws and the applicable rules and regulations of the Securities and Exchange Commission and the PCAOB.
We conducted our audits in accordance with the standards of the PCAOB. Those standards require that we plan and perform the audits to obtain reasonable assurance about whether the consolidated financial statements are free of material misstatement, whether due to error or fraud, and whether effective internal control over financial reporting was maintained in all material respects.
Our audits of the consolidated financial statements included performing procedures to assess the risks of material misstatement of the consolidated financial statements, whether due to error or fraud, and performing procedures that respond to those risks. Such procedures included examining, on a test basis, evidence regarding the amounts and disclosures in the consolidated financial statements. Our audits also included evaluating the accounting principles used and significant estimates made by management, as well as evaluating the overall presentation of the consolidated financial statements. Our audit of internal control over financial reporting included obtaining an understanding of internal control over financial reporting, assessing the risk that a material weakness exists, and testing and evaluating the design and operating effectiveness of internal control based on the assessed risk. Our audits also included performing such other procedures as we considered necessary in the circumstances. We believe that our audits provide a reasonable basis for our opinions.
As described in Management's Report on Internal Control over Financial Reporting, management has excluded U-POL Holdings Limited (U-POL) from its assessment of internal control over financial reporting as of December 31, 2021 because it was acquired by the Company in a purchase business combination during 2021. We have also excluded U-POL from our audit of internal control over financial reporting. U-POL is a wholly-owned subsidiary whose total assets and total revenues excluded from management's assessment and our audit of internal control over financial reporting represent 1.4% and 0.9%, respectively, of the related consolidated financial statement amounts as of and for the year ended December 31, 2021.
Definition and Limitations of Internal Control over Financial Reporting
A company's internal control over financial reporting is a process designed to provide reasonable assurance regarding the reliability of financial reporting and the preparation of financial statements for external purposes in accordance with generally accepted accounting principles. A company's internal control over financial reporting includes those policies and procedures that (i) pertain to the maintenance of records that, in reasonable detail, accurately and fairly reflect the transactions and
53
dispositions of the assets of the company; (ii) provide reasonable assurance that transactions are recorded as necessary to permit preparation of financial statements in accordance with generally accepted accounting principles, and that receipts and expenditures of the company are being made only in accordance with authorizations of management and directors of the company; and (iii) provide reasonable assurance regarding prevention or timely detection of unauthorized acquisition, use, or disposition of the company's assets that could have a material effect on the financial statements.
Because of its inherent limitations, internal control over financial reporting may not prevent or detect misstatements. Also, projections of any evaluation of effectiveness to future periods are subject to the risk that controls may become inadequate because of changes in conditions, or that the degree of compliance with the policies or procedures may deteriorate.
Critical Audit Matters
The critical audit matter communicated below is a matter arising from the current period audit of the consolidated financial statements that was communicated or required to be communicated to the audit committee and that (i) relates to accounts or disclosures that are material to the consolidated financial statements and (ii) involved our especially challenging, subjective, or complex judgments. The communication of critical audit matters does not alter in any way our opinion on the consolidated financial statements, taken as a whole, and we are not, by communicating the critical audit matter below, providing a separate opinion on the critical audit matter or on the accounts or disclosures to which it relates.
Measurement of Unrecognized Tax Benefits
As described in Notes 1 and 11 to the consolidated financial statements, management has recorded unrecognized tax benefits of $100.1 million as of December 31, 2021. As disclosed by management, the breadth of operations and the global complexity of tax regulations require assessments of uncertainties and judgments in estimating taxes. The final taxes paid are dependent upon many factors, including negotiations with taxing authorities in various jurisdictions, outcomes of tax litigation and resolution of disputes arising from federal, state and international tax audits in the normal course of business. A liability for unrecognized tax benefits is recorded when management concludes that the likelihood of sustaining such positions upon examination by taxing authorities is less than "more-likely-than not."
The principal considerations for our determination that performing procedures relating to the measurement of unrecognized tax benefits is a critical audit matter are the significant judgment by management when applying the more-likely-than-not recognition criteria to the Company's tax positions, which in turn led to a high degree of auditor judgment, subjectivity, and effort in performing procedures and evaluating audit evidence obtained related to the measurement of unrecognized tax benefits. Additionally, the audit effort involved the use of professionals with specialized skill and knowledge.
Addressing the matter involved performing procedures and evaluating audit evidence in connection with forming our overall opinion on the consolidated financial statements. These procedures included testing the effectiveness of controls relating to the identification and recognition of the liability for unrecognized tax benefits, including controls addressing completeness of the unrecognized tax benefits and controls over measurement of the liability. These procedures also included, among others, evaluating the significant judgment used by management in applying the more-likely-than-not recognition criteria and in measuring the Company's unrecognized tax benefits. Professionals with specialized skill and knowledge were used to assist in evaluating the reasonableness of assumptions made by management, the technical merits of positions taken based upon application of the tax law and new information, and the measurement of unrecognized tax benefits.
/s/ PricewaterhouseCoopers LLP
February 18, 2022
We have served as the Company's auditor since 2011.
54
AXALTA COATING SYSTEMS LTD.
Consolidated Statements of Operations
(In millions, except per share data)
| Year Ended December 31, | ||||||||||||||||||||
| 2021 | 2020 | 2019 | ||||||||||||||||||
Net sales |
$ | $ | $ | |||||||||||||||||
Cost of goods sold |
||||||||||||||||||||
Selling, general and administrative expenses |
||||||||||||||||||||
| Other operating charges | ||||||||||||||||||||
Research and development expenses |
||||||||||||||||||||
Amortization of acquired intangibles |
||||||||||||||||||||
Income from operations |
||||||||||||||||||||
Interest expense, net |
||||||||||||||||||||
| Other (income) expense, net | ( |
( |
||||||||||||||||||
Income before income taxes |
||||||||||||||||||||
Provision for income taxes |
||||||||||||||||||||
Net income |
||||||||||||||||||||
Less: Net income attributable to noncontrolling interests |
||||||||||||||||||||
Net income attributable to controlling interests |
$ | $ | $ | |||||||||||||||||
Basic net income per share |
$ | $ | $ | |||||||||||||||||
Diluted net income per share |
$ | $ | $ | |||||||||||||||||
The accompanying notes are an integral part of these consolidated financial statements.
55
AXALTA COATING SYSTEMS LTD.
Consolidated Statements of Comprehensive Income
(In millions)
| Year Ended December 31, | ||||||||||||||||||||
| 2021 | 2020 | 2019 | ||||||||||||||||||
| Net income | $ | $ | $ | |||||||||||||||||
| Other comprehensive income (loss), before tax: | ||||||||||||||||||||
| Foreign currency translation adjustments | ( |
|||||||||||||||||||
| Unrealized gain (loss) on derivatives | ( |
( |
||||||||||||||||||
| Unrealized gain (loss) on pension and other benefit plan obligations | ( |
( |
||||||||||||||||||
| Other comprehensive income (loss), before tax | ( |
( |
||||||||||||||||||
| Income tax expense (benefit) related to items of other comprehensive income | ( |
( |
||||||||||||||||||
| Other comprehensive income (loss), net of tax | ( |
( |
||||||||||||||||||
| Comprehensive income | ||||||||||||||||||||
| Less: Comprehensive (loss) income attributable to noncontrolling interests | ( |
( |
||||||||||||||||||
Comprehensive income attributable to controlling interests |
$ | $ | $ | |||||||||||||||||
The accompanying notes are an integral part of these consolidated financial statements.
56
AXALTA COATING SYSTEMS LTD.
Consolidated Balance Sheets
(In millions, except per share data)
| December 31, | ||||||||||||||
| 2021 | 2020 | |||||||||||||
| Assets | ||||||||||||||
| Current assets: | ||||||||||||||
| Cash and cash equivalents | $ | $ | ||||||||||||
| Restricted cash | ||||||||||||||
| Accounts and notes receivable, net | ||||||||||||||
| Inventories | ||||||||||||||
| Prepaid expenses and other current assets | ||||||||||||||
| Total current assets | ||||||||||||||
| Property, plant and equipment, net | ||||||||||||||
| Goodwill | ||||||||||||||
| Identifiable intangibles, net | ||||||||||||||
| Other assets | ||||||||||||||
| Total assets | $ | $ | ||||||||||||
| Liabilities, Shareholders' Equity | ||||||||||||||
| Current liabilities: | ||||||||||||||
| Accounts payable | $ | $ | ||||||||||||
| Current portion of borrowings | ||||||||||||||
| Other accrued liabilities | ||||||||||||||
| Total current liabilities | ||||||||||||||
| Long-term borrowings | ||||||||||||||
| Accrued pensions | ||||||||||||||
| Deferred income taxes | ||||||||||||||
| Other liabilities | ||||||||||||||
| Total liabilities | ||||||||||||||
| Commitments and contingent liabilities (Note 6) | ||||||||||||||
| Shareholders' equity | ||||||||||||||
Common shares, $ |
||||||||||||||
| Capital in excess of par | ||||||||||||||
| Retained earnings | ||||||||||||||
Treasury shares, at cost, |
( |
( |
||||||||||||
| Accumulated other comprehensive loss | ( |
( |
||||||||||||
| Total Axalta shareholders' equity | ||||||||||||||
| Noncontrolling interests | ||||||||||||||
| Total shareholders' equity | ||||||||||||||
| Total liabilities and shareholders' equity | $ | $ | ||||||||||||
The accompanying notes are an integral part of these consolidated financial statements.
57
AXALTA COATING SYSTEMS LTD.
Consolidated Statements of Changes in Shareholders' Equity
(In millions)
| Common Stock | |||||||||||||||||||||||||||||||||||||||||||||||
| Number of Shares | Par/Stated Value | Capital In Excess Of Par |
Retained Earnings | Treasury Shares, at cost | Accumulated Other Comprehensive Loss |
Non-controlling Interests |
Total | ||||||||||||||||||||||||||||||||||||||||
| Balance December 31, 2018 | $ | $ | $ | $ | ( |
$ | ( |
$ | $ | ||||||||||||||||||||||||||||||||||||||
| Comprehensive income (loss): | |||||||||||||||||||||||||||||||||||||||||||||||
| Net income | — | — | — | — | — | ||||||||||||||||||||||||||||||||||||||||||
Net realized and unrealized gain on derivatives, net of tax benefit of $ |
— | — | — | — | — | ( |
— | ( |
|||||||||||||||||||||||||||||||||||||||
Long-term employee benefit plans, net of tax benefit of $ |
— | — | — | — | — | ( |
— | ( |
|||||||||||||||||||||||||||||||||||||||
Foreign currency translation, net of tax of $ |
— | — | — | — | — | ||||||||||||||||||||||||||||||||||||||||||
| Total comprehensive income (loss) | — | — | — | — | ( |
||||||||||||||||||||||||||||||||||||||||||
| Cumulative effect of an accounting change | — | — | — | ( |
— | — | — | ( |
|||||||||||||||||||||||||||||||||||||||
| — | — | — | ( |
— | — | — | ( |
||||||||||||||||||||||||||||||||||||||||
| Recognition of stock-based compensation | — | — | — | — | — | — | |||||||||||||||||||||||||||||||||||||||||
Shares issued under compensation plans |
— | — | — | — | |||||||||||||||||||||||||||||||||||||||||||
| Changes in ownership of noncontrolling interests | — | — | — | — | — | ( |
( |
||||||||||||||||||||||||||||||||||||||||
| Common stock purchases | ( |
— | — | — | ( |
— | — | ( |
|||||||||||||||||||||||||||||||||||||||
| Dividends declared to noncontrolling interests | — | — | — | — | — | — | ( |
( |
|||||||||||||||||||||||||||||||||||||||
| Balance December 31, 2019 | $ | $ | $ | $ | ( |
$ | ( |
$ | $ | ||||||||||||||||||||||||||||||||||||||
| Comprehensive income (loss): | |||||||||||||||||||||||||||||||||||||||||||||||
| Net income | — | — | — | — | — | ||||||||||||||||||||||||||||||||||||||||||
Net realized and unrealized loss on derivatives, net of tax benefit of $ |
— | — | — | — | — | ( |
— | ( |
|||||||||||||||||||||||||||||||||||||||
Long-term employee benefit plans, net of tax benefit of $ |
— | — | — | — | — | ( |
— | ( |
|||||||||||||||||||||||||||||||||||||||
Foreign currency translation, net of tax of $ |
— | — | — | — | — | ( |
|||||||||||||||||||||||||||||||||||||||||
| Total comprehensive income (loss) | — | — | — | — | ( |
( |
|||||||||||||||||||||||||||||||||||||||||
| Cumulative effect of an accounting change | — | — | — | ( |
— | — | — | ( |
|||||||||||||||||||||||||||||||||||||||
| Recognition of stock-based compensation | — | — | — | — | — | — | |||||||||||||||||||||||||||||||||||||||||
Shares issued under compensation plans |
— | — | — | — | |||||||||||||||||||||||||||||||||||||||||||
| Changes in ownership of noncontrolling interests | — | — | ( |
— | — | — | ( |
( |
|||||||||||||||||||||||||||||||||||||||
| Common stock purchases | ( |
— | — | — | ( |
— | — | ( |
|||||||||||||||||||||||||||||||||||||||
| Dividends declared to noncontrolling interests | — | — | — | — | — | ( |
( |
||||||||||||||||||||||||||||||||||||||||
| Balance December 31, 2020 | $ | $ | $ | $ | ( |
$ | ( |
$ | $ | ||||||||||||||||||||||||||||||||||||||
| Comprehensive income (loss): | |||||||||||||||||||||||||||||||||||||||||||||||
| Net income | — | — | — | — | — | ||||||||||||||||||||||||||||||||||||||||||
Net realized and unrealized gain on derivatives, net of tax of $ |
— | — | — | — | — | — | |||||||||||||||||||||||||||||||||||||||||
Long-term employee benefit plans, net of tax of $ |
— | — | — | — | — | — | |||||||||||||||||||||||||||||||||||||||||
Foreign currency translation, net of tax of $ |
— | — | — | — | — | ( |
( |
( |
|||||||||||||||||||||||||||||||||||||||
| Total comprehensive income (loss) | — | — | — | — | ( |
||||||||||||||||||||||||||||||||||||||||||
| Recognition of stock-based compensation | — | — | — | — | — | — | |||||||||||||||||||||||||||||||||||||||||
Shares issued under compensation plans |
— | — | — | — | |||||||||||||||||||||||||||||||||||||||||||
| Common stock purchases | ( |
— | — | — | ( |
— | — | ( |
|||||||||||||||||||||||||||||||||||||||
| Dividends declared to noncontrolling interests | — | — | — | — | — | — | ( |
( |
|||||||||||||||||||||||||||||||||||||||
| Balance December 31, 2021 | $ | $ | $ | $ | ( |
$ | ( |
$ | $ | ||||||||||||||||||||||||||||||||||||||
The accompanying notes are an integral part of these consolidated financial statements.
58
AXALTA COATING SYSTEMS LTD.
Consolidated Statements of Cash Flows
(In millions)
| Year Ended December 31, | ||||||||||||||||||||
| 2021 | 2020 | 2019 | ||||||||||||||||||
| Operating activities: | ||||||||||||||||||||
| Net income | $ | $ | $ | |||||||||||||||||
| Adjustment to reconcile net income to cash provided by operating activities: | ||||||||||||||||||||
| Depreciation and amortization | ||||||||||||||||||||
| Amortization of deferred financing costs and original issue discount | ||||||||||||||||||||
| Debt extinguishment and refinancing related costs | ||||||||||||||||||||
| Deferred income taxes | ( |
|||||||||||||||||||
| Realized and unrealized foreign exchange losses, net | ||||||||||||||||||||
| Stock-based compensation | ||||||||||||||||||||
| Gain on sales of facilities | ( |
|||||||||||||||||||
| Interest income on swaps designated as net investment hedges | ( |
( |
( |
|||||||||||||||||
| Other non-cash, net | ||||||||||||||||||||
| Changes in operating assets and liabilities: | ||||||||||||||||||||
| Trade accounts and notes receivable | ( |
( |
( |
|||||||||||||||||
| Inventories | ( |
|||||||||||||||||||
| Prepaid expenses and other assets | ( |
( |
( |
|||||||||||||||||
| Accounts payable | ||||||||||||||||||||
| Other accrued liabilities | ( |
|||||||||||||||||||
| Other liabilities | ( |
|||||||||||||||||||
| Cash provided by operating activities | ||||||||||||||||||||
| Investing activities: | ||||||||||||||||||||
Acquisitions, net of cash acquired |
( |
( |
( |
|||||||||||||||||
| Purchase of property, plant and equipment | ( |
( |
( |
|||||||||||||||||
| Proceeds from sales of assets | ||||||||||||||||||||
| Interest proceeds on swaps designated as net investment hedges | ||||||||||||||||||||
| Other investing activities, net | ( |
|||||||||||||||||||
| Cash used for investing activities | ( |
( |
( |
|||||||||||||||||
| Financing activities: | ||||||||||||||||||||
| Proceeds from long-term borrowings | ||||||||||||||||||||
| Payments on short-term borrowings | ( |
( |
( |
|||||||||||||||||
| Payments on long-term borrowings | ( |
( |
( |
|||||||||||||||||
| Financing-related costs | ( |
( |
( |
|||||||||||||||||
| Net cash flows associated with stock-based awards | ||||||||||||||||||||
| Purchase of noncontrolling interests | ( |
( |
||||||||||||||||||
| Purchases of common stock | ( |
( |
( |
|||||||||||||||||
| Other financing activities | ( |
( |
( |
|||||||||||||||||
| Cash used for financing activities | ( |
( |
( |
|||||||||||||||||
| (Decrease) increase in cash and cash equivalents | ( |
|||||||||||||||||||
| Effect of exchange rate changes on cash | ( |
|||||||||||||||||||
| Cash at beginning of period | ||||||||||||||||||||
| Cash at end of period | $ | $ | $ | |||||||||||||||||
| Cash at end of period reconciliation: | ||||||||||||||||||||
| Cash and cash equivalents | $ | $ | $ | |||||||||||||||||
| Restricted cash | ||||||||||||||||||||
| Cash at end of period | $ | $ | $ | |||||||||||||||||
| Supplemental cash flow information: | ||||||||||||||||||||
| Cash paid during the year for: | ||||||||||||||||||||
| Interest, net of amounts capitalized | $ | $ | $ | |||||||||||||||||
| Income taxes, net of refunds | ||||||||||||||||||||
| Non-cash investing activities: | ||||||||||||||||||||
| Accrued capital expenditures | $ | $ | $ | |||||||||||||||||
The accompanying notes are an integral part of these consolidated financial statements.
59
Index
| Note | Page | |||||||
60
(1) BASIS OF PRESENTATION AND SUMMARY OF SIGNIFICANT ACCOUNTING POLICIES
Summary of Significant Accounting Policies
Principles of Consolidation
The consolidated financial statements include the accounts of Axalta and its subsidiaries, and entities in which a controlling interest is maintained. For those consolidated subsidiaries in which the Company's ownership is less than 100 %, the outside shareholders' interests are shown as noncontrolling interests. Investments in companies in which Axalta does not maintain control, but has the ability to exercise significant influence over operating and financial policies of the investee are accounted for using the equity method of accounting. As a result, Axalta's share of the earnings or losses of such equity affiliates is included in the accompanying consolidated statements of operations and our share of these companies' stockholders' equity is included in the accompanying consolidated balance sheets. Certain of our joint ventures are accounted for on a one-month lag basis, the effect of which is not material. We eliminated all intercompany accounts and transactions in the preparation of the accompanying consolidated financial statements.
Use of Estimates
The preparation of financial statements in conformity with GAAP requires us to make estimates and assumptions that affect the reported amounts of assets and liabilities at the date of the financial statements and the reported amounts of sales and expenses during the period. The estimates and assumptions include, but are not limited to, receivable and inventory valuations, fixed asset valuations, valuations of goodwill and identifiable intangible assets, including analysis of impairment, valuations of long-term employee benefit obligations, income taxes, environmental matters, contingencies, litigation, stock-based compensation, restructuring and allocations of costs. Our estimates are based on historical experience, facts and circumstances available at the time and various other assumptions that are believed to be reasonable. Actual results could differ materially from those estimates.
Accounting for Business Combinations
We account for business combinations under the acquisition method of accounting. This method requires the recording of acquired assets, including separately identifiable intangible assets and assumed liabilities at their acquisition date fair values. The method records any excess purchase price over the fair value of acquired net assets as goodwill. Included in the determination of the purchase price is the fair value of contingent consideration, if applicable, based on the terms and applicable targets described within the acquisition agreements (i.e., projected revenues or EBITDA). Subsequent to the acquisition date, the fair value of the contingent liability, if determined to be payable in cash, is revalued at each balance sheet date with adjustments recorded within earnings.
The determination of the fair value of assets acquired, liabilities assumed and noncontrolling interests involves assessments of factors such as the expected future cash flows associated with individual assets and liabilities and appropriate discount rates at the closing date of the acquisition. When necessary, we consult with external advisors to help determine fair value. For non-observable market values determined using Level 3 assumptions, we determine fair value using acceptable valuation principles, including most commonly the excess earnings method for customer relationships, relief from royalty method for technology and trademarks, cost method for inventory and a combination of cost and market methods for property, plant and equipment, as applicable.
We include the results of operations from the acquisition date in the financial statements for all businesses acquired.
Revenue Recognition
See Note 2 for disclosure of our revenue recognition accounting policy.
61
Cash, Cash Equivalents and Restricted Cash
Cash equivalents represent highly liquid investments considered readily convertible to known amounts of cash within three months or less from time of purchase. They are carried at cost plus accrued interest, which approximates fair value because of the short-term maturity of these instruments. Cash balances may exceed government insured limits in certain jurisdictions.
Restricted cash on our consolidated balance sheets represents cash held in escrow for pending contingent liabilities related to an acquisition made during the year ended December 31, 2021 and cash used to secure certain customer guarantees.
Fair Value Measurements
GAAP defines a fair value hierarchy that prioritizes the inputs to valuation techniques used to measure fair value. The hierarchy gives the highest priority to unadjusted quoted prices in active markets for identical assets or liabilities (Level 1 measurements) and the lowest priority to unobservable inputs (Level 3 measurements). A financial instrument's level within the fair value hierarchy is based on the lowest level of any input that is significant to the fair value measurement.
The following valuation techniques are used to measure fair value for assets and liabilities:
Level 1—Quoted market prices in active markets for identical assets or liabilities;
Level 2—Significant other observable inputs (i.e., quoted prices for similar items in active markets, quoted prices for identical or similar items in markets that are not active, inputs other than quoted prices that are observable such as interest rate and yield curves, and market-corroborated inputs); and
Level 3—Unobservable inputs for the asset or liability, which are valued based on management's estimates of assumptions that market participants would use in pricing the asset or liability.
Derivatives and Hedging
The Company from time to time utilizes derivatives to manage exposures to currency exchange rates and interest rate risk. The fair values of all derivatives are recognized as assets or liabilities at the balance sheet date. Changes in the fair value of these instruments are reported in income or accumulated other comprehensive loss ("AOCI"), depending on the use of the derivative and whether it qualifies for hedge accounting treatment and is designated as such.
Gains and losses on derivatives that qualify and are designated as cash flow or net investment hedges are recorded in AOCI, to the extent the hedges are effective, until the underlying transactions are recognized in income.
Gains and losses on derivatives qualifying and designated as fair value hedging instruments, as well as the offsetting losses and gains on the hedged items, are reported in income in the same accounting period. Derivatives not designated as hedging instruments are marked-to-market at the end of each accounting period with the results included in income.
Cash flows from derivatives are presented in the consolidated statements of cash flows in a manner consistent with the underlying transactions.
Receivables and Allowance for Doubtful Accounts
Receivables are carried at amounts that approximate fair value. Receivables are recognized net of an allowance for doubtful accounts receivable. The allowance for doubtful accounts reflects the current estimate of credit losses expected to be incurred over the life of the financial asset, based on historical experience, current conditions and reasonable forecasts of future economic conditions. Accounts receivable are written down or off when a portion or all of such account receivable is determined to be uncollectible.
Inventories
Inventories are valued at the lower of cost or net realizable value with cost being determined on the weighted average cost method. Elements of cost in inventories include:
•raw materials,
•direct labor, and
•manufacturing and indirect overhead.
62
Property, Plant and Equipment
Property, plant and equipment acquired in an acquisition are recorded at fair value as of the acquisition date and are depreciated over the estimated useful life using the straight-line method. Property, plant and equipment purchases are recorded at cost and are depreciated over the estimated useful life using the straight-line method starting on the date they are placed in service. See Note 15 for a range of estimated useful lives used for each property, plant and equipment class.
Software included in property, plant and equipment represents the costs of software developed or obtained for internal use. Software costs are amortized on a straight-line basis over their estimated useful lives. Upgrades and enhancements are capitalized if they result in added functionality, which enables the software to perform tasks it was previously incapable of performing. Software maintenance and training costs are expensed in the period in which they are incurred.
Leases
See Note 7 for disclosure of our accounting policy over leases.
Goodwill and Other Identifiable Intangible Assets
Goodwill represents the excess of the purchase price over the fair values of the underlying net assets acquired in a business combination. Goodwill and indefinite-lived intangible assets are tested for impairment on an annual basis as of October 1st; however, these tests are performed more frequently if events or changes in circumstances indicate that the asset may be impaired. The fair value methodology utilizes multiple valuation methodologies and assumptions, including prices of similar assets, where applicable, or discounted cash flow techniques.
When testing goodwill and indefinite-lived intangible assets for impairment, we first have an option to assess qualitative factors to determine whether the existence of events or circumstances leads to a determination that it is more likely than not (more than 50%) that an impairment exists. Such qualitative factors may include the following: macroeconomic conditions; industry and market considerations; cost factors; overall financial performance; and other relevant entity-specific events. If based on this qualitative assessment we determine that an impairment is more likely than not, or if we elect not to perform a qualitative assessment, we would be required to perform a quantitative impairment test.
Under the quantitative impairment test, the evaluation of impairment involves comparing the current fair value of each reporting unit, with respect to goodwill, and indefinite-lived intangible asset to its carrying value. If the fair value of the reporting unit or indefinite-lived intangible asset is less than the carrying value, the difference is recorded as an impairment loss not to exceed the amount of recorded goodwill or carrying value of the respective indefinite-lived intangible asset.
In 2021, we performed a qualitative evaluation for impairment over our reporting units and indefinite-lived intangible assets and concluded that it was not more likely than not that the fair values are less than the respective carrying amounts.
Impairment of Long-Lived Assets
The carrying value of long-lived assets to be held and used is evaluated when events or changes in circumstances indicate the carrying value may not be recoverable. The carrying value of a long-lived asset is considered impaired when the total projected undiscounted cash flows from the asset is less than its carrying value. In that event, a loss is recognized based on the amount by which the carrying value exceeds the fair value of the long-lived asset. The fair value methodology used is an estimate of fair market value and is based on prices of similar assets or other valuation methodologies including present value techniques. Long-lived assets to be disposed of other than by sale are classified as held for use until their disposal. Long-lived assets to be disposed of by sale are classified as held for sale after all applicable attributes in the guidance are met and are reported at the lower of carrying amount or fair market value less cost to sell. Depreciation is discontinued for long-lived assets classified as held for sale.
63
Research and Development
Research and development costs incurred in the normal course of business consist primarily of employee-related costs and are expensed as incurred. In-process research and development projects acquired in a business combination are recorded as intangible assets at their fair value as of the acquisition date, using Level 3 assumptions. Subsequent costs related to acquired in-process research and development projects are expensed as incurred. In-process research and development intangible assets are considered indefinite-lived until the abandonment or completion of the associated research and development efforts. These indefinite-lived intangible assets are tested for impairment consistent with the impairment testing performed on other indefinite-lived intangible assets discussed above. Upon completion of the research and development process, the carrying value of acquired in-process research and development projects is reclassified as a finite-lived asset and is amortized over its useful life. Once amortization commences, these assets are tested for impairment consistent with long-lived assets as discussed above.
Environmental Liabilities and Expenditures
Accruals for environmental matters are recorded when it is probable that a liability has been incurred and the amount of the liability can be reasonably estimated. Accrued environmental liabilities are not discounted. Claims for recovery from third parties, if any, are reflected separately as an asset. We record recoveries at the earlier of when the gain is probable and reasonably estimable or realized.
Costs related to environmental remediation are charged to expense in the period incurred. Other environmental costs are also charged to expense in the period incurred, unless they increase the value of the property or reduce or prevent contamination from future operations, in which case, they are capitalized and depreciated.
Contingencies and Litigation
We accrue for liabilities related to contingencies including the operational matter discussed in Note 6 and litigation matters when available information indicates that the liability is probable, and the amount can be reasonably estimated. Legal costs such as outside counsel fees and expenses are charged to expense in the period incurred.
Income Taxes
Deferred tax assets and liabilities are recognized for the future tax consequences attributable to differences between the financial statement carrying amounts of assets and liabilities and their respective tax basis. Deferred tax assets are also recognized for tax losses, interest and tax credit carryforwards. Valuation allowances are recorded to reduce deferred tax assets when it is more likely than not that a tax benefit will not be realized. Deferred tax assets and liabilities are measured using enacted tax rates applicable in the years in which they are expected to be recovered or settled. The effect on deferred tax assets and liabilities of a change in tax law is recognized in income in the period that includes the enactment date.
Where we do not intend to indefinitely reinvest earnings of our subsidiaries, we provide for income taxes and withholding taxes, where applicable, on unremitted earnings. We do not provide for income taxes on unremitted earnings of our subsidiaries that are intended to be indefinitely reinvested.
Foreign Currency Translation
Our reporting currency is the U.S. Dollar. In most cases, our non-U.S. based subsidiaries use their local currency as the functional currency for their respective business operations. Assets and liabilities of these operations are translated into U.S. Dollars at end-of-period exchange rates; income and expenses are translated using the average exchange rates for the reporting period. Resulting cumulative translation adjustments are recorded as a component of shareholders' equity in the accompanying consolidated balance sheets in AOCI.
Gains and losses from transactions denominated in currencies other than functional currencies are included in the consolidated statements of operations in other (income) expense, net.
64
Employee Benefits
Defined benefit plans specify an amount of pension benefit that an employee will receive upon retirement, usually dependent on factors such as age, years of service and compensation. The obligation in respect of defined benefit plans is calculated separately for each plan by estimating the amount of the future benefits that employees earn in return for their service in the current and prior periods. These benefits are then discounted to determine the present value of the obligations and are then adjusted for the impact of any unamortized prior service costs. The discount rate used is based upon market indicators in the region (generally, the yield on bonds that are denominated in the currency in which the benefits will be paid and that have maturity dates approximating the terms of the obligations). The calculations are performed by qualified actuaries using the projected unit credit method. The obligation of defined benefit plans recorded on our consolidated balance sheets is net of the current fair value of assets within each respective plan. See Note 8 for further information.
Earnings per Common Share
Basic earnings per common share is computed by dividing net income attributable to Axalta's common shareholders by the weighted average number of shares outstanding during the period. Diluted earnings per common share is computed by dividing net income attributable to Axalta's common shareholders by the weighted average number of shares outstanding during the period increased by the number of additional shares that would have been outstanding related to potentially dilutive securities; anti-dilutive securities are excluded from the calculation. These potentially dilutive securities are calculated under the treasury stock method and all outstanding stock options, restricted stock awards, restricted stock units, performance stock awards and performance share units.
Recently Adopted Accounting Guidance
In March 2020, we adopted ASU 2020-04, "Reference Rate Reform," which provides optional expedients exercisable through December 31, 2022 to ease the potential burden in accounting for the effects of reference rate reform on financial reporting. In January 2021, the FASB issued ASU No. 2021-01, "Reference Rate Reform (Topic 848): Scope," which clarified the scope and application of the original guidance. As of December 31, 2021, the expedients provided in this standard do not impact the Company. We will continue to monitor for potential impacts on our financial statements. See Notes 18 and 19 for further information.
In December 2020, we adopted ASU 2019-12, "Simplifying the Accounting for Income Taxes," which simplifies the accounting for income taxes by removing certain exceptions to the general principles in Topic 740 and updating provisions related to accounting for franchise (or similar) tax partially based on income and interim recognition of enactment of tax law changes. The adoption of this standard did not have a material impact on our financial statements.
Risks and Uncertainties
In March 2020, the World Health Organization characterized the coronavirus ("COVID-19") as a pandemic, and the COVID-19 outbreak was declared a national emergency in the United States. The rapid spread of the pandemic and the continuously evolving responses to combat it have had a negative impact on the global economy. The Company's results of operations, financial condition and cash flows were significantly impacted during 2020 as a result of the pandemic and we continue to see impacts to our business given the continued significant presence, and actual or potential spread, of the virus globally, as well as preventative measures enacted in certain regions of the world. We are currently unable to fully determine the future impact of COVID-19 on our business, though we believe the pandemic will continue to have a negative effect on our business during 2022, and potentially longer. We are monitoring the progression of the pandemic and its ongoing and potential effect on our financial position, results of operations, and cash flows, which effects could be materially adverse in a particular quarterly reporting period as well as on an annual basis.
(2) REVENUE
65
Revenue is measured as the amount of consideration we expect to receive in exchange for our products or services. Our contracts, including those subject to standard terms and conditions under multi-year agreements, are largely short-term in nature and each customer purchase order typically represents a contract with the delivery of coatings representing the only separate performance obligation.
For certain customer arrangements within our light vehicle, industrial and commercial vehicle end-markets, revenue is recognized upon shipment, as this is the point in time we have concluded that control of our product has transferred to our customer based on our considerations of the indicators of control in the contracts, including right of use and risk and reward of ownership. For consignment arrangements, revenue is recognized upon actual consumption by our customers, as this represents the point in time that control is determined to have transferred to the customer based on the contractual arrangement.
In our refinish end-market, our product sales are typically supplied through a network of distributors. Control transfers and revenue is recognized when our products are shipped to our distribution customers. Variable consideration in the form of price, less discounts and rebates, are estimated and recorded upon the shipment of our products based on our ability to make a reasonable estimate of the amounts expected to be received or incurred. The estimates of variable consideration involve significant assumptions based on the best estimates of inventory held by distributors, applicable pricing, as well as the use of historical actuals for sales, discounts and rebates, which may result in changes in estimates in the future.
The timing of payments associated with the above arrangements may differ from the timing associated with the satisfaction of our performance obligations. The period between the satisfaction of the performance obligation and the receipt of payment is dependent on terms and conditions specific to the customers. For transactions in which we expect, at contract inception, the period between the transfer of our products or services to our customer and when the customer pays for that good or service to be greater than one year, we adjust the promised amount of consideration for the effects of any significant financing components that materially change the amount of revenue under the contract.
We accrue for sales returns and other allowances based on our historical experience, as well as expectations based on current information relevant to our customers. We include the amounts billed to customers for shipping and handling fees in net sales and include costs incurred for the delivery of goods as cost of goods sold in the statement of operations.
Recognition of licensing and royalty income occurs at the point in time when agreed upon performance obligations are satisfied, the amount is fixed or determinable, and collectability is reasonably assured.
Consideration for products in which control has transferred to our customers that is conditional on something other than the passage of time is recorded as a contract asset within prepaid expenses and other current assets on the balance sheet. The contract asset balances at December 31, 2021 and 2020 were $36.1 million and $37.2 million, respectively.
Revenue Streams
Our revenue streams are disaggregated based on the types of products and services offered in contracts with our customers, which are depicted in each of our four end-markets.
•Refinish - We develop, market and supply a complete portfolio of innovative coatings systems and color matching technologies to facilitate faster automotive collision repairs relative to competing technologies. Our refinish products and systems include a range of coatings layers required to match the vehicle's color and appearance, producing a repair surface indistinguishable from the adjacent surface.
66
•Industrial - The industrial end-market is comprised of liquid and powder coatings used in a broad array of end-market applications. We are also a leading global developer, manufacturer and supplier of functional and decorative liquid and powder coatings for a large number of diversified applications in the industrial end-market. We provide a full portfolio of products for applications including architectural cladding and fittings, automotive coatings, general industrial, job coaters, energy solutions, HVAC, appliances, industrial wood, coil, and oil & gas pipelines.
•Light Vehicle - Light vehicle original equipment manufacturers ("OEMs") select coatings providers on the basis of their global ability to deliver core and advanced technological solutions that improve exterior appearance and durability and provide long-term corrosion protection. Customers also look for suppliers that offer sustainable solutions that aid to the customer portfolio transformation and can enhance process efficiency to improve productivity and provide superior technical service support.
•Commercial Vehicle - Sales in the commercial vehicle end-market are generated from a variety of applications including non-automotive transportation (i.e., heavy-duty truck, bus and rail), motorcycles, marine and aviation, as well as related markets such as trailers, recreational vehicles and personal sport vehicles. This end-market is primarily driven by global commercial vehicle production, which is influenced by overall economic activity, government infrastructure spending, equipment replacement cycles and evolving environmental standards for sustainability. Commercial vehicle OEMs select coatings providers on the basis of their ability to consistently deliver advanced technological solutions that improve exterior appearance, protection and durability and provide extensive color libraries and matching capabilities at the lowest total cost-in-use, while meeting stringent environmental requirements.
We also have other revenue streams which include immaterial revenues relative to the net sales of our four end-markets, comprised of sales from royalties and services, primarily within our light vehicle and refinish end-markets.
See Note 20 for disaggregated net sales by end-market.
67
(3) ACQUISITIONS
The pro-forma impacts on our results of operations, including the pro-forma effect of events that are directly attributable to the following acquisitions, were not significant.
Acquisition of U-POL Holdings Limited
On September 15, 2021, we completed the acquisition of U-POL Holdings Limited ("U-POL") for an aggregate cash purchase price of $619.8 million. The acquisition of U-POL, a leading supplier of paint, protective coatings and accessories primarily for the automotive aftermarket, strengthens Axalta's global refinish leadership position and supports its broader growth strategy. The results of the business are reported within our Performance Coatings segment. The U-POL acquisition was recorded as a business combination under ASC 805, "Business Combinations," with identifiable assets acquired and liabilities assumed recorded at their estimated fair values as of the acquisition date.
At December 31, 2021, we have not finalized the purchase accounting related to the U-POL acquisition and these amounts represent preliminary values. The allocation of the purchase price may be modified up to one year from the closing date of the acquisition as more information is obtained about the fair value of assets acquired and liabilities assumed. The purchase price was allocated as follows:
| September 15, 2021 (As initially reported) | Measurement Period Adjustments | September 15, 2021 (Adjusted) | ||||||||||||||||||
| Cash | $ | $ | $ | |||||||||||||||||
| Accounts and notes receivable, net | ||||||||||||||||||||
| Inventories | ||||||||||||||||||||
| Prepaid expenses and other current assets, net | ||||||||||||||||||||
| Property, plant and equipment, net | ( |
|||||||||||||||||||
| Identifiable intangible assets | ||||||||||||||||||||
| Other assets | ||||||||||||||||||||
| Accounts payable | ( |
( |
||||||||||||||||||
| Other accrued liabilities | ( |
( |
( |
|||||||||||||||||
| Other liabilities | ( |
( |
||||||||||||||||||
| Deferred income taxes | ( |
( |
( |
|||||||||||||||||
| Net assets before goodwill from acquisition | ||||||||||||||||||||
| Goodwill from acquisition | ( |
|||||||||||||||||||
| Net assets acquired | $ | $ | $ | |||||||||||||||||
Goodwill was recognized as the excess of the purchase price over the net identifiable assets recognized. The goodwill is primarily attributed to the assembled workforce and the anticipated future economic benefits and is allocated to our refinish reporting unit. The goodwill recognized at December 31, 2021 is no t deductible for income tax purposes.
We incurred and expensed acquisition-related transaction costs for the U-POL acquisition of $8.8 million, which is included within other operating charges on the consolidated statements of operations for the year ended December 31, 2021.
The fair value associated with definite-lived intangible assets was $274.0 million, comprised of $29.0 million in developed technology, $35.0 million in trademarks and $210.0 million in customer relationships. The definite-lived intangible assets will be amortized over an average term of 17.4 years. The measurement period adjustment impacting identified intangible assets related to a change in the royalty rate assumption used for the valuation of the developed technology intangible asset.
Other Acquisitions
During April 2021, we acquired a producer of wire enamels used in a range of consumer electronics, electric vehicle and industrial applications, based in China. The acquisition was accounted for as a business combination within our industrial end-market and Performance Coatings segment. The overall impacts to our consolidated financial statements were not considered material as of and for the year ended December 31, 2021. As of December 31, 2021, we have not yet finalized the purchase accounting related to the acquisition and the amounts recorded represent preliminary values. We expect to finalize our purchase accounting during the measurement period which will be no later than one year following the acquisition date.
68
(4) GOODWILL AND IDENTIFIABLE INTANGIBLE ASSETS
Goodwill
The following table shows changes in the carrying amount of goodwill from December 31, 2019 to December 31, 2021 by reportable segment:
| Performance Coatings |
Mobility Coatings |
Total | ||||||||||||||||||
| December 31, 2019 | $ | $ | $ | |||||||||||||||||
| Foreign currency translation | ||||||||||||||||||||
| December 31, 2020 | $ | $ | $ | |||||||||||||||||
| Goodwill from acquisitions | ||||||||||||||||||||
| Purchase accounting adjustments | ( |
( |
||||||||||||||||||
| Foreign currency translation | ( |
( |
( |
|||||||||||||||||
| December 31, 2021 | $ | $ | $ | |||||||||||||||||
Identifiable Intangible Assets
The following table summarizes the gross carrying amounts and accumulated amortization of identifiable intangible assets by major class:
| December 31, 2021 | Gross Carrying Amount |
Accumulated Amortization |
Net Book Value |
Weighted average amortization periods (years) |
||||||||||||||||||||||
| Technology | $ | $ | ( |
$ | ||||||||||||||||||||||
| Trademarks—indefinite-lived | — | Indefinite | ||||||||||||||||||||||||
| Trademarks—definite-lived | ( |
|||||||||||||||||||||||||
| Customer relationships | ( |
|||||||||||||||||||||||||
| Other | ( |
|||||||||||||||||||||||||
| Total | $ | $ | ( |
$ | ||||||||||||||||||||||
| December 31, 2020 | Gross Carrying Amount |
Accumulated Amortization |
Net Book Value |
Weighted average amortization periods (years) |
||||||||||||||||||||||
| Technology | $ | $ | ( |
$ | ||||||||||||||||||||||
| Trademarks—indefinite-lived | — | Indefinite | ||||||||||||||||||||||||
| Trademarks—definite-lived | ( |
|||||||||||||||||||||||||
| Customer relationships | ( |
|||||||||||||||||||||||||
| Other | ( |
|||||||||||||||||||||||||
| Total | $ | $ | ( |
$ | ||||||||||||||||||||||
The estimated amortization expense related to the fair value of acquired intangible assets for each of the succeeding five years is:
| 2022 | $ | |||||||
| 2023 | $ | |||||||
| 2024 | $ | |||||||
| 2025 | $ | |||||||
| 2026 | $ | |||||||
(5) RESTRUCTURING
69
During the years ended December 31, 2021, 2020 and 2019, we incurred costs for termination benefits of $38.7 million, $71.9 million, and $34.4 million, respectively. Pretax charges during the year ended December 31, 2021 primarily relate to additional employee severance charges within Europe that were not included in the previously announced global restructuring made in July 2020 as the required works council consultations and other local legal requirements were completed during 2021. The majority of our termination benefits are recorded within other operating charges in the consolidated statements of operations. The remaining payments associated with these actions are expected to be substantially completed within 24 months.
The following table summarizes the activity related to the termination benefit reserves and expenses for the years ended December 31, 2021, 2020 and 2019:
| Balance at January 1, 2019 | $ | |||||||
| Expense recorded | ||||||||
| Payments made | ( |
|||||||
| Foreign currency translation | ( |
|||||||
| Balance at December 31, 2019 | $ | |||||||
| Expense recorded | ||||||||
| Payments made | ( |
|||||||
| Foreign currency translation | ||||||||
| Balance at December 31, 2020 | $ | |||||||
| Expense recorded | ||||||||
| Payments made | ( |
|||||||
| Foreign currency translation | ( |
|||||||
| Balance at December 31, 2021 | $ | |||||||
During September 2021, we completed the sale of our manufacturing facility in Mechelen, Belgium, which stopped operating during 2020 as a result of actions taken to reduce operational costs via a manufacturing footprint rationalization announced in 2018. The sale resulted in a gain of $8.9 million during the year ended December 31, 2021, of which $1.0 million is included in cost of goods sold and $7.9 million is included in other operating charges in the consolidated statements of operations.
During December 2021, we completed the sale of two other sites resulting in proceeds of $16.9 million and net gains of $10.0 million, which is included in other operating charges in the consolidated statements of operations.
During 2021, we received proceeds in exchange for land use rights of $8.5 million, resulting in a gain of $1.8 million, which is included in other operating charges in the consolidated statements of operations.
(6) COMMITMENTS AND CONTINGENCIES
Guarantees
We guarantee certain of our customers' obligations to third parties, whereby any default by our customers on their obligations could force us to make payments to the applicable creditors. At December 31, 2021 and 2020, we had outstanding bank guarantees of $5.7 million and $8.5 million, respectively. A portion of our bank guarantees expire between 2022 and 2036, while others do not have specified expiration dates. We monitor the customer obligations and bank guarantees to evaluate whether we have a liability at the balance sheet date. During the year ended December 31, 2020, we incurred and paid $1.0 million related to our outstanding bank guarantees. We did no
Operational Matter
In January 2021, we became aware of an operational matter affecting certain North America Mobility Coatings customer manufacturing sites. The matter involves the use and application of certain of our products in combination with and incorporated within third-party products. The matter occurred over a discrete period during the fourth quarter of 2020.
When we filed, and as disclosed in our Annual Report on Form 10-K for the year ended December 31, 2020, we estimated that it was reasonably possible that losses associated with the matter could have been up to $250 million. Subsequent to the filing of our Annual Report on Form 10-K and through the filing of our Quarterly Reports on Form 10-Q for the quarters ended March 31, 2021, June 30, 2021, and September 30, 2021, there were further developments which led us to conclude that losses from this matter were probable and that a majority of losses would be covered under our insurance policies, subject to deductible and policy limits as defined in our policies.
70
For the year ended December 31, 2021, we recorded expense of $4.4 million within other operating charges in the consolidated statements of operations. At December 31, 2021, we have $52.7 million recorded for estimated insurance receivables within accounts and notes receivable, net in the consolidated balance sheets. Liabilities of $49.7 million are recorded as other accrued liabilities in the consolidated balance sheets at December 31, 2021. The recorded probable losses remain an estimate, and actual costs arising from this matter could be materially lower or higher depending on the actual costs incurred to repair the impacted products as well as the availability of additional insurance coverage.
Other
We are subject to various pending lawsuits, legal proceedings and other claims in the ordinary course of business, including civil, regulatory and environmental matters. These matters may involve third-party indemnification obligations and/or insurance covering all or part of any potential damage incurred by us. All of these matters are subject to many uncertainties and, accordingly, we cannot determine the ultimate outcome of the proceedings and other claims at this time. The potential effects, if any, on our consolidated financial statements will be recorded in the period in which these matters are probable and estimable. Except as set forth in the "Operational Matter" section above, we believe that any sum we may be required to pay in connection with proceedings or claims in excess of the amounts recorded would likely not have a material adverse effect upon our results of operations, financial conditions or cash flows on a consolidated annual basis but could have a material adverse impact in a particular quarterly reporting period.
We are involved in environmental remediation and ongoing compliance activities at several sites. The timing and duration of remediation and ongoing compliance activities are determined on a site by site basis depending on local regulations. The liabilities recorded represent our estimable future remediation costs and other anticipated environmental liabilities. We have not recorded liabilities at sites where a liability is probable, but that a range of loss is not reasonably estimable. We believe that any sum we may be required to pay in connection with environmental remediation matters in excess of the amounts recorded would likely occur over a period of time and would likely not have a material adverse effect upon our results of operations, financial condition or cash flows on a consolidated annual basis but could have a material adverse impact in a particular quarterly reporting period.
(7) LEASES
In January 1, 2019, we adopted Accounting Standards Update ("ASU") 2016-02, "Leases," which, together with amendments comprising ASC 842, requires lessees to identify arrangements that should be accounted for as leases and generally recognized, for operating and finance leases with terms exceeding twelve months, a right-of-use asset (or "ROU") and lease liability on the balance sheet. In addition to this main provision, this standard included a number of additional changes to lease accounting. This standard is effective for fiscal years beginning after December 15, 2018, including interim periods within those fiscal years. A modified retrospective transition approach is required, applying the new standard to all leases existing at the date of initial application. An entity may choose to use either the adoption date or the beginning of the earliest comparative period presented in the financial statements as its date of initial application. We used the adoption date as our date of initial application. As a result, historical financial information was not updated, and the disclosures required under the new standard are not provided as of and for periods before January 1, 2019. Adoption of at January 1, 2019 resulted in a one-time loss to retained earnings of $0.7 million on our consolidated balance sheet and consolidated statement of changes in shareholders' equity related to the net difference of derecognition of existing assets and debt obligations associated with our leases historically accounted for as sale-leaseback financings, for which the ASU requires accounting for as a lease at the date of initial application.
We have operating and finance leases for certain of our technology centers, warehouses, office spaces, land, and equipment. Right-of-use ("ROU") assets represent the Company's right to use an underlying asset for the lease term and lease liabilities represent the Company's obligation to make lease payments arising from the lease. Operating lease ROU assets and operating lease liabilities are recognized based on the present value of the future minimum lease payments over the lease term at commencement date. The lease term is determined to be the non-cancelable period including any lessee renewal options that are considered to be reasonably certain of exercise. The interest rate implicit in lease contracts is typically not readily determinable. As such, the Company used judgment to determine an appropriate incremental borrowing rate, which is the rate incurred to borrow on a collateralized basis over a similar term in a similar economic environment. Lease expense for fixed lease payments on operating leases is recognized over the expected term on a straight-line basis, while lease expense for fixed lease payments on finance leases is recognized using the effective interest method.
Certain of our lease agreements include rental payments based on an index or adjusted periodically for inflation. The changes to the CPI are treated as variable lease payments and recognized in the period in which the obligation for those payments was incurred. In addition, variable lease expense also includes elements of a contract that is based on usage during the term. Our lease agreements do not contain any material residual value guarantees or material restrictive covenants.
71
Supplemental balance sheet information related to leases is summarized as follows:
| December 31, | |||||||||||||||||
| 2021 | 2020 | ||||||||||||||||
| Assets | Classification | ||||||||||||||||
| Operating lease assets, net | $ | $ | |||||||||||||||
| Finance lease assets, net | |||||||||||||||||
| Total leased assets | $ | $ | |||||||||||||||
| Liabilities | |||||||||||||||||
| Current | |||||||||||||||||
| Operating lease liabilities | $ | $ | |||||||||||||||
| Finance lease liabilities | |||||||||||||||||
| Noncurrent | |||||||||||||||||
| Operating lease liabilities | |||||||||||||||||
| Finance lease liabilities | |||||||||||||||||
| Total lease liabilities | $ | $ | |||||||||||||||
(1) Operating lease assets are recorded net of accumulated amortization of $50.3 million and $35.4 million for the years ended December 31, 2021 and 2020, respectively.
(2) Finance lease assets are recorded net of accumulated amortization of $13.3 million and $8.9 million for the years ended December 31, 2021 and 2020, respectively.
Components of lease expense are summarized as follows:
| Year Ended December 31, | ||||||||||||||||||||
| 2021 | 2020 | 2019 | ||||||||||||||||||
| Finance lease cost | ||||||||||||||||||||
| Amortization of right-of-use assets | $ | $ | $ | |||||||||||||||||
| Interest on lease liabilities | ||||||||||||||||||||
| Operating lease cost | ||||||||||||||||||||
| Variable lease cost | ||||||||||||||||||||
| Short-term lease cost | ||||||||||||||||||||
| Net lease cost | $ | $ | $ | |||||||||||||||||
Supplemental cash flow information related to leases is summarized as follows:
| Year Ended December 31, | ||||||||||||||||||||
| 2021 | 2020 | 2019 | ||||||||||||||||||
| Cash paid for amounts included in the measurement of lease liabilities: | ||||||||||||||||||||
| Operating cash flows for operating leases | $ | $ | $ | |||||||||||||||||
| Operating cash flows for finance leases | $ | $ | $ | |||||||||||||||||
| Financing cash flows for finance leases | $ | $ | $ | |||||||||||||||||
| Right-of-use assets obtained in exchange for lease obligations: | ||||||||||||||||||||
| Operating leases | $ | $ | $ | |||||||||||||||||
| Finance leases | $ | $ | $ | |||||||||||||||||
72
Lease term and discount rate information are summarized as follows:
| Year Ended December 31, | ||||||||||||||
| 2021 | 2020 | |||||||||||||
| Weighted-average remaining lease term (years) | ||||||||||||||
| Operating leases | ||||||||||||||
| Finance leases | ||||||||||||||
| Weighted-average discount rate | ||||||||||||||
| Operating leases | % | % | ||||||||||||
| Finance leases | % | % | ||||||||||||
Maturities of lease liabilities as of December 31, 2021 are as follows:
| Operating Leases | Finance Leases | |||||||||||||
| Year | ||||||||||||||
| 2022 | $ | $ | ||||||||||||
| 2023 | ||||||||||||||
| 2024 | ||||||||||||||
| 2025 | ||||||||||||||
| 2026 | ||||||||||||||
| Thereafter | ||||||||||||||
| Total lease payments | ||||||||||||||
| Less: imputed interest | ||||||||||||||
| Present value of lease liabilities | $ | $ | ||||||||||||
(8) LONG-TERM EMPLOYEE BENEFITS
Defined Benefit Pensions
Axalta has defined benefit plans that cover certain employees worldwide, with over 85 % of the projected benefit obligation within the European region at December 31, 2021.
73
Obligations and Funded Status
The measurement date used to determine defined benefit obligations is December 31st each year. The following table sets forth the changes to the projected benefit obligations ("PBO") and plan assets for the years ended December 31, 2021 and 2020 and the funded status and amounts recognized in the accompanying consolidated balance sheets at December 31, 2021 and 2020 for our defined benefit pension plans:
| Year Ended December 31, | ||||||||||||||
| 2021 | 2020 | |||||||||||||
| Change in benefit obligation: | ||||||||||||||
| Projected benefit obligation at beginning of year | $ | $ | ||||||||||||
| Service cost | ||||||||||||||
| Interest cost | ||||||||||||||
| Participant contributions | ||||||||||||||
| Actuarial (gain) loss, net | ( |
|||||||||||||
| Plan curtailments, settlements and special termination benefits | ( |
( |
||||||||||||
| Benefits paid | ( |
( |
||||||||||||
| Business combinations and other adjustments | ( |
|||||||||||||
| Foreign currency translation | ( |
|||||||||||||
| Projected benefit obligation at end of year | ||||||||||||||
| Change in plan assets: | ||||||||||||||
| Fair value of plan assets at beginning of year | ||||||||||||||
| Actual return on plan assets | ||||||||||||||
| Employer contributions | ||||||||||||||
| Participant contributions | ||||||||||||||
| Benefits paid | ( |
( |
||||||||||||
| Settlements | ( |
( |
||||||||||||
| Business combinations and other adjustments | ( |
|||||||||||||
| Foreign currency translation | ( |
|||||||||||||
| Fair value of plan assets at end of year | ||||||||||||||
| Funded status, net | $ | ( |
$ | ( |
||||||||||
| Amounts recognized in the consolidated balance sheets consist of: | ||||||||||||||
| Other assets | $ | $ | ||||||||||||
| Other accrued liabilities | ( |
( |
||||||||||||
| Accrued pensions | ( |
( |
||||||||||||
| Net amount recognized | $ | ( |
$ | ( |
||||||||||
Net actuarial (gains) losses for 2021 and 2020 were primarily fluctuations in the discount rates between years across the plans relative to the rates used in the preceding year to determine benefit obligations (see assumptions table below), which were caused by market volatility during the periods.
The PBO is the actuarial present value of benefits attributable to employee service rendered to date, including the effects of estimated future pay increases. The accumulated benefit obligation ("ABO") is the actuarial present value of benefits attributable to employee service rendered to date but does not include the effects of estimated future pay increases.
74
The following table reflects the ABO for all defined benefit pension plans at December 31, 2021 and 2020. Further, the table reflects the aggregate PBO, ABO and fair value of plan assets for pension plans with PBO in excess of plan assets and for pension plans with ABO in excess of plan assets.
| Year Ended December 31, | ||||||||||||||
| 2021 | 2020 | |||||||||||||
| ABO | $ | $ | ||||||||||||
| Plans with PBO in excess of plan assets: | ||||||||||||||
| PBO | $ | $ | ||||||||||||
| ABO | $ | $ | ||||||||||||
| Fair value plan assets | $ | $ | ||||||||||||
| Plans with ABO in excess of plan assets: | ||||||||||||||
| PBO | $ | $ | ||||||||||||
| ABO | $ | $ | ||||||||||||
| Fair value plan assets | $ | $ | ||||||||||||
The pre-tax amounts not yet reflected in net periodic benefit cost and included in AOCI include the following related to defined benefit plans:
| Year Ended December 31, | ||||||||||||||
| 2021 | 2020 | |||||||||||||
| Accumulated net actuarial losses | $ | ( |
$ | ( |
||||||||||
| Accumulated prior service credit | ||||||||||||||
| Total | $ | ( |
$ | ( |
||||||||||
The accumulated net actuarial losses for pensions relate primarily to differences between the actual net periodic expense and the expected net periodic expense resulting from differences in the significant assumptions, including return on assets, discount rates and compensation trends, used in these estimates. For individual plans in which the accumulated net actuarial gains or losses exceed 10 % of the higher of the fair value of plan assets or the PBO at the beginning of the year, amortization of such excess has been included in net periodic benefit costs. The amortization period is the average remaining service period of active employees expected to receive benefits unless a plan is mostly inactive, in which case the amortization period is the average remaining life expectancy of the plan participants. Accumulated prior service credits are amortized over the future service periods of those employees who are active at the dates of the plan amendments and who are expected to receive benefits.
75
Components of Net Periodic Benefit Cost
The following table sets forth the pre-tax components of net periodic benefit costs for our defined benefit plans for the years ended December 31, 2021, 2020 and 2019.
| Year Ended December 31, | ||||||||||||||||||||
| 2021 | 2020 | 2019 | ||||||||||||||||||
| Components of net periodic benefit cost and amounts recognized in comprehensive income: | ||||||||||||||||||||
| Net periodic benefit cost: | ||||||||||||||||||||
| Service cost | $ | $ | $ | |||||||||||||||||
| Interest cost | ||||||||||||||||||||
| Expected return on plan assets | ( |
( |
( |
|||||||||||||||||
| Amortization of actuarial loss, net | ||||||||||||||||||||
| Amortization of prior service credit | ( |
( |
||||||||||||||||||
| Curtailment gain | ( |
( |
||||||||||||||||||
| Settlement loss | ||||||||||||||||||||
| Special termination benefit loss | ||||||||||||||||||||
| Net periodic benefit cost | ||||||||||||||||||||
| Changes in plan assets and benefit obligations recognized in other comprehensive income: | ||||||||||||||||||||
| Net actuarial (gain) loss, net | ( |
|||||||||||||||||||
| Amortization of actuarial loss, net | ( |
( |
( |
|||||||||||||||||
| Prior service credit | ( |
|||||||||||||||||||
| Amortization of prior service credit | ||||||||||||||||||||
| Curtailment gain | ||||||||||||||||||||
| Settlement loss | ( |
( |
||||||||||||||||||
| Other adjustments | ( |
( |
||||||||||||||||||
| Total (gain) loss recognized in other comprehensive income | ( |
|||||||||||||||||||
| Total recognized in net periodic benefit cost and comprehensive income | $ | ( |
$ | $ | ||||||||||||||||
76
Assumptions
We used the following assumptions in determining the benefit obligations and net periodic benefit cost of our defined benefit plans:
| 2021 | 2020 | 2019 | ||||||||||||||||||
| Weighted-average assumptions: | ||||||||||||||||||||
| Discount rate to determine benefit obligation | % | % | % | |||||||||||||||||
| Discount rate to determine net cost | % | % | % | |||||||||||||||||
| Rate of future compensation increases to determine benefit obligation | % | % | % | |||||||||||||||||
| Rate of future compensation increases to determine net cost | % | % | % | |||||||||||||||||
| Rate of return on plan assets to determine net cost | % | % | % | |||||||||||||||||
| Cash balance interest credit rate to determine benefit obligation | % | % | % | |||||||||||||||||
| Cash balance interest credit rate to determine net cost | % | % | % | |||||||||||||||||
The discount rates used reflect the expected future cash flow based on plan provisions, participant data and the currencies in which the expected future cash flows will occur. For the majority of our defined benefit pension obligations, we utilize prevailing long-term high quality corporate bond indices applicable to the respective country at the measurement date. In countries where established corporate bond markets do not exist, we utilize other index movement and duration analysis to determine discount rates. The long-term rate of return on plan assets assumptions reflect economic assumptions applicable to each country and assumptions related to the preliminary assessments regarding the type of investments to be held by the respective plans.
Estimated future benefit payments
The following reflects the total benefit payments expected to be paid for defined benefits:
| Year ended December 31, | Benefits | |||||||
| 2022 | $ | |||||||
| 2023 | $ | |||||||
| 2024 | $ | |||||||
| 2025 | $ | |||||||
| 2026 | $ | |||||||
| 2027 - 2031 | $ | |||||||
Plan Assets
The defined benefit pension plans for our subsidiaries represent single-employer plans and the related plan assets are invested within separate trusts. Each of the single-employer plans is managed in accordance with the requirements of local laws and regulations governing defined benefit pension plans for the exclusive purpose of providing pension benefits to participants and their beneficiaries. Pension plan assets are typically held in a trust by financial institutions. Our established asset allocation targets are intended to achieve the plan's investment strategies.
Equity securities include varying market capitalization levels. U.S. equity securities are primarily large-cap companies. Fixed income investments include corporate issued, government issued, and asset backed securities. Corporate debt securities include a range of credit risk and industry diversification. Other investments include real estate and private market securities such as insurance contracts, interests in private equity, and venture capital partnerships. Assets measured using the net asset value ("NAV") per share practical expedient include debt asset backed securities, hedge funds, and real estate funds. Debt asset backed securities primarily consist of collateralized debt obligations. The market values for these assets are based on the NAV multiplied by the number of shares owned.
Fair value calculations may not be indicative of net realizable value or reflective of future fair values. Furthermore, although we believe the valuation methods are appropriate and consistent with other market participants, the use of different methodologies or assumptions to determine the fair value of certain financial instruments could result in a different fair value measurement at the reporting date.
77
The Company's investment strategy in pension plan assets is to generate earnings over an extended time to help fund the cost of benefits while maintaining an adequate level of diversification for a prudent level of risk. The table below summarizes the weighted average actual and target pension plan asset allocations at December 31 st for all funded Axalta defined benefit plans.
| Asset Category | 2021 | 2020 | Target Allocation | |||||||||||||||||
| Equity securities | ||||||||||||||||||||
| Debt securities | ||||||||||||||||||||
| Real estate | ||||||||||||||||||||
| Other | ||||||||||||||||||||
The table below presents the fair values of the defined benefit pension plan assets by level within the fair value hierarchy, as described in Note 1, at December 31, 2021 and 2020, respectively. Defined benefit pension plan assets measured using NAV have not been categorized in the fair value hierarchy.
| Fair value measurements at | ||||||||||||||||||||||||||
| December 31, 2021 | ||||||||||||||||||||||||||
| Total | Level 1 | Level 2 | Level 3 | |||||||||||||||||||||||
| Asset Category: | ||||||||||||||||||||||||||
| Cash and cash equivalents | $ | $ | $ | $ | ||||||||||||||||||||||
| U.S. equity securities | ||||||||||||||||||||||||||
| Non-U.S. equity securities | ||||||||||||||||||||||||||
| Debt securities—government issued | ||||||||||||||||||||||||||
| Debt securities—corporate issued | ||||||||||||||||||||||||||
| Private market securities and other | ||||||||||||||||||||||||||
| Total carried at fair value | $ | $ | $ | $ | ||||||||||||||||||||||
| Investments measured at NAV | ||||||||||||||||||||||||||
| Total | $ | |||||||||||||||||||||||||
| Fair value measurements at | ||||||||||||||||||||||||||
| December 31, 2020 | ||||||||||||||||||||||||||
| Total | Level 1 | Level 2 | Level 3 | |||||||||||||||||||||||
| Asset Category: | ||||||||||||||||||||||||||
| Cash and cash equivalents | $ | $ | $ | $ | ||||||||||||||||||||||
| U.S. equity securities | ||||||||||||||||||||||||||
| Non-U.S. equity securities | ||||||||||||||||||||||||||
| Debt securities—government issued | ||||||||||||||||||||||||||
| Debt securities—corporate issued | ||||||||||||||||||||||||||
| Private market securities and other | ||||||||||||||||||||||||||
| Total carried at fair value | $ | $ | $ | $ | ||||||||||||||||||||||
| Investments measured at NAV | ||||||||||||||||||||||||||
| Total | $ | |||||||||||||||||||||||||
78
Level 3 assets are primarily insurance contracts pledged on behalf of employees with benefits in certain countries, ownership interests in investment partnerships, trusts that own private market securities and other debt and equity investments. The fair values of our insurance contracts are determined based on the cash surrender value or the present value of the expected future benefits to be paid under the contract, discounted at a rate consistent with the related benefit obligation. Debt and equity securities consist primarily of small investments in other investments that are valued at different frequencies based on the value of the underlying investments. The table below presents a roll forward of activity for these assets for the years ended December 31, 2021 and 2020.
| Level 3 assets | ||||||||||||||||||||||||||
| Total | Private market securities |
Debt and equity | Real estate investments |
|||||||||||||||||||||||
| Ending balance at December 31, 2019 | $ | $ | $ | $ | ||||||||||||||||||||||
| Change in unrealized gain | ||||||||||||||||||||||||||
| Purchases, sales, issues and settlements | ( |
( |
( |
( |
||||||||||||||||||||||
| Transfers into Level 3 | ||||||||||||||||||||||||||
| Ending balance at December 31, 2020 | $ | $ | $ | $ | ||||||||||||||||||||||
| Change in unrealized gain | ( |
( |
||||||||||||||||||||||||
| Purchases, sales, issues and settlements | ( |
( |
||||||||||||||||||||||||
| Ending balance at December 31, 2021 | $ | $ | $ | $ | ||||||||||||||||||||||
Assumptions and Sensitivities
The discount rate is determined as of each measurement date, based on a review of yield rates associated with long-term, high-quality corporate bonds. The calculation separately discounts benefit payments using the spot rates from a long-term, high-quality corporate bond yield curve.
The long-term rate of return assumption represents the expected average rate of earnings on the funds invested to provide for the benefits included in the benefit obligations. The long-term rate of return assumption is determined based on a number of factors, including historical market index returns, the anticipated long-term asset allocation of the plans, historical plan return data, plan expenses and the potential to outperform market index returns. For 2022, the expected long-term rate of return is 3.44 %.
Anticipated Contributions to Defined Benefit Plan
For funded pension plans, our funding policy is to fund amounts for pension plans sufficient to meet minimum requirements set forth in applicable benefit laws and local tax laws. Based on the same assumptions used to measure our benefit obligations at December 31, 2021, we expect to contribute $5.8 million to our defined benefit plans during 2022.
Defined Contribution Plans
The Company sponsors defined contribution plans in both its U.S. and non-U.S. subsidiaries, under which salaried and certain hourly employees may defer a portion of their compensation. Eligible participants may contribute to the plan up to the allowable amount as determined by the plan of their regular compensation before taxes. All contributions and Company matches are invested at the direction of the employee. Company matching contributions vest immediately and aggregated to $50.4 million, $42.2 million and $48.7 million for the years ended December 31, 2021, 2020 and 2019, respectively.
(9) STOCK-BASED COMPENSATION
During the years ended December 31, 2021, 2020 and 2019, we recognized $14.9 million, $15.1 million and $15.7 million, respectively, in stock-based compensation expense, which was allocated between costs of goods sold and selling, general and administrative expenses on the consolidated statements of operations. We recognized tax benefits on stock-based compensation of $1.5 million, $2.4 million and $0.3 million for the years ended December 31, 2021, 2020 and 2019, respectively.
Description of Equity Incentive Plan
In 2013, Axalta's Board of Directors approved the Axalta Coating Systems Ltd. 2013 Incentive Award Plan (the "2013 Plan") which reserved shares of common stock of the Company for issuance to employees, directors and consultants. The 2013 Plan provided for the issuance of stock options, restricted stock or other stock-based awards. No further awards may be granted pursuant to the 2013 Plan.
79
In 2014, Axalta's Board of Directors approved the Axalta Coating Systems Ltd. 2014 Incentive Award Plan, as amended and restated (the "2014 Plan"), which reserved additional shares of common stock of the Company for issuance to employees, directors and consultants. The 2014 Plan provides for the issuance of stock options, restricted stock or other stock-based awards. All awards granted pursuant to the 2014 Plan must be authorized by the Board of Directors of Axalta or a designated committee thereof. Our Board of Directors has generally delegated responsibility for administering the 2014 Plan to our Compensation Committee.
The terms of the stock options may vary with each grant and are determined by the Compensation Committee within the guidelines of the 2013 and 2014 Plans. Option life cannot exceed ten years and the Company may settle option exercises by issuing new shares, treasury shares or shares purchased on the open market.
During 2021, we granted restricted stock units and performance share units to certain employees and directors. All awards were granted under the 2014 Plan. The performance share units are subject to certain performance and market conditions, in addition to the service-based vesting conditions. During 2021, the Company withheld shares and used cash to settle certain employees' tax obligation resulting from the vesting of awards in the amount of $1.5 million.
Stock Options
The Black-Scholes option pricing model was used to estimate fair values of the options as of the date of the grant. There were no options granted during 2020 or 2021. The weighted average fair value of options granted in 2019 was $6.98 per share. A majority of these awards vest ratably over three years . Principal weighted average assumptions used in applying the Black-Scholes model were as follows:
| 2019 Grants | ||||||||
| Expected Term | ||||||||
| Volatility | % | |||||||
| Dividend Yield | ||||||||
| Discount Rate | % | |||||||
The expected term assumptions used for the grants mentioned in the above table were determined using the simplified method. We do not anticipate paying cash dividends in the foreseeable future and, therefore, use an expected dividend yield of zero . Volatility for outstanding grants was based upon our industry peer group since we have a limited history as a public company. The discount rate was derived from the U.S. Treasury yield curve.
A summary of stock option award activity as of and for the year ended December 31, 2021 is presented below:
| Stock Options | Awards (in millions) |
Weighted- Average Exercise Price |
Aggregate Intrinsic Value (in millions) |
Weighted Average Remaining Contractual Life (years) |
||||||||||||||||||||||
| Outstanding at January 1, 2021 | $ | |||||||||||||||||||||||||
| Granted | $ | |||||||||||||||||||||||||
| Exercised | ( |
$ | ||||||||||||||||||||||||
| Forfeited | ( |
$ | ||||||||||||||||||||||||
| Outstanding at December 31, 2021 | $ | |||||||||||||||||||||||||
| Vested and expected to vest at December 31, 2021 | $ | $ | ||||||||||||||||||||||||
| Exercisable at December 31, 2021 | $ | $ | ||||||||||||||||||||||||
Cash received by the Company upon exercise of options in 2021 was $15.9 million. Tax shortfall expenses on these exercises were $0.4 million. For the years ended December 31, 2021, 2020 and 2019, the intrinsic value of options exercised was $2.5 million, $4.3 million and $56.6 million, respectively.
The fair value of options vested during 2021, 2020 and 2019 was $1.9 million, $3.2 million and $5.4 million, respectively.
At December 31, 2021, there was $0.1 million of unrecognized expense relating to unvested stock options that is expected to be amortized over the weighted average period of 0.3 years.
80
Restricted Stock Awards and Restricted Stock Units
During the year ended December 31, 2021, we issued 0.7 million restricted stock units. A majority of these awards vest ratably over three years .
A summary of restricted stock and restricted stock unit award activity as of and for the year ended December 31, 2021 is presented below:
Restricted Stock Awards and Restricted Stock Units (1)
|
Awards/Units (in millions) |
Weighted-Average Fair Value |
||||||||||||
| Outstanding at January 1, 2021 | $ | |||||||||||||
| Granted | $ | |||||||||||||
| Vested | ( |
$ | ||||||||||||
| Forfeited | ( |
$ | ||||||||||||
| Outstanding at December 31, 2021 | $ | |||||||||||||
(1) As of December 31, 2021, there are no restricted stock awards outstanding and only restricted stock units remain.
At December 31, 2021, there was $12.9 million of unamortized expense relating to unvested restricted stock units that is expected to be amortized over a weighted average period of 1.6 years.
The intrinsic value of awards vested during 2021, 2020 and 2019 was $13.5 million, $14.7 million and $19.7 million, respectively. The total fair value of awards vested during 2021, 2020 and 2019 was $13.6 million, $15.8 million and $20.9 million, respectively. No excess tax benefits or shortfall expenses were recorded related to these exercises.
Performance Stock Awards and Performance Share Units
During the years ended December 31, 2021, 2020 and 2019, the Company granted performance share units ("PSUs") to certain employees of the Company as part of their annual equity compensation award. During the years prior to December 31, 2019, the Company granted performance share awards and performance share units (collectively referred to as "PSAs").
PSUs granted in 2019, 2020 and 2021 are subject to the same service conditions, but also include performance conditions related to internal profitability and return on invested capital metrics over a cumulative performance period of three years , as well as three individual one-year performance periods. At the end of the three-year performance period, the number of PSUs earned based on performance relative to the profitability and invested capital metrics are subject to a market condition in the form of a positive or negative total shareholder return modifier relative to the S&P 500 for 2019 grants and the S&P 400 Materials Index for 2020 and 2021 grants, over the same three-year performance period. The actual number of shares awarded will be between zero and 200 % of the target award amount.
A summary of PSA and PSU activity as of and for the year ended December 31, 2021 is presented below:
Performance Stock Awards and Performance Share Units (1)
|
Awards (in millions) |
Weighted-Average Fair Value |
||||||||||||
| Outstanding at January 1, 2021 | $ | |||||||||||||
| Granted | $ | |||||||||||||
| Vested | $ | |||||||||||||
| Forfeited | ( |
$ | ||||||||||||
| Outstanding at December 31, 2021 | $ | |||||||||||||
(1) As of December 31, 2021, there are no performance stock awards outstanding and only performance share units remain.
Our performance stock awards and performance share units allow for participants to vest in more or less than the targeted number of shares granted. All of our performance awards are currently performing below the applicable targets. We currently expect a total of 0.2 million shares with a weighted average fair value per share of $29.61 to vest at the respective vesting dates for such awards. At December 31, 2021, there was $4.1 million of unamortized expense relating to unvested performance share units that is expected to be amortized over a weighted average period of 2.1 years. The forfeitures include performance share units that vested below threshold payout.
81
(10) OTHER (INCOME) EXPENSE, NET
| Year Ended December 31, | ||||||||||||||||||||
| 2021 | 2020 | 2019 | ||||||||||||||||||
| Foreign exchange losses, net | $ | $ | $ | |||||||||||||||||
Debt extinguishment and refinancing related costs (1)
|
||||||||||||||||||||
Other miscellaneous income, net (2)
|
( |
( |
( |
|||||||||||||||||
| Total | $ | ( |
$ | $ | ( |
|||||||||||||||
(1) Debt extinguishment and refinancing related costs include third-party fees incurred, redemption premiums and the loss on extinguishment associated with the write-off of unamortized deferred financing costs and original issue discounts in conjunction with the restructuring and refinancing of our long-term borrowings, as discussed further in Note 18.
(2) Activity during the year ended December 31, 2021 includes income of $8.3 million related to a law change with respect to certain Brazilian indirect taxes.
(11) INCOME TAXES
On January 1, 2020, we completed an intra-entity transfer of certain intellectual property rights (the "IP") to our Swiss subsidiary, where our EMEA regional headquarters is located. The transfer of the IP did not result in a taxable gain; however, it did result in step-up of the Swiss tax-deductible basis in the transferred assets, and accordingly, created a temporary difference between the book basis and the tax basis of the IP, which was transferred at fair value. We applied significant judgment when determining the fair value of the IP, which serves as the tax basis of the deferred tax asset. Consequently, this transaction resulted in the recognition of a deferred tax asset at the applicable Swiss tax rate, resulting in a one-time tax benefit of $50.5 million. The Company expects to be able to realize the deferred tax assets resulting from these intra-entity asset transfers.
The Company's operations in Switzerland are subject to reduced tax rates through December 31, 2026, as long as certain conditions are met. The tax benefit and the tax effect on diluted net income per common share attributable to this tax holiday was $2.1 million and $0.01 , respectively, for the year ended December 31, 2021. Due to a pre-tax loss and the step-up of tax-deductible IP noted above in our Swiss subsidiary, the reduced tax rate holiday in Switzerland had an unfavorable impact in 2020 and 2019. The tax expense attributable to this tax holiday was $13.2 million and $0.7 million for the years ended December 31, 2020 and 2019, respectively. The tax effect of the tax holiday on diluted net income per common share was $0.06 and $0.01 for the years ended December 31, 2020 and 2019, respectively.
Domestic and Foreign Components of Income Before Income Taxes
| Year Ended December 31, | ||||||||||||||||||||
| 2021 | 2020 | 2019 | ||||||||||||||||||
| Domestic | $ | $ | $ | |||||||||||||||||
| Foreign | ||||||||||||||||||||
| Total | $ | $ | $ | |||||||||||||||||
Provision (Benefit) for Income Taxes
| Year Ended December 31, 2021 | Year Ended December 31, 2020 | Year Ended December 31, 2019 | ||||||||||||||||||||||||||||||||||||||||||||||||||||||
| Current | Deferred | Total | Current | Deferred | Total | Current | Deferred | Total | ||||||||||||||||||||||||||||||||||||||||||||||||
| U.S. federal | $ | $ | $ | $ | $ | $ | $ | $ | $ | |||||||||||||||||||||||||||||||||||||||||||||||
| U.S. state and local | ( |
( |
( |
|||||||||||||||||||||||||||||||||||||||||||||||||||||
| Foreign | ( |
( |
( |
( |
||||||||||||||||||||||||||||||||||||||||||||||||||||
| Total | $ | $ | $ | $ | $ | ( |
$ | $ | $ | $ | ||||||||||||||||||||||||||||||||||||||||||||||
82
Reconciliation to U.S. Statutory Rate
| Year Ended December 31, | ||||||||||||||||||||||||||||||||||||||
| 2021 | 2020 | 2019 | ||||||||||||||||||||||||||||||||||||
Statutory U.S. federal income tax rate (1)
|
$ | % | $ | % | $ | % | ||||||||||||||||||||||||||||||||
| Foreign income taxed at rates other than U.S. statutory rate | ( |
( |
( |
( |
( |
( |
||||||||||||||||||||||||||||||||
| Changes in valuation allowances | ||||||||||||||||||||||||||||||||||||||
| Foreign exchange gain (loss), net | ( |
( |
||||||||||||||||||||||||||||||||||||
Unrecognized tax benefits (2)
|
( |
( |
||||||||||||||||||||||||||||||||||||
| Foreign taxes | ||||||||||||||||||||||||||||||||||||||
| Non-deductible expenses | ||||||||||||||||||||||||||||||||||||||
| Tax credits | ( |
( |
( |
( |
( |
( |
||||||||||||||||||||||||||||||||
Excess tax (benefits)/shortfalls relating to stock-based compensation |
( |
( |
( |
( |
||||||||||||||||||||||||||||||||||
| Base erosion and anti-tax abuse tax | ||||||||||||||||||||||||||||||||||||||
| U.S. state and local taxes, net | ||||||||||||||||||||||||||||||||||||||
Intra-entity IP transfer step-up (3)
|
( |
( |
||||||||||||||||||||||||||||||||||||
Other - net (4)
|
( |
( |
( |
( |
( |
( |
||||||||||||||||||||||||||||||||
| Total income tax provision / effective tax rate | $ | % | $ | % | $ | % | ||||||||||||||||||||||||||||||||
(1)The U.S. statutory rate has been used as management believes it is more meaningful to the Company.
(2)In 2020, we recorded charges of $14.3 million in connection with the income tax audit in Germany and $27.3 million in the Netherlands related to realized exchange gain. The Netherlands item is fully offset by a tax benefit of $27.3 million recorded in 2020 to adjust to the prior year tax filing position.
(3)Related to the step-up of tax deductible basis upon transfer of certain intellectual property rights to our Swiss subsidiary.
(4)In 2021, the Company recorded a tax benefit of $2.9 million in the Netherlands, which is fully offset by a tax expense of $2.9 million for an increase to the valuation allowance. In 2020, the Company recorded a tax benefit of $41.8 million in the Netherlands, of which $27.3 million is related to realized exchange gain and $14.5 million related to rate change on deferred taxes, which are both fully offset by a tax expense of $27.3 million for the increase to unrecognized tax benefits and $14.5 million for an increase to the valuation allowance, respectively. In 2019, the Company recorded a tax benefit of $24.9 million in Luxembourg related to a local statutory impairment, which is fully offset by a tax expense of $24.9 million for the increase to the valuation allowance.
83
Deferred Tax Balances
| Year Ended December 31, | ||||||||||||||
| 2021 | 2020 | |||||||||||||
| Deferred tax asset | ||||||||||||||
Tax loss, credit and interest carryforwards |
$ | $ | ||||||||||||
Goodwill and intangibles |
||||||||||||||
Compensation and employee benefits |
||||||||||||||
Accruals and other reserves |
||||||||||||||
Research and development capitalization |
||||||||||||||
Equity investment and other securities |
||||||||||||||
| Leases | ||||||||||||||
Other |
||||||||||||||
| Total deferred tax assets | ||||||||||||||
| Less: valuation allowance | ( |
( |
||||||||||||
| Total deferred tax assets, net of valuation allowance | ||||||||||||||
| Deferred tax liabilities | ||||||||||||||
Goodwill and intangibles |
( |
|||||||||||||
Property, plant and equipment |
( |
( |
||||||||||||
Unremitted earnings |
( |
( |
||||||||||||
| Accounts Receivable & Other Assets | ( |
|||||||||||||
| Total deferred tax liabilities | ( |
( |
||||||||||||
| Net deferred tax asset | $ | $ | ||||||||||||
| Non-current assets | $ | $ | ||||||||||||
| Non-current liability | ( |
( |
||||||||||||
| Net deferred tax asset | $ | $ | ||||||||||||
The December 31, 2020 balances for Leases and Property, plant and equipment in the table above were each increased by $22.5
| Tax loss, tax credit and interest carryforwards | Year Ended December 31, | |||||||||||||
| 2021 | 2020 | |||||||||||||
Tax loss carryforwards (tax effected) (1)
|
||||||||||||||
Expire within 10 years |
$ | $ | ||||||||||||
Expire after 10 years or indefinite carryforward |
||||||||||||||
| Tax credit carryforwards | ||||||||||||||
Expire within 10 years |
||||||||||||||
Expire after 10 years or indefinite carryforward |
||||||||||||||
| Interest carryforwards | ||||||||||||||
Expire within 10 years |
||||||||||||||
Expire after 10 years or indefinite carryforward |
||||||||||||||
| Total tax loss, tax credit and interest carryforwards | $ | $ | ||||||||||||
(1)Net of unrecognized tax benefits
Utilization of our tax loss, tax credit and interest carryforwards may be subject to annual limitations due to the ownership change limitations provided by the Internal Revenue Code and similar state and foreign provisions. Such annual limitations could result in the expiration of the tax loss, tax credit and interest carryforwards before their utilization.
84
Valuation allowance
| Year Ended December 31, | ||||||||||||||
| 2021 | 2020 | |||||||||||||
| Non-U.S. | $ | $ | ||||||||||||
U.S.
|
||||||||||||||
| Total valuation allowance | $ | $ | ||||||||||||
Valuation allowances relate primarily to the tax loss and tax credit carryforwards, as well as equity investment in foreign jurisdictions, where the Company does not believe the associated net deferred tax assets will be realized, due to expiration, limitation or insufficient future taxable income. The non-U.S. valuation allowance primarily relates to tax loss carryforwards from operations in Luxembourg and Netherlands, of $173.6 million and $176.2 million at December 31, 2021 and 2020, respectively. The U.S. valuation allowance relates to state net deferred tax assets.
Total Gross Unrecognized Tax Benefits
| Year Ended December 31, | ||||||||||||||||||||
| 2021 | 2020 | 2019 | ||||||||||||||||||
| Total gross unrecognized tax benefits at January 1 | $ | $ | $ | |||||||||||||||||
| Increases related to acquisitions | ||||||||||||||||||||
Increases related to positions taken on items from prior years |
||||||||||||||||||||
Decreases related to positions taken on items from prior years |
( |
( |
||||||||||||||||||
| Increases related to positions taken in the current year | ||||||||||||||||||||
| Settlement of uncertain tax positions with tax authorities | ( |
|||||||||||||||||||
| Decrease due to expiration of statues of limitations | ( |
( |
||||||||||||||||||
| Total gross unrecognized tax benefits at December 31 | ||||||||||||||||||||
Total accrual for interest and penalties associated with unrecognized tax benefits (1)
|
||||||||||||||||||||
| Total gross unrecognized tax benefits at December 31, including interest and penalties | $ | $ | $ | |||||||||||||||||
| Total unrecognized tax benefits that, if recognized, would impact the effective tax rate | $ | $ | $ | |||||||||||||||||
| Interest and penalties included as components of the Provision for income taxes | $ | ( |
$ | $ | ||||||||||||||||
(1)Accrued interest and penalties are included within the related tax liability line in the balance sheet.
The Company is subject to income tax in approximately 46 jurisdictions outside the U.S. The Company's significant operations outside the U.S. are located in Brazil, China, Germany, Mexico and Switzerland. The statute of limitations varies by jurisdiction with 2011 being the oldest tax year still open in the material jurisdictions. Certain of our German subsidiaries are under tax examination for calendar years 2014 to 2017. The Company is also under audit in other jurisdictions outside of Germany. The result of all open examinations may lead to ordinary course adjustments or proposed adjustments to our taxes or our net operating losses with respect to years under examination as well as subsequent periods that could be material.
In connection with the income tax audit in Germany for the tax period 2010-2013, the Germany Tax Authority ("GTA") indicated that it believed that certain positions taken on the 2010-2013 corporate income tax returns were not in compliance with German tax law. While the Company disagreed with the conclusions of the GTA based on the technical merits of our positions, after extensive discussions with the GTA and to avoid a potentially long and costly litigation process, in March 2020 the Company expressed a willingness to settle with the GTA on certain matters. As a result of these changes, the Company recorded a charge to income tax expense of $14.3 million in 2020. A final agreement with the GTA was signed in 2021 and the Company is awaiting final assessments. The Company is also currently under audit in Germany for tax years 2014-2017 and is prepared to vigorously defend itself on these matters.
The Company anticipates that it is reasonably possible it will settle up to $12.8 million, exclusive of interest and penalties, of its current unrecognized tax benefits within 2022 mainly due to the conclusion of the 2010-2013 German income tax audit.
85
(12) NET INCOME PER COMMON SHARE
Basic net income per common share excludes the dilutive impact of potentially dilutive securities and is computed by dividing net income by the weighted average number of common shares outstanding for the period. Diluted net income per common share includes the effect of potential dilution from the hypothetical exercise of outstanding stock options and vesting of restricted stock awards, restricted stock units, performance stock awards and performance share units. A reconciliation of our basic and diluted net income per common share is as follows:
| Year Ended December 31, | ||||||||||||||||||||
| (In millions, except per share data) | 2021 | 2020 | 2019 | |||||||||||||||||
| Net income to common shareholders | $ | $ | $ | |||||||||||||||||
| Basic weighted average shares outstanding | ||||||||||||||||||||
| Diluted weighted average shares outstanding | ||||||||||||||||||||
| Net income per common share: | ||||||||||||||||||||
| Basic net income per share | $ | $ | $ | |||||||||||||||||
| Diluted net income per share | $ | $ | $ | |||||||||||||||||
(13) ACCOUNTS AND NOTES RECEIVABLE, NET
Trade accounts receivable are stated at the amount we expect to collect. We maintain allowances for doubtful accounts for estimated losses by applying historical loss percentages, combined with reasonable and supportable forecasts of future losses, to respective aging categories. Management considers the following factors in developing its current estimate of expected credit losses: customer credit-worthiness, past transaction history with the customer, current economic industry trends, changes in market or regulatory matters, and changes in customer payment terms, including the impacts from COVID-19.
| Year Ended December 31, | ||||||||||||||
| 2021 | 2020 | |||||||||||||
Accounts receivable—trade, net (1)
|
$ | $ | ||||||||||||
| Notes receivable | ||||||||||||||
Other (2)
|
||||||||||||||
| Total | $ | $ | ||||||||||||
(1)Allowance for doubtful accounts was $22.0 million and $26.5 million at December 31, 2021 and 2020, respectively.
(2)Includes $52.7 million at December 31, 2021 of insurance recoveries related to an operational matter discussed further in
Note 6.
Note 6.
Bad debt expense of $1.7 million, $11.7 million and $5.5 million was included within selling, general and administrative expenses for the years ended December 31, 2021, 2020 and 2019, respectively.
(14) INVENTORIES
| Year Ended December 31, | ||||||||||||||
| 2021 | 2020 | |||||||||||||
| Finished products | $ | $ | ||||||||||||
| Semi-finished products | ||||||||||||||
| Raw materials | ||||||||||||||
| Stores and supplies | ||||||||||||||
| Total | $ | $ | ||||||||||||
Inventory reserves were $15.6 million and $17.0 million at December 31, 2021 and 2020, respectively.
86
(15) PROPERTY, PLANT AND EQUIPMENT, NET
| Year Ended December 31, | ||||||||||||||||||||||||||
| Useful Lives (years) | 2021 | 2020 | ||||||||||||||||||||||||
| Land | $ | $ | ||||||||||||||||||||||||
| Buildings and improvements | - | |||||||||||||||||||||||||
| Machinery and equipment | - | |||||||||||||||||||||||||
| Software | - | |||||||||||||||||||||||||
| Other | - | |||||||||||||||||||||||||
| Construction in progress | ||||||||||||||||||||||||||
| Total | ||||||||||||||||||||||||||
| Accumulated depreciation | ( |
( |
||||||||||||||||||||||||
| Property, plant and equipment, net | $ | $ | ||||||||||||||||||||||||
Depreciation expense amounted to $127.7 million, $137.2 million and $169.9 million for the years ended December 31, 2021, 2020 and 2019, respectively.
We capitalized interest of $2.2 million, $2.0 million and $2.0 million for the years ended December 31, 2021, 2020 and 2019, respectively.
During May 2021, approximately $55.0 million of capitalized project costs related to an enterprise resource planning system, previously classified as construction in progress, were placed in service and depreciation was initiated. The majority of the costs will be depreciated over a 15-year useful life and is classified as software in the table above.
(16) OTHER ASSETS
| Year Ended December 31, | ||||||||||||||
| 2021 | 2020 | |||||||||||||
| Deferred income taxes—non-current | $ | $ | ||||||||||||
| Business incentive payment assets | ||||||||||||||
| Operating lease ROU assets | ||||||||||||||
Other assets (1)
|
||||||||||||||
| Total | $ | $ | ||||||||||||
87
(17) ACCOUNTS PAYABLE AND OTHER ACCRUED LIABILITIES
| Year Ended December 31, | ||||||||||||||
| 2021 | 2020 | |||||||||||||
| Accounts Payable | ||||||||||||||
Trade payables (1)
|
$ | $ | ||||||||||||
| Non-income taxes | ||||||||||||||
| Other | ||||||||||||||
| Total | $ | $ | ||||||||||||
| Other Accrued Liabilities | ||||||||||||||
| Compensation and other employee-related costs | $ | $ | ||||||||||||
| Restructuring—current | ||||||||||||||
Discounts, rebates, and warranties (2)
|
||||||||||||||
| Operating lease liabilities | ||||||||||||||
| Income taxes payable | ||||||||||||||
| Other | ||||||||||||||
| Total | $ | $ | ||||||||||||
(1)Includes $33.0 million and $29.9 million at December 31, 2021 and 2020, respectively, payable to banking institutions as part of our supplier financing programs.
(2)Includes $49.7 million at December 31, 2021 of liabilities related to an operational matter discussed further in
Note 6.
Note 6.
(18) BORROWINGS
| Year Ended December 31, | ||||||||||||||
| 2021 | 2020 | |||||||||||||
| 2024 Dollar Term Loans | $ | $ | ||||||||||||
| 2025 Euro Senior Notes | ||||||||||||||
| 2027 Dollar Senior Notes | ||||||||||||||
| 2029 Dollar Senior Notes | ||||||||||||||
| Short-term and other borrowings | ||||||||||||||
| Unamortized original issue discount | ( |
( |
||||||||||||
| Unamortized deferred financing costs | ( |
( |
||||||||||||
| Total borrowings, net | ||||||||||||||
| Less: | ||||||||||||||
| Short-term borrowings | ||||||||||||||
| Current portion of long-term borrowings | ||||||||||||||
| Long-term debt | $ | $ | ||||||||||||
Senior Secured Credit Facilities, as amended
The Senior Secured Credit Facilities consist of the 2024 Term Loan and a revolving credit facility (the "Revolving Credit Facility") that is governed by a credit agreement (the "Credit Agreement"). The Credit Agreement has undergone several amendments, the most recent of which are detailed within the discussion below. For additional detail regarding earlier amendments, refer to the previous Annual Reports on Form 10-K filed under the SEC.
Any indebtedness under the Senior Secured Credit Facilities may be voluntarily prepaid in whole or in part, in minimum amounts, subject to the provisions set forth in the Credit Agreement. Such indebtedness is subject to mandatory prepayments amounting to the proceeds of asset sales over $75.0 million annually, proceeds from certain debt issuances not otherwise permitted under the Credit Agreement and 50 % (subject to a step-down to 25.0 % or 0 % if the First Lien Leverage Ratio falls below 4.25 :1.00 or 3.50 :1.00, respectively) of Excess Cash Flow (as defined within the Credit Agreement).
88
The Senior Secured Credit Facilities are secured by substantially all assets of the Company and the other guarantors. We are subject to customary negative covenants in addition to the First Lien Leverage Ratio financial covenant for purposes of determining any Excess Cash Flow mandatory payment. Further, the Senior Secured Credit Facilities, among other things, include customary restrictions (subject to certain exceptions) on the Company's ability to incur certain indebtedness, grant certain liens, make certain investments, declare or pay certain dividends, or repurchase shares of the Company's common stock. As of December 31, 2021, the Company is in compliance with all covenants under the Senior Secured Credit Facilities.
i) 2024 Dollar Term Loans
The 2024 Dollar Term Loans were issued at 99.875 % of par, or a $2.5 million discount, and mature on June 1, 2024. Principal is paid quarterly based on 1 % per annum of the original principal amount outstanding on the most recent amendment date with the unpaid balance due at maturity, and interest is payable quarterly.
The 2024 Dollar Term Loans are subject to a floor of zero plus an applicable rate of 1.75 % per annum for Eurocurrency Rate Loans as defined in the Credit Agreement and 0.75 % per annum for Base Rate Loans as defined in the Credit Agreement. The 2024 Dollar Term Loans bear interest at variable rates, including LIBOR, which is the subject of recent reform and will cease being published in June 2023. We intend to amend or refinance the 2024 Dollar Term Loans ahead of June 2023, and expect LIBOR language to be replaced by the Federal Reserve's Secured Overnight Financing Rate ("SOFR") along with a subsequent credit spread adjustment which will be defined with the amended or refinanced terms. If we are unable to refinance the 2024 Dollar Term Loans ahead of June 2023, the balance will be subject to the Base Rate Loans interest.
ii) Revolving Credit Facility
The Revolving Credit Facility matures on the earlier of March 2, 2024, the date of termination in whole of the Revolving Credit Facility, or the date that is 91 days prior to the maturity of the Term Loans borrowed under the Credit Agreement. Under circumstances described in the Credit Agreement, we may increase available revolving or term facility borrowings by up to $700.0 million plus an additional amount subject to the Company not exceeding a maximum first lien leverage ratio described in the Credit Agreement. The financial covenant applicable to the Revolving Credit Facility is only applicable when greater than 30 % of the Revolving Credit Facility (including letters of credit not cash collateralized to at least 103 %) is outstanding at the end of the fiscal quarter. If such conditions are met, the First Lien Net Leverage Ratio (as defined by the Credit Agreement) at the end of the quarter is required to be greater than 5.50 :1.00.
Interest on any outstanding borrowings under the Revolving Credit Facility is subject to an interest margin of 1.50 % for loans based on the Adjusted Eurocurrency Rate and 0.50 % for loans based on the Base Rate with, in each case, a 0.25 % increase when its First Lien Net Leverage Ratio is greater than or equal to 1.25 :1.00 but less than or equal to 2.25 :1.00 and another 0.25 % increase when its First Lien Net Leverage Ratio is greater than 2.25 :1.00.
There have been no borrowings on the Revolving Credit Facility since the issuance of the Senior Secured Credit Facilities. At December 31, 2021 and December 31, 2020, letters of credit issued under the Revolving Credit Facility totaled $22.1 million and $34.0 million, respectively, which reduced the availability under the Revolving Credit Facility. Availability under the Revolving Credit Facility was $527.9 million and $366.0 million at December 31, 2021 and December 31, 2020, respectively. At December 31, 2021, the financial covenant is not applicable as there were no borrowings.
2021 Activities
During May 2021, we entered into the Tenth Amendment to the Credit Agreement (the "Tenth Amendment") to, among other things, increase commitments available pursuant to the Revolving Credit Facility from $400.0 million to $550.0 million and extend the maturity of the Revolving Credit Facility from 2024 to 2026, provided that such date will be accelerated in certain circumstances as set forth in the Tenth Amendment. As a result, we recorded $1.4 million of incremental deferred financing costs.
2020 Activities
During November 2020, the Company entered into the Ninth Amendment to the Credit Facility Agreement (the "Ninth Amendment"). The Ninth Amendment amended the Credit Agreement to, among other things, permit any entity that is a successor by merger, conversion, legal continuation, continuation to a foreign jurisdiction or otherwise to the Parent Borrower (as defined in the Credit Agreement), to assume the obligations of Parent Borrower under the Credit Agreement and certain related agreements under the Senior Secured Credit Facilities, subject to the terms and conditions of the Ninth Amendment as well as the Credit Agreement. In connection with the Ninth Amendment we incurred $1.5 million in fees, of which $1.1 million was capitalized as deferred financing costs and $0.4 million was expensed.
During January 2020, we voluntarily prepaid $300.0 million of the outstanding principal on the 2024 Dollar Term Loans. As a result of the prepayment, we recorded a loss on extinguishment of debt of $2.7 million consisting of the write off of unamortized deferred financing costs and original issue discounts of $1.5 million and $1.2 million, respectively.
89
2019 Activities
During June 2019, Dutch B B.V. and Axalta US Holdings executed the eighth amendment to the Credit Agreement (the "Eighth Amendment") which impacted the Revolving Credit Facility by (i) extending the maturity date to the earlier of March 2, 2024, the date of termination in whole of the Revolving Credit Facility, or the date that is 91 days prior to the maturity of the term loans borrowed under the Credit Agreement, and (ii) reducing the applicable interest margins on any outstanding borrowings. In connection with the Eighth Amendment, we recorded $1.8 million of incremental deferred financing costs directly associated with the modification of the Revolving Credit Facility.
Senior Notes, as amended
The Senior Notes presently consist of the 2025 Euro Senior Notes, 2027 Dollar Senior Notes and 2029 Dollar Senior Notes each of which are governed by indentures (collectively, the "Indentures"). Since inception, we have held various senior notes that have been subject to several supplemental Indentures, the most recent of which are detailed within the discussion below. For additional detail regarding earlier activities and terms, refer to the previous Annual Reports on the Form 10-K filed under the SEC.
i) 2025 Euro Senior Notes
The 2025 Euro Senior Notes were issued at par and are due January 15, 2025. The 2025 Euro Senior Notes bear interest at 3.750 % which is payable semi-annually on January 15th and July 15th. We have the option to redeem all or part of the 2025 Euro Senior Notes at the following redemption prices (expressed as percentages of principal amount) on or after January 15 th of the years indicated:
| Period | 2025 Euro Senior Notes Percentage | |||||||
| 2021 | % | |||||||
| 2022 | % | |||||||
| 2023 and thereafter | % | |||||||
Upon the occurrence of certain events constituting a change of control, holders of the 2025 Euro Senior Notes have the right to require us to repurchase all or any part of the 2025 Euro Senior Notes at a purchase price equal to 101 % of the principal amount plus accrued and unpaid interest, if any, to the repurchase date.
The 2025 Euro Senior Notes, subject to local law limitations, are jointly and severally guaranteed on a senior unsecured basis by the Company and each of its existing and future direct and indirect subsidiaries that is a borrower under or that guarantees the Senior Secured Credit Facilities, other than Axalta Coating Systems Dutch Holdings B.B.V. (the "Dutch Issuer"). Under certain circumstances, the guarantors may be released from their guarantees without the consent of the holders of the applicable series of notes.
The indebtedness issued through the 2025 Euro Senior Notes is senior unsecured indebtedness of the Dutch Issuer, is senior in right of payment to all future subordinated indebtedness of the Dutch Issuer and guarantors and is equal in right of payment to all existing and future senior indebtedness of the Dutch Issuer and guarantors. The 2025 Euro Senior Notes are effectively subordinated to any secured indebtedness of the Dutch Issuer and guarantors (including indebtedness outstanding under the Senior Secured Credit Facilities) to the extent of the value of the assets securing such indebtedness.
90
ii) 2027 Dollar Senior Notes
The 2027 Dollar Senior Notes were issued at par and are due June 15, 2027. We deferred debt issuance costs of $8.3 million, which are recorded as reductions to long-term borrowings in the consolidated balance sheets and amortized over the life of the issuance. The 2027 Dollar Senior Notes bear interest at 4.750 % which is payable semi-annually on June 15th and December 15th. We have the option to redeem all or part of the 2027 Dollar Senior Notes at the following redemption prices (expressed as percentages of principal amount), plus accrued and unpaid interest, if any, on or after June 15 th of the years indicated:
| Period | 2027 Dollar Senior Notes Percentage | |||||||
| 2023 | % | |||||||
| 2024 | % | |||||||
| 2025 and thereafter | % | |||||||
Notwithstanding the foregoing, at any time and from time to time prior to June 15, 2023, we may at our option redeem in the aggregate up to 40 % of the original aggregate principal amount of the 2027 Dollar Senior Notes with the net cash proceeds of one or more Equity Offerings (as defined in the indenture governing the 2027 Dollar Senior Notes) at a redemption price of 104.75 % plus accrued and unpaid interest, if any, to the redemption date. At least 50 % of the original aggregate principal of the notes must remain outstanding after each such redemption.
Upon the occurrence of certain events constituting a change of control, holders of the 2027 Dollar Senior Notes have the right to require us to repurchase all or any part of the 2027 Dollar Senior Notes at a purchase price equal to 101 % of the principal amount plus accrued and unpaid interest, if any, to the repurchase date.
The indebtedness through the 2027 Dollar Senior Notes is senior unsecured indebtedness of the Axalta Coatings Systems, LLC (the "U.S. Issuer"), is senior in right of payment to all future subordinated indebtedness of the U.S. Issuer and guarantors and is equal in right of payment to all existing and future senior indebtedness of the U.S. Issuer and guarantors. The 2027 Dollar Senior Notes are effectively subordinated to any secured indebtedness of the U.S. Issuer and guarantors (including indebtedness outstanding under the Senior Secured Credit Facilities) to the extent of the value of the assets securing such indebtedness.
The 2027 Dollar Senior Notes are fully and unconditionally guaranteed by the Company and each of the Company's existing restricted subsidiaries, subject to certain exceptions.
The indenture governing the 2027 Dollar Senior Notes contains covenants that limit the Company's (and its subsidiaries') ability to, among other things: (i) incur additional debt or issue certain preferred stock; (ii) pay dividends, redeem stock or make other distributions; (iii) make other restricted payments or investments; (iv) create liens on assets; (v) transfer or sell assets; (vi) create restrictions on payment of dividends or other amounts by the Company to the Company's restricted subsidiaries; (vii) engage in mergers or consolidations; (viii) engage in certain transactions with affiliates; and (ix) designate the Company's subsidiaries as unrestricted subsidiaries.
iii) 2029 Dollar Senior Notes
The 2029 Dollar Senior Notes were issued at par and are due February 15, 2029. The 2029 Dollar Senior Notes bear interest at 3.375 % which is payable semi-annually on February 15th and August 15th. We have the option to redeem all or part of the 2029 Dollar Senior Notes at the following redemption prices (expressed as percentages of principal amount) on or after February 15 th of the years indicated:
| Period | 2029 Dollar Senior Notes Percentage | |||||||
| 2024 | % | |||||||
| 2025 | % | |||||||
| 2026 and thereafter | % | |||||||
Notwithstanding the foregoing, at any time prior to February 15, 2024, we may at our option redeem in the aggregate up to 40 % of the original aggregate principal amount of the 2029 Dollar Senior Notes with the net cash proceeds of one or more Equity Offerings (as defined in the indenture governing the 2029 Dollar Senior Notes) at a redemption price of 103.375 % plus accrued and unpaid interest, if any, to the redemption date. At least 50 % of the original aggregate principal of the notes must remain outstanding after each such redemption.
91
Upon the occurrence of certain events constituting a change of control, holders of the 2029 Dollar Senior Notes have the right to require us to repurchase all or any part of the 2029 Dollar Senior Notes at a purchase price equal to 101 % of the principal amount plus accrued and unpaid interest, if any, to the repurchase date.
The 2029 Dollar Senior Notes, subject to local law limitations, are jointly and severally guaranteed on a senior unsecured basis by the Company and each of its existing and future direct and indirect subsidiaries that is a borrower under or that guarantees the Senior Secured Credit Facilities.
Under certain circumstances, the guarantors may be released from their guarantees without the consent of the holders of the applicable series of notes.
The indebtedness through the 2029 Dollar Senior Notes is senior unsecured indebtedness of the U.S. Issuer, is senior in right of payment to all future subordinated indebtedness of the U.S. Issuer and guarantors and is equal in right of payment to all existing and future senior indebtedness of the U.S. Issuer and guarantors. The 2029 Dollar Senior Notes are effectively subordinated to any secured indebtedness of the U.S. Issuer and guarantors (including indebtedness outstanding under the Senior Secured Credit Facilities) to the extent of the value of the assets securing such indebtedness.
2021 Activities
None.
2020 Activities
During June 2020, the Issuers issued $500.0 million in aggregate principal amount of 4.750 % Senior Notes due 2027.
In November 2020, the Company issued $700.0 million in aggregate principal amount of 3.375 % Senior Notes due 2029. The net proceeds from the 2029 Dollar Senior Notes, together with cash on hand were used to redeem the $500.0 million aggregate principal amount of the 4.875 % 2024 Dollar Senior Notes and the €335.0 million aggregate principal amount of the 4.25 % 2024 Euro Senior Notes and pay related transaction costs and expenses ("November 2020 Restructuring").
In connection with the November 2020 Restructuring, we recorded a $31.4 million loss on extinguishment and other financing-related costs for the year ended December 31, 2020. The loss was comprised of the redemption premium of $20.6 million, write off of unamortized deferred financing costs attributable to the 2024 Senior Notes of $9.8 million and other fees directly associated with the transaction of $1.0 million.
2019 Activities
None.
92
Supplier financing arrangements
We have a financing program in China which is utilized to finance the purchases of goods and services from our suppliers through local banking institutions. The payment terms under the financing program vary, but the program has a weighted average maturity date that approximates 90 days. These financing arrangements are included in current portion of borrowings within the consolidated balance sheets and at the time of issuance each transaction is treated as a non-cash financing activity within the consolidated statements of cash flows. Upon settlement of the financing, the cash outflow is classified as a financing activity within the consolidated statements of cash flows. Amounts outstanding under this program were $24.0 million, $16.5 million and $10.9 million at December 31, 2021, 2020 and 2019, respectively, including $3.8 million, $4.7 million and $1.3 million, respectively, related to purchases of property, plant and equipment. Cash outflows under this program were $63.8 million, $33.2 million and $39.0 million for the years ended December 31, 2021, 2020 and 2019, respectively.
Future repayments
Below is a schedule of required future repayments of all borrowings outstanding at December 31, 2021.
| 2022 | $ | |||||||
| 2023 | ||||||||
| 2024 | ||||||||
| 2025 | ||||||||
| 2026 | ||||||||
| Thereafter | ||||||||
| Total borrowings | $ | |||||||
| Unamortized original issue discount | ( |
|||||||
| Unamortized deferred financing costs | ( |
|||||||
| Total borrowings, net | $ | |||||||
(19) FINANCIAL INSTRUMENTS, HEDGING ACTIVITIES AND FAIR VALUE MEASUREMENTS
Fair value of financial instruments
Equity securities with readily determinable fair values - Balances of equity securities are recorded within other assets, with any changes in fair value recorded within other (income) expense, net. The fair values of equity securities are based upon quoted market prices, which are considered Level 1 inputs.
Long-term borrowings - The estimated fair values of these borrowings are based on recent trades, as reported by a third-party pricing service. Due to the infrequency of trades, these inputs are considered to be Level 2 inputs.
Derivative instruments - The Company's interest rate caps, interest rate swaps and cross-currency swaps are valued using broker quotations, or market transactions in either the listed or over-the-counter markets. As such, these derivative instruments are included in the Level 2 hierarchy.
Fair value of contingent consideration
The fair value of contingent consideration associated with an acquisition completed in the current year is valued at each balance sheet date, until amounts become payable, with adjustments recorded in other (income) expense within other operating charges in the consolidated statements of operations. During the year ended December 31, 2021, in conjunction with the acquisition in China described in Note 3, we recorded fair value of contingent consideration of $7.8 million, including $0.5 million of accretion for the passage of time and currency translation. The contingent consideration was valued using a probability-weighted expected payment method. The analysis considered the timing of expected future cash flows and the probability of whether key elements of the contingent event are completed. Due to the significant unobservable inputs used in the valuations, these liabilities are categorized within Level 3 of the fair value hierarchy.
93
The table below presents the fair values of our financial instruments measured on a recurring basis by level within the fair value hierarchy at December 31, 2021 and December 31, 2020.
| December 31, 2021 | December 31, 2020 | |||||||||||||||||||||||||||||||||||||||||||||||||
| Level 1 | Level 2 | Level 3 | Total | Level 1 | Level 2 | Level 3 | Total | |||||||||||||||||||||||||||||||||||||||||||
| Assets | ||||||||||||||||||||||||||||||||||||||||||||||||||
| Prepaid expenses and other current assets: | ||||||||||||||||||||||||||||||||||||||||||||||||||
Cross-currency swaps (2)
|
$ | $ | $ | $ | $ | $ | $ | $ | ||||||||||||||||||||||||||||||||||||||||||
| Other assets: | ||||||||||||||||||||||||||||||||||||||||||||||||||
Cross-currency swaps (2)
|
||||||||||||||||||||||||||||||||||||||||||||||||||
Investments in equity securities |
||||||||||||||||||||||||||||||||||||||||||||||||||
| Liabilities | ||||||||||||||||||||||||||||||||||||||||||||||||||
| Other accrued liabilities: | ||||||||||||||||||||||||||||||||||||||||||||||||||
Interest rate caps (1)
|
||||||||||||||||||||||||||||||||||||||||||||||||||
Interest rate swaps (1)
|
||||||||||||||||||||||||||||||||||||||||||||||||||
| Contingent consideration | ||||||||||||||||||||||||||||||||||||||||||||||||||
| Other liabilities: | ||||||||||||||||||||||||||||||||||||||||||||||||||
Interest rate swaps (1)
|
||||||||||||||||||||||||||||||||||||||||||||||||||
Cross-currency swaps (2)
|
||||||||||||||||||||||||||||||||||||||||||||||||||
| Long-term borrowings: | ||||||||||||||||||||||||||||||||||||||||||||||||||
| 2024 Dollar Term Loans | ||||||||||||||||||||||||||||||||||||||||||||||||||
2025 Euro Senior Notes |
||||||||||||||||||||||||||||||||||||||||||||||||||
| 2027 Dollar Senior Notes | ||||||||||||||||||||||||||||||||||||||||||||||||||
| 2029 Dollar Senior Notes | ||||||||||||||||||||||||||||||||||||||||||||||||||
(1) Cash flow hedge
(2) Net investment hedge
The table below presents a roll forward of activity for the Level 3 liabilities for the year ended December 31, 2021.
| Fair Value Using Significant Unobservable Inputs (Level 3) |
||||||||
| Beginning balance January 1, 2021 | $ | |||||||
| Business acquisition | ||||||||
| Change in fair value | ||||||||
| Ending balance at December 31, 2021 | $ | |||||||
Derivative Financial Instruments
We selectively use derivative instruments to reduce market risk associated with changes in foreign currency exchange rates and interest rates. The use of derivatives is intended for hedging purposes only, and we do not enter into derivative instruments for speculative purposes. A description of each type of derivative used to manage risk is included in the following paragraphs.
Certain derivative instruments in use are contingent upon changes in LIBOR, which is the subject of recent reform and will cease being published in June 2023. The derivative instruments under LIBOR terms that we are currently party to will either mature before June 2023 or the agreements contain transitional language to a different reference rate.
94
Derivative Instruments Qualifying and Designated as Cash Flow and Net Investment Hedges
Interest Rate Caps Designated as Cash Flow Hedges
During the year ended December 31, 2017, we entered into four 1.5 % interest rate caps with aggregate notional amounts totaling $850.0 million to hedge the variable interest rate exposures on our 2024 Dollar Term Loans. The final interest rate cap entered into during 2017, comprising $250.0 million of notional value, expired December 31, 2021 and had a deferred premium of $8.1 million at inception. All deferred premiums were paid quarterly over the term of the respective interest rate caps. These interest rate caps were marked to market at each reporting date and any unrealized gains or losses were included in AOCI and reclassified to interest expense in the same period or periods during which the hedged transactions affected earnings.
Interest Rate Swaps Designated as Cash Flow Hedges
During the three months ended June 30, 2018, we entered into three interest rate swaps with aggregate notional amounts totaling $475.0 million to hedge interest rate exposures related to variable rate borrowings under the 2024 Dollar Term Loans. Under the terms of the interest rate swap agreements, the Company is required to pay the counter-parties a stream of fixed interest payments at a rate of 2.72 % and in turn, receives variable interest payments based on 3-month LIBOR from the counter-parties. The interest rate swaps are designated as cash flow hedges and expire on March 31, 2023. These interest rate swaps are marked to market at each reporting date and any unrealized gains or losses are included in AOCI and reclassified to interest expense in the same period or periods during which the hedged transactions affect earnings.
During the three months ended March 31, 2019, we entered into two interest rate swaps with aggregate notional amounts totaling $500.0 million, effective December 31, 2019, to hedge interest rate exposure associated with the 2024 Dollar Term Loans. Under the terms of the interest rate swap agreements, the Company is required to pay the counter-parties a stream of fixed interest payments at a rate of 2.59 % and in turn, receives variable interest payments based on 3-month LIBOR from the counter-parties. The interest rate swaps are designated as cash flow hedges and expire on December 31, 2022. These interest rate swaps are marked to market at each reporting date and any unrealized gains or losses are included in AOCI and reclassified to interest expense in the same period or periods during which the hedged transactions affect earnings.
During the three months ended March 31, 2020, we entered into two interest rate swaps with aggregate notional amounts totaling $400.0 million to hedge interest rate exposures associated with the 2024 Dollar Term Loans. Under the terms of the interest rate swap agreements, the Company is required to pay the counter-parties a stream of fixed interest payments at rates of 1.61 % and 1.18 % on $200.0
Cross-Currency Swaps Designated as Net Investment Hedges
During the three months ended December 31, 2018, we notionally exchanged $475.0 million at a weighted average interest rate of 4.47 % for €416.6 million at a weighted average interest rate of 1.44 %. The cross-currency swaps are designated as net investment hedges and expire on March 31, 2023. These cross-currency swaps are marked to market at each reporting date and any unrealized gains or losses are included in unrealized currency translation adjustments, within AOCI.
During the three months ended December 31, 2020, in connection with the issuance of the 2029 Dollar Senior Notes, we entered into two fixed-for-fixed cross currency swaps with aggregate notional amounts totaling €335.0 million to hedge the variability of exchange rate impacts between the U.S. Dollar and Euro. Under the terms of the cross-currency swap agreements, the Company notionally exchanged $396.3 million at a weighted average interest rate of 3.375 % for €335.0 million at a weighted average interest rate of 2.15 %. The cross-currency swaps are designated as net investment hedges and expire on February 15, 2029. These cross-currency swaps are marked to market at each reporting date and any unrealized gains or losses are included in unrealized currency translation adjustments, within AOCI.
Foreign Currency Forward Contracts Designated as Cash Flow Hedges
During the year ended December 31, 2020, we designated foreign currency forward contracts with a notional value of $8.3 million as cash flow hedges of the Company's exposure to variability in exchange rates on forecasted purchases of inventory denominated in foreign currencies. These forward currency contracts were marked to market at each reporting date and any unrealized gains or losses were included in AOCI and reclassified to cost of goods sold in the same period or periods during which the hedged transactions affect earnings. These foreign currency forward contracts expired during the year ended December 31, 2021.
95
The following table presents the fair values of derivative instruments that qualify and have been designated as cash flow and net investment hedges included in AOCI:
| December 31, | ||||||||||||||
| 2021 | 2020 | |||||||||||||
| AOCI: | ||||||||||||||
| Interest rate caps (cash flow hedges) | $ | $ | ||||||||||||
| Interest rate swaps (cash flow hedges) | ||||||||||||||
| Foreign currency forward contracts (cash flow hedges) | ||||||||||||||
| Cross-currency swaps (net investment hedges) | ( |
|||||||||||||
| Total AOCI | $ | $ | ||||||||||||
Gains and losses on the derivative representing hedge components excluded from the assessment of effectiveness are recognized over the life of the hedge on a systematic and rational basis.
The following tables set forth the locations and amounts recognized during the year ended December 31, 2021, 2020 and 2019 for these cash flow and net investment hedges.
| Year Ended December 31, | ||||||||||||||||||||||||||||||||||||||||||||
| 2021 | 2020 | 2019 | ||||||||||||||||||||||||||||||||||||||||||
| Derivatives in Cash Flow and Net Investment Hedges | Location of Loss (Gain) Recognized in Income on Derivatives | Net Amount of Gain Recognized in OCI on Derivatives | Amount of Loss (Gain) Recognized in Income | Net Amount of Loss Recognized in OCI on Derivatives | Amount of Loss (Gain) Recognized in Income | Net Amount of Loss (Gain) Recognized in OCI on Derivatives |
Amount of (Gain) Loss Recognized in Income | |||||||||||||||||||||||||||||||||||||
| Interest rate caps | Interest expense, net | $ | $ | $ | $ | $ | $ | ( |
||||||||||||||||||||||||||||||||||||
Interest rate swaps |
Interest expense, net | ( |
||||||||||||||||||||||||||||||||||||||||||
| Foreign currency forward contracts | Cost of goods sold | |||||||||||||||||||||||||||||||||||||||||||
Cross-currency swaps |
Interest expense, net | ( |
( |
( |
( |
( |
||||||||||||||||||||||||||||||||||||||
Over the next 12 months, we expect losses of $24.4 million pertaining to cash flow hedges to be reclassified from AOCI into earnings, related to our interest rate swaps.
Derivative Instruments Not Designated as Cash Flow Hedges
We periodically enter into foreign currency forward and option contracts to reduce market risk and hedge our balance sheet exposures and cash flows for subsidiaries with exposures denominated in currencies different from the functional currency of the relevant subsidiary. These contracts have not been designated as hedges and all gains and losses are marked to market through other (income) expense, net in the consolidated statement of operations.
During July 2021, we entered into two foreign currency forward contracts with a total notional value of £259.1 million to hedge the variability in exchange rates between the execution date of the agreement to purchase U-POL and the closing of the transaction. The contracts were settled in September 2021, and we realized a loss of $0.6 million within other (income) expense, net in the consolidated statement of operations.
Fair value gains and losses of derivative contracts, as determined using Level 2 inputs, that have not been designated for hedge accounting treatment are recorded in earnings as follows:
| Derivatives Not Designated as Hedging Instruments under ASC 815 |
Location of (Gain) Loss Recognized in Income on Derivatives |
Year Ended December 31, | ||||||||||||||||||||||||
| 2021 | 2020 | 2019 | ||||||||||||||||||||||||
Foreign currency forward contracts |
Other (income) expense, net | $ | ( |
$ | $ | |||||||||||||||||||||
96
(20) SEGMENTS
The Company identifies an operating segment as a component: (i) that engages in business activities from which it may earn revenues and incur expenses; (ii) whose operating results are regularly reviewed by the Chief Operating Decision Maker ("CODM") to make decisions about resources to be allocated to the segment and assess its performance; and (iii) that has available discrete financial information.
We have two
Through our Performance Coatings segment, we provide high-quality liquid and powder coatings solutions to a fragmented and local customer base. We are one of only a few suppliers with the technology to provide precise color matching and highly durable coatings systems. The end-markets within this segment are refinish and industrial.
Through our Mobility Coatings segment, we provide coatings technologies while focusing on supporting the accelerating demand for e-mobility and the evolving coatings needs of established and emerging light and commercial vehicle OEMs, fleet owners and shared mobility providers. These global customers are faced with evolving megatrends in sustainability, personalization and autonomous driving that require a high level of technical support coupled with productive, environmentally responsible coatings systems that can be applied with a high degree of precision, consistency and speed. The end-markets within this segment are light vehicle and commercial vehicle.
Adjusted EBIT is the primary measure to evaluate financial performance of the operating segments and allocate resources. Asset information is not reviewed or included with our internal management reporting. Therefore, the Company has not disclosed asset information for each reportable segment. The following table presents relevant information of our reportable segments.
| Year Ended December 31, | ||||||||||||||||||||
| 2021 | 2020 | 2019 | ||||||||||||||||||
Net sales (1):
|
||||||||||||||||||||
| Refinish | $ | $ | $ | |||||||||||||||||
| Industrial | ||||||||||||||||||||
| Total Net sales Performance Coatings | ||||||||||||||||||||
| Light Vehicle | ||||||||||||||||||||
| Commercial Vehicle | ||||||||||||||||||||
| Total Net sales Mobility Coatings | ||||||||||||||||||||
| Total Net sales | $ | $ | $ | |||||||||||||||||
Depreciation and amortization expense (2):
|
||||||||||||||||||||
| Performance Coatings | $ | $ | $ | |||||||||||||||||
| Mobility Coatings | ||||||||||||||||||||
| Total Depreciation and amortization expense | $ | $ | $ | |||||||||||||||||
| December 31, 2021 | December 31, 2020 | December 31, 2019 | ||||||||||||||||||
| Investment in unconsolidated affiliates: | ||||||||||||||||||||
| Performance Coatings | $ | $ | $ | |||||||||||||||||
| Mobility Coatings | ||||||||||||||||||||
| Total | $ | $ | $ | |||||||||||||||||
97
(1)The Company has no
(2)Depreciation and amortization expenses relating to assets used within the operations of a specifically identifiable segment are recorded to the appropriate segment, while depreciation and amortization expenses relating to assets shared in our integrated supply chain are allocated to the appropriate segments on a consistent basis reflecting their use.
98
The following table reconciles our segment operating performance to income before income taxes for the periods presented:
| Year Ended December 31, | ||||||||||||||||||||
| 2021 | 2020 | 2019 | ||||||||||||||||||
Segment Adjusted EBIT (1):
|
||||||||||||||||||||
| Performance Coatings | $ | $ | $ | |||||||||||||||||
| Mobility Coatings | ||||||||||||||||||||
Total (2)
|
||||||||||||||||||||
| Interest expense, net | ||||||||||||||||||||
Debt extinguishment and refinancing related costs (a)
|
||||||||||||||||||||
Termination benefits and other employee related costs (b)
|
||||||||||||||||||||
Strategic review and retention costs (c)
|
||||||||||||||||||||
Acquisition and divestiture-related costs (d)
|
||||||||||||||||||||
Impairment charges (e)
|
||||||||||||||||||||
Pension special events (f)
|
( |
( |
||||||||||||||||||
Accelerated depreciation (g)
|
||||||||||||||||||||
Indemnity (income) loss (h)
|
( |
( |
||||||||||||||||||
Operational matter (i)
|
||||||||||||||||||||
Brazil indirect tax (j)
|
( |
|||||||||||||||||||
Gains on sales of facilities (k)
|
( |
|||||||||||||||||||
| Income before income taxes | $ | $ | $ | |||||||||||||||||
| (1) | The primary measure of segment operating performance is Adjusted EBIT, which is defined as net income before interest, taxes and select other items impacting operating results. These other items impacting operating results are items that management has concluded are (1) non-cash items included within net income, (2) items the Company does not believe are indicative of ongoing operating performance or (3) non-recurring, unusual or infrequent items that have not occurred within the last two years or we believe are not reasonably likely to recur within the next two years. Adjusted EBIT is a key metric that is used by management to evaluate business performance in comparison to budgets, forecasts and prior year financial results, providing a measure that management believes reflects the Company's core operating performance, which represents Adjusted EBIT adjusted for the select items referred to above. |
||||
| (2) | Does not represent Adjusted EBIT referenced elsewhere by the Company as there are additional adjustments that are not allocated to the segments. |
||||
| (a) | Represents expenses and associated changes to estimates related to the prepayment, restructuring and refinancing of our indebtedness, which are not considered indicative of our ongoing operating performance. | ||||
| (b) | Represents expenses and associated changes to estimates related to employee termination benefits and other employee-related costs. Employee termination benefits are primarily associated with Axalta Way initiatives. These amounts are not considered indicative of our ongoing operating performance. | ||||
| (c) | Represents costs for legal, tax and other advisory fees pertaining to our review of strategic alternatives that was concluded in March 2020, as well as retention awards for certain employees, which were earned over a period of |
||||
| (d) | Represents acquisition and divestiture-related expenses and non-cash fair value inventory adjustments associated with our business combinations, all of which are not considered indicative of our ongoing operating performance. The amount for the year ended December 31, 2021 includes $ |
||||
| (e) | Represents impairment charges, which are not considered indicative of our ongoing performance. The amount for the year ended December 31, 2021 includes a recovered gain on a previously impaired asset. | ||||
| (f) | Represents certain defined benefit pension costs associated with special events, including pension curtailments, settlements and special termination benefits, which we do not consider indicative of our ongoing operating performance. | ||||
| (g) | Represents incremental depreciation expense resulting from truncated useful lives of the assets impacted by our manufacturing footprint assessments, which we do not consider indicative of our ongoing operating performance. | ||||
| (h) | Represents indemnity (income) loss associated with acquisitions, which we do not consider indicative of our ongoing operating performance. | ||||
| (i) | Represents expenses, changes in estimates and insurance recoveries for probable liabilities related to an operational matter in the Mobility Coatings segment discussed further in Note 6, which is not indicative of our ongoing operating performance. | ||||
| (j) | Represents non-recurring income related to a law change with respect to certain Brazilian indirect taxes which was recorded within other (income) expense, net. | ||||
| (k) | Represents non-recurring income related to the sales of previously closed manufacturing facilities and a customer training facility. | ||||
99
Geographic Area Information:
The information within the following tables provides disaggregated information related to our net sales and long-lived assets.
Net sales by region were as follows:
| Year Ended December 31, | ||||||||||||||||||||
| 2021 | 2020 | 2019 | ||||||||||||||||||
| North America | $ | $ | $ | |||||||||||||||||
| EMEA | ||||||||||||||||||||
| Asia Pacific | ||||||||||||||||||||
Latin America (1)
|
||||||||||||||||||||
Total (2)
|
$ | $ | $ | |||||||||||||||||
Net long-lived assets by region were as follows:
| Year Ended December 31, | ||||||||||||||
| 2021 | 2020 | |||||||||||||
| North America | $ | $ | ||||||||||||
| EMEA | ||||||||||||||
| Asia Pacific | ||||||||||||||
Latin America (1)
|
||||||||||||||
Total (3)
|
$ | $ | ||||||||||||
(1)Includes Mexico
(2)Net Sales are attributed to countries based on the customer's location. Sales to external customers in China represented approximately 10 %, 9 % and 9 % of the total for the years ended December 31, 2021, 2020 and 2019, respectively. Sales to external customers in Germany represented approximately 7 %, 8 %, and 8 % of the total for the years ended December 31, 2021, 2020 and 2019, respectively. Mexico represented 5 %, 5 %, and 6 % of the total for the years ended December 31, 2021, 2020 and 2019, respectively. Canada, which is included in the North America region, represents approximately 3 %, 4 %, and 4 % of total net sales for the years ended December 31, 2021, 2020 and 2019, respectively.
(3)Long-lived assets consist of property, plant and equipment, net. Germany long-lived assets amounted to approximately $214.9 million and $243.3 million at December 31, 2021 and 2020, respectively. China long-lived assets amounted to $188.4 million and $167.3 million at December 31, 2021 and 2020, respectively. Brazil long-lived assets amounted to approximately $30.7 million and $36.2 million at December 31, 2021 and 2020, respectively. Canada long-lived assets, which are included in the North America region, amounted to approximately $17.9 million and $21.7 million at December 31, 2021 and 2020, respectively.
(21) ACCUMULATED OTHER COMPREHENSIVE LOSS
| Unrealized Currency Translation Adjustments |
Pension Plan Adjustments |
Unrealized Gain (Loss) on Derivatives |
Accumulated Other Comprehensive Loss |
|||||||||||||||||||||||
| Balance, December 31, 2020 | $ | ( |
$ | ( |
$ | ( |
$ | ( |
||||||||||||||||||
| Current year deferrals to AOCI | (29.8) | ( |
||||||||||||||||||||||||
Reclassifications from AOCI to Net income |
( |
|||||||||||||||||||||||||
| Net Change | ( |
|||||||||||||||||||||||||
| Balance, December 31, 2021 | $ | ( |
$ | ( |
$ | ( |
$ | ( |
||||||||||||||||||
The cumulative income tax benefit related to the adjustments for pension benefits at December 31, 2021 was $24.8 million. The cumulative income tax benefit related to the adjustments for unrealized loss on derivatives at December 31, 2021 was $3.6 million. See Note 19 for classification within the consolidated statements of operations of the gains and losses on derivatives reclassified from AOCI.
100
| Unrealized Currency Translation Adjustments |
Pension Plan Adjustments |
Unrealized Gain (Loss) on Derivatives |
Accumulated Other Comprehensive Loss |
|||||||||||||||||||||||
| Balance, December 31, 2019 | $ | ( |
$ | ( |
$ | ( |
$ | (395.5) | ||||||||||||||||||
| Current year deferrals to AOCI | 30.0 | ( |
( |
(33.9) | ||||||||||||||||||||||
Reclassifications from AOCI to Net income |
( |
4.6 | ||||||||||||||||||||||||
| Net Change | ( |
( |
( |
|||||||||||||||||||||||
| Balance, December 31, 2020 | $ | ( |
$ | ( |
$ | ( |
$ | ( |
||||||||||||||||||
The cumulative income tax benefit related to the adjustments for pension benefits at December 31, 2020 was $33.5 million. The cumulative income tax benefit related to the adjustments for unrealized loss on derivatives at December 31, 2020 was $8.8 million. See Note 19 for classification within the consolidated statements of operations of the gains and losses on derivatives reclassified from AOCI.
| Unrealized Currency Translation Adjustments |
Pension Plan Adjustments |
Unrealized Gain (Loss) on Derivatives |
Accumulated Other Comprehensive Loss |
|||||||||||||||||||||||
| Balance, December 31, 2018 | $ | ( |
$ | ( |
$ | ( |
$ | ( |
||||||||||||||||||
| Current year deferrals to AOCI | ( |
( |
( |
|||||||||||||||||||||||
Reclassifications from AOCI to Net income |
( |
( |
( |
|||||||||||||||||||||||
| Net Change | ( |
( |
( |
|||||||||||||||||||||||
| Balance, December 31, 2019 | $ | ( |
$ | ( |
$ | ( |
$ | ( |
||||||||||||||||||
The cumulative income tax benefit related to the adjustments for pension benefits at December 31, 2019 was $27.0 million. The cumulative income tax benefit related to the adjustments for unrealized loss on derivatives at December 31, 2019 was $4.3 million.
101
ITEM 9. CHANGES IN AND DISAGREEMENTS WITH ACCOUNTANTS ON ACCOUNTING AND FINANCIAL DISCLOSURE
None.
ITEM 9A. CONTROLS AND PROCEDURES
Evaluation of disclosure controls and procedures
As required by Rules 13a-15(b) or 15d-15(b) under the Securities Exchange Act of 1934 (the "Exchange Act"), the Company carried out an evaluation, under the supervision and with the participation of management, including its Chief Executive Officer and Chief Financial Officer, of the effectiveness of the design and operation of the Company's disclosure controls and procedures (as defined in Rules 13a-15(e) or 15d-15(e) under Exchange Act) as of the end of the period covered by this Annual Report on Form 10-K. There are inherent limitations to the effectiveness of any system of disclosure controls and procedures. No matter how well designed and operated, disclosure controls and procedures can provide only reasonable, rather than absolute, assurance of achieving the desired control objectives. Based on the foregoing, the Company's Chief Executive Officer and Chief Financial Officer concluded that the Company's disclosure controls and procedures were effective at a reasonable assurance level as of December 31, 2021.
Management's report on internal control over financial reporting
Management is responsible for establishing and maintaining adequate internal control over financial reporting (as defined in Rules 13a-15(f) and 15d-15(f) under the Exchange Act).
Management assessed the effectiveness of the Company's internal control over financial reporting based on the criteria set forth by the Committee of Sponsoring Organizations of the Treadway Commission ("COSO") in Internal Control—Integrated Framework (2013). Based on this assessment, management concluded that, as of December 31, 2021, the Company's internal control over financial reporting was effective.
The effectiveness of our internal control over financial reporting has been audited by PricewaterhouseCoopers LLP, an independent registered public accounting firm, as stated in its report which is included herein.
We excluded U-POL Holdings Limited ("U-POL") from our assessment of internal control over financial reporting as of December 31, 2021 because it was acquired by us in a purchase business combination in 2021. U-POL is a wholly-owned subsidiary whose total assets and total revenues represent 1.4% and 0.9%, respectively, of the related consolidated financial amounts as of and for the year ended December 31, 2021.
Changes in internal control over financial reporting
There were no changes in the Company's internal control over financial reporting that occurred during the quarter ended December 31, 2021 that have materially affected, or are reasonably likely to materially affect, the Company's internal control over financial reporting.
ITEM 9B. OTHER INFORMATION
None.
ITEM 9C. DISCLOSURE REGARDING FOREIGN JURISDICTIONS THAT PREVENT INSPECTIONS
None.
102
PART III
ITEM 10. DIRECTORS, EXECUTIVE OFFICERS AND CORPORATE GOVERNANCE
The information about the Company's directors required by Item 10 and not otherwise set forth below is contained under the caption "Proposal No. 1: Election of Directors" in Axalta's definitive Proxy Statement for the 2022 Annual General Meeting of Members (the "Proxy Statement") which the Company anticipates filing with the Securities and Exchange Commission, pursuant to Regulation 14A, not later than 120 days after the end of the Company's fiscal year, and is incorporated herein by reference.
The executive officers of the Company are elected by the Board of Directors. The information required by this item concerning the Company's executive officers is incorporated by reference herein from Part I of this report under the caption "Information About Our Executive Officers."
Information regarding the Company's Audit Committee, code of ethics, and compliance with Section 16(a) of the Exchange Act is included in the Proxy Statement under the captions "Corporate Governance Matters and Committees of the Board of Directors", and "Delinquent Section 16(a) Reports", respectively and is incorporated herein by reference.
ITEM 11. EXECUTIVE COMPENSATION
The information required by Item 11 is contained in the Proxy Statement under the captions "Compensation Discussion and Analysis", "Executive Compensation" and "Compensation Committee Report" and is incorporated herein by reference.
ITEM 12. SECURITY OWNERSHIP OF CERTAIN BENEFICIAL OWNERS AND MANAGEMENT AND RELATED SHAREHOLDER MATTERS
The information required by Item 12 is contained in the Proxy Statement under the captions "Security Ownership of Certain Beneficial Owners and Management" and "Equity Compensation Plan Information" and is incorporated herein by reference.
ITEM 13. CERTAIN RELATIONSHIPS AND RELATED TRANSACTIONS AND DIRECTOR INDEPENDENCE
The information required by Item 13 is contained in the Proxy Statement under the captions "Director Independence" and "Certain Relationships and Related Person Transactions" and is incorporated herein by reference.
ITEM 14. PRINCIPAL ACCOUNTANT FEES AND SERVICES
The information required by Item 14 is contained in the Proxy Statement under the caption "Proposal No. 2: Appointment of PricewaterhouseCoopers LLP as the Company's Independent Registered Public Accounting Firm and Auditor" and is incorporated herein by reference.
103
PART IV
ITEM 15. EXHIBITS AND FINANCIAL STATEMENT SCHEDULES
(a)(1) The Company's 2021 Consolidated Financial Statements and Reports of Independent Registered Public Accounting Firm are included in Part II, Item 8 of this Annual Report on Form 10-K.
(a)(2) The following Consolidated Financial Statement Schedule for the years ended December 31, 2021, 2020 and 2019 should be read in conjunction with the previously referenced financial statements:
SCHEDULE II - VALUATION AND QUALIFYING ACCOUNTS
Allowance for Doubtful Accounts for the years ended December 31:
| (in millions) | Balance at Beginning of Year | Additions |
Deductions (1)
|
Balance at End of Year | ||||||||||||||||||||||
| 2021 | $ | ( |
$ | |||||||||||||||||||||||
| 2020 | $ | ( |
$ | |||||||||||||||||||||||
| 2019 | $ | ( |
$ | |||||||||||||||||||||||
(1)Deductions include uncollectible accounts written off and foreign currency translation impact.
Deferred tax asset valuation allowances for the years ended December 31:
| (in millions) | Balance at Beginning of Year |
Additions (1)
|
Deductions (1)
|
Balance at End of Year | ||||||||||||||||||||||
| 2021 | $ | ( |
$ | |||||||||||||||||||||||
| 2020 | $ | ( |
$ | |||||||||||||||||||||||
| 2019 | $ | ( |
$ | |||||||||||||||||||||||
(1)Additions and deductions include charges to foreign currency translation impact.
(a)(3) The following exhibits are filed as a part of, or incorporated by reference into, this Form 10-K.
EXHIBIT NO. |
DESCRIPTION OF EXHIBITS |
||||
| 2.1* | |||||
| 2.2* | |||||
| 2.3* | |||||
| 2.4* | |||||
| 3.1* | |||||
| 3.2* | |||||
| 4.1* | |||||
104
| 4.2* | |||||
| 4.3* | |||||
| 4.5* | |||||
| 4.6* | |||||
| 4.7* | |||||
| 4.8* | |||||
| 10.1* | |||||
| 10.2* | |||||
| 10.3* | |||||
| 10.4* | |||||
105
106
| 10.16* | |||||
| 10.17* | |||||
| 10.18* | |||||
| 10.19* | |||||
| 10.20* | |||||
| 10.21* | |||||
| 10.22* | |||||
| 10.23* | |||||
| 10.24* | |||||
| 10.25* | |||||
| 10.26* | |||||
107
| 10.27* | |||||
| 10.28* | |||||
| 10.29* | |||||
| 10.30* | |||||
| 10.31* | |||||
| 10.32* | |||||
| 10.33* | |||||
| 10.34* | |||||
| 10.35* | |||||
| 10.36* | |||||
| 10.37* | |||||
108
| 10.38* | |||||
| 10.39* | |||||
| 10.40* | |||||
| 10.41* | |||||
| 10.42* | |||||
| 10.43* | |||||
| 10.44* | |||||
| 10.45* | |||||
| 10.46* | |||||
| 10.47* | |||||
| 10.48* | |||||
| 10.49* | |||||
| 10.50* | |||||
| 10.51* | |||||
| 10.52* | |||||
| 10.53* | |||||
| 10.54* | |||||
109
| 10.55* | |||||
| 10.56* | |||||
| 10.57* | |||||
| 10.58* | |||||
| 10.59* | |||||
| 21.1 | |||||
| 23.1 | |||||
| 31.1 | |||||
| 31.2 | |||||
| 32.1† | |||||
| 32.2† | |||||
| 101 | INS - XBRL Instance Document. The document does not appear in the interactive data file because its XBRL tags are embedded within the inline XBRL document | ||||
| 101 | SCH - XBRL Taxonomy Extension Schema Document | ||||
| 101 | CAL - XBRL Taxonomy Extension Calculation Linkbase Document | ||||
| 101 | DEF - XBRL Taxonomy Extension Definition Linkbase Document | ||||
| 101 | LAB - XBRL Taxonomy Extension Label Linkbase Document | ||||
| 101 | PRE - XBRL Taxonomy Extension Presentation Linkbase Document | ||||
| 104 | Cover Page Interactive Data File (embedded within the Inline XBRL document) | ||||
| * | Previously filed. | ||||
| † | In accordance with Item 601(b)(32)(ii) of Regulation S-K and SEC Release No. 33-8238 and 34-47986, Final Rule: Management's Reports on Internal Control Over Financial Reporting and Certification of Disclosure in Exchange Act Periodic Reports, the certifications furnished in Exhibits 32.1 and 32.2 hereto are deemed to accompany this Form 10-K and will not be deemed "filed" for purposes of section 18 of the Exchange Act. Such certifications will not be deemed to be incorporated by reference into any filings under the Securities Act or the Exchange Act, except to the extent that the registrant specifically incorporates it by reference. | ||||
ITEM 16. FORM 10-K SUMMARY
None.
110
SIGNATURES
Pursuant to the requirements of Section 13 or 15(d) of the Securities Exchange Act of 1934, the Registrant has duly caused this report to be signed on its behalf by the undersigned thereunto duly authorized on February 18, 2022.
| AXALTA COATING SYSTEMS LTD. | ||||||||
| By: | /s/ Robert W. Bryant | |||||||
| Robert W. Bryant | ||||||||
| Chief Executive Officer and President | ||||||||
Pursuant to the requirements of the Securities Exchange Act of 1934, the Registrant has duly caused this report to be signed on its behalf by the undersigned duly authorized.
| Signature | Title | Date | ||||||||||||
| /s/ Robert W. Bryant | Chief Executive Officer and President | February 18, 2022 | ||||||||||||
| Robert W. Bryant | (Principal Executive Officer) | |||||||||||||
| /s/ Sean M. Lannon | Senior Vice President and Chief Financial Officer | February 18, 2022 | ||||||||||||
| Sean M. Lannon | (Principal Financial Officer) | |||||||||||||
| /s/ Anthony Massey | Vice President and Global Controller | February 18, 2022 | ||||||||||||
| Anthony Massey | (Principal Accounting Officer) | |||||||||||||
| /s/ William M. Cook | Chair of the Board and Director | February 18, 2022 | ||||||||||||
| William M. Cook | ||||||||||||||
| /s/ Steven M. Chapman | Director | February 18, 2022 | ||||||||||||
| Steven M. Chapman | ||||||||||||||
| /s/ Tyrone M. Jordan | Director | February 18, 2022 | ||||||||||||
| Tyrone M. Jordan | ||||||||||||||
| /s/ Deborah J. Kissire | Director | February 18, 2022 | ||||||||||||
| Deborah J. Kissire | ||||||||||||||
| /s/ Elizabeth C. Lempres | Director | February 18, 2022 | ||||||||||||
| Elizabeth C. Lempres | ||||||||||||||
| /s/ Robert M. McLaughlin | Director | February 18, 2022 | ||||||||||||
| Robert M. McLaughlin | ||||||||||||||
| /s/ Rakesh Sachdev | Director | February 18, 2022 | ||||||||||||
| Rakesh Sachdev | ||||||||||||||
| /s/ Samuel L. Smolik | Director | February 18, 2022 | ||||||||||||
| Samuel L. Smolik | ||||||||||||||
111