EX-99.2
Published on April 25, 2022
1 Q1 2022 Financial Results April 25, 2022 Exhibit 99.2
2 Legal Notices Forward-Looking Statements This presentation and the oral remarks made in connection herewith may contain certain forward-looking statements within the meaning of the U.S. Private Securities Litigation Reform Act of 1995 regarding Axalta and its subsidiaries including our outlook and/ or guidance, which includes net sales growth, currency effects, acquisition or divestment impacts, Adjusted EBIT, Adjusted diluted EPS, interest expense, income tax rate, as adjusted, free cash flow, capital expenditures, depreciation and amortization, diluted shares outstanding, raw material inflation and various assumptions noted in the presentation, the effects of COVID-19 on Axalta’s business and financial results, our and our customers’ supply chain constraints and our ability to offset the impacts of such constraints, the timing or amount of any future share repurchases, contributions from our prior acquisitions and our ability to make future acquisitions. Axalta has identified some of these forward-looking statements with words “believe,” “expect,” “assume,” “estimation,” “likely,” “outlook,” “forecast,” “may,” “will,” “should,” “plans,” “guidance,” “to be,” “goal,” “could,” “anticipate,” “assumptions,” “looking ahead,” “look,” “ambition,” “view,” “assessment,” ”towards,” ”can,” ”future,” ”estimate,” ”eventually,” ”commitment,” ”we will see,” ”project,” ”projection” and “we see” and the negative of these words or other comparable or similar terminology. All of these statements are based on management’s expectations as well as estimates and assumptions prepared by management that, although they believe to be reasonable, are inherently uncertain. These statements involve risks and uncertainties, including, but not limited to, economic, competitive, governmental and technological factors outside of Axalta’s control, including the effects of COVID-19, that may cause its business, industry, strategy, financing activities or actual results to differ materially. The impact and duration of COVID-19 on our business and operations is uncertain. Factors that will influence the impact on our business and operations include the duration and extent of COVID-19, the extent of imposed or recommended containment and mitigation measures, and the general economic consequences of COVID-19. More information on potential factors that could affect Axalta's financial results is available in “Forward-Looking Statements,” “Risk Factors” and “Management's Discussion and Analysis of Financial Condition and Results of Operations” within Axalta's most recent Annual Report on Form 10-K, and in other documents that we have filed with, or furnished to, the U.S. Securities and Exchange Commission. Axalta undertakes no obligation to update or revise any of the forward-looking statements contained herein, whether as a result of new information, future events or otherwise. Non-GAAP Financial Measures The historical financial information included in this presentation includes financial information that is not presented in accordance with generally accepted accounting principles in the United States (“GAAP”), including constant currency net sales growth, income tax rate, as adjusted, EBIT, Adjusted EBIT, EBITDA, Adjusted EBITDA, Adjusted diluted EPS, free cash flow, net debt, Adjusted net income, Adjusted EBITDA to interest expense coverage ratio, Adjusted EBIT margin and net leverage. Management uses these non-GAAP financial measures in the analysis of our financial and operating performance because they assist in the evaluation of underlying trends in our business. Adjusted EBITDA, Adjusted EBIT and Adjusted diluted EPS consist of EBITDA, EBIT and Diluted EPS, respectively, adjusted for (i) certain non-cash items included within net income, (ii) certain items Axalta does not believe are indicative of ongoing operating performance or (iii) certain nonrecurring, unusual or infrequent items that have not occurred within the last two years or we believe are not reasonably likely to recur within the next two years. We believe that making such adjustments provides investors meaningful information to understand our operating results and ability to analyze financial and business trends on a period-to-period basis. Adjusted net income shows the adjusted value of net income (loss) attributable to controlling interests after removing the items that are determined by management to be items that we do not consider indicative of our ongoing operating performance or unusual or nonrecurring in nature. Our use of the terms constant currency net sales growth, income tax rate, as adjusted, EBIT, Adjusted EBIT, EBITDA, Adjusted EBITDA, Adjusted diluted EPS, free cash flow, net debt, Adjusted net income, Adjusted EBITDA to interest expense coverage ratio, Adjusted EBIT margin and net leverage may differ from that of others in our industry. Constant currency net sales growth, income tax rate, as adjusted, EBIT, Adjusted EBIT, EBITDA, Adjusted EBITDA, Adjusted diluted EPS, free cash flow, net debt, Adjusted net income, Adjusted EBITDA to interest expense coverage ratio, Adjusted EBIT margin and net leverage should not be considered as alternatives to net sales, net income, income before operations or any other performance measures derived in accordance with GAAP as measures of operating performance or operating cash flows or as measures of liquidity. Constant currency net sales growth, income tax rate, as adjusted, EBIT, Adjusted EBIT, EBITDA, Adjusted EBITDA, Adjusted diluted EPS, free cash flow, net debt, Adjusted net income, Adjusted EBITDA to interest expense coverage ratio, Adjusted EBIT margin and net leverage have important limitations as analytical tools and should be considered in conjunction with, and not as substitutes for, our results as reported under GAAP. This presentation includes a reconciliation of certain non-GAAP financial measures with the most directly comparable financial measures calculated in accordance with GAAP. Axalta does not provide a reconciliation for non-GAAP estimates for constant currency net sales growth, Adjusted EBIT, Adjusted EBITDA, Adjusted diluted EPS, income tax rate, as adjusted, or free cash flow on a forward-looking basis because the information necessary to calculate a meaningful or accurate estimation of reconciling items is not available without unreasonable effort. For example, such reconciling items include the impact of foreign currency exchange gains or losses, gains or losses that are unusual or nonrecurring in nature, as well as discrete taxable events. We cannot estimate or project these items and they may have a substantial and unpredictable impact on our US GAAP results. Constant Currency Constant currency or ex-FX percentages are calculated by excluding the impact the change in average exchange rates between the current and comparable period by currency denomination exposure of the comparable period amount. Organic Growth Organic growth or ex-M&A percentages are calculated by excluding the impact of recent acquisitions and divestitures. Segment Financial Measures The primary measure of segment operating performance is Adjusted EBIT, which is a key metric that is used by management to evaluate business performance in comparison to budgets, forecasts and prior year financial results, providing a measure that management believes reflects Axalta’s core operating performance. As we do not measure segment operating performance based on net income, a reconciliation of this non-GAAP financial measure with the most directly comparable financial measure calculated in accordance with GAAP is not available. Defined Terms All capitalized terms contained within this presentation have been previously defined in our filings with the United States Securities and Exchange Commission. Rounding Due to rounding the tables presented may not foot.
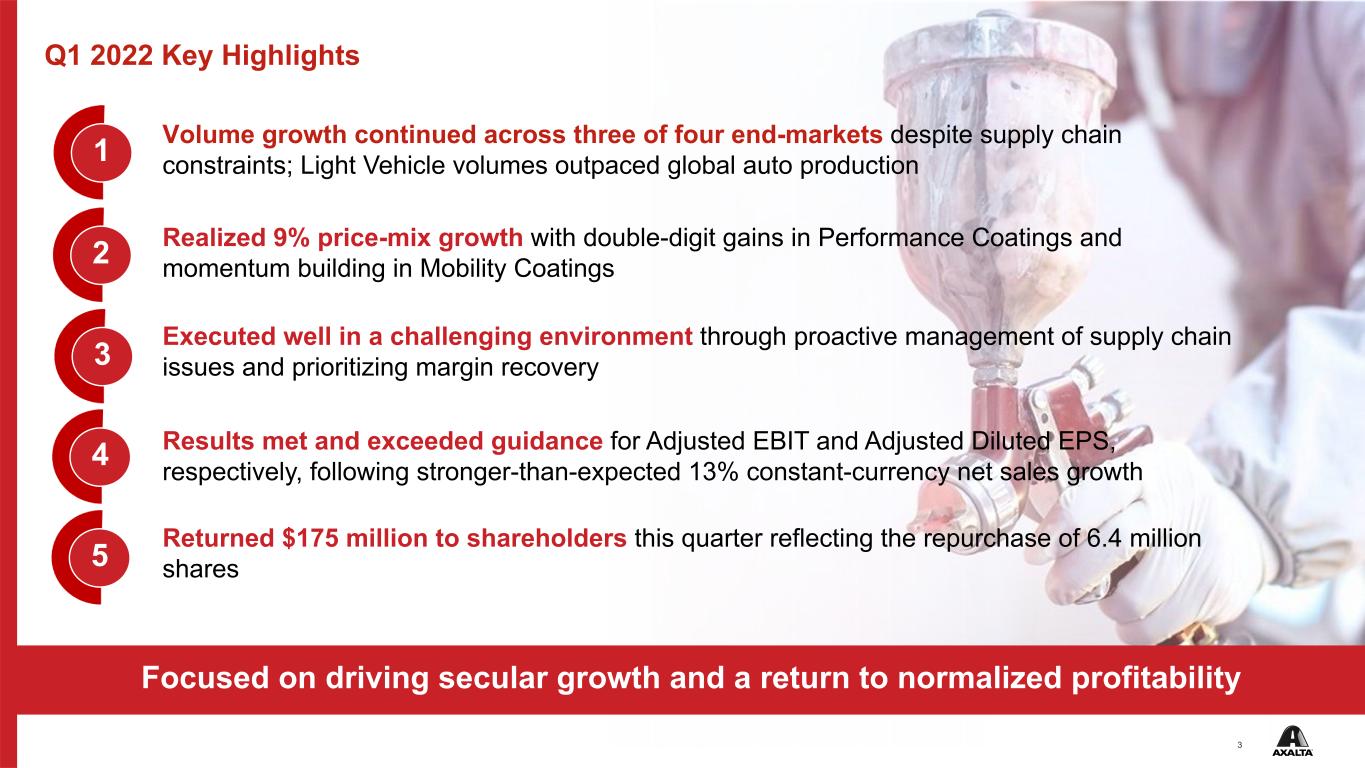
3 Q1 2022 Key Highlights Focused on driving secular growth and a return to normalized profitability Volume growth continued across three of four end-markets despite supply chain constraints; Light Vehicle volumes outpaced global auto production Realized 9% price-mix growth with double-digit gains in Performance Coatings and momentum building in Mobility Coatings 1 2 3 4 5 Results met and exceeded guidance for Adjusted EBIT and Adjusted Diluted EPS, respectively, following stronger-than-expected 13% constant-currency net sales growth Executed well in a challenging environment through proactive management of supply chain issues and prioritizing margin recovery Returned $175 million to shareholders this quarter reflecting the repurchase of 6.4 million shares
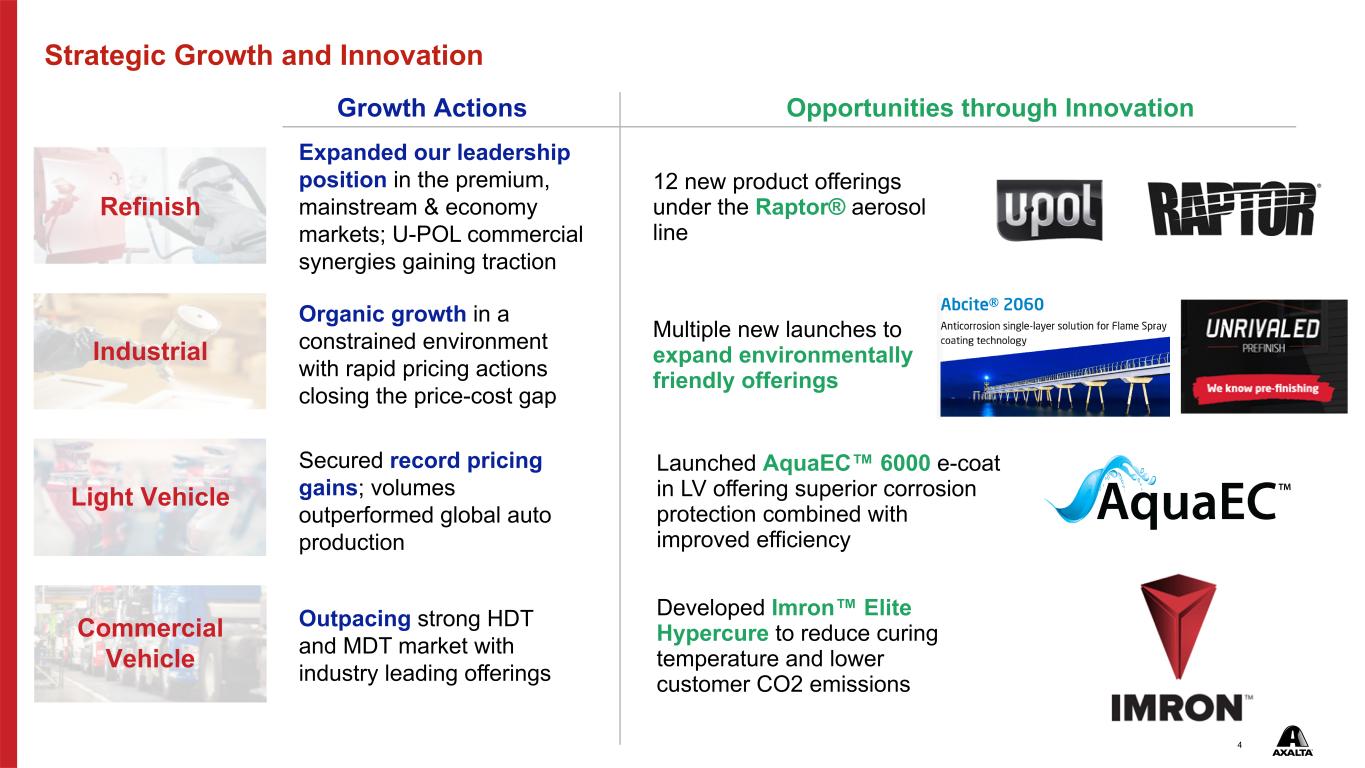
4 Strategic Growth and Innovation Refinish Growth Actions Expanded our leadership position in the premium, mainstream & economy markets; U-POL commercial synergies gaining traction Organic growth in a constrained environment with rapid pricing actions closing the price-cost gap Outpacing strong HDT and MDT market with industry leading offerings Industrial Light Vehicle Commercial Vehicle Multiple new launches to expand environmentally friendly offerings 12 new product offerings under the Raptor® aerosol line Opportunities through Innovation Launched AquaEC™ 6000 e-coat in LV offering superior corrosion protection combined with improved efficiency Secured record pricing gains; volumes outperformed global auto production Developed Imron™ Elite Hypercure to reduce curing temperature and lower customer CO2 emissions
5 Performance Coatings Demand Environment Refinish ▪ The global refinish market showed overall stability with only modest headwinds to our business from ongoing China COVID-19 lockdowns and Russia sanction impacts – U.S. miles driven have nearly recovered to pre-pandemic 2019 levels; Refinish body shop activity improved month-by-month during Q1 ending with a strong March; body shop activity remains in the mid-80s% relative to 2019 – Monitoring favorable changes in US office occupancy rates as a potential indicator of market recovery activity – Europe miles driven softened slightly from Q4 though remained above 2019 levels; body shop activity stayed in the low-90s% relative to 2019 – Body shop activity is being constrained by labor and parts availability creating a growing backlog Industrial ▪ US housing and remodeling market remains healthy; construction markets show continued YOY growth ▪ New electric vehicle market remains strong; new projects beginning to ramp up in oil and gas market ▪ Supply chain constraints hindered further sales upside in Q1 in Building Products and General Industrial; regional growth impacted by COVID-19 restrictions, consequences of the Russia-Ukraine conflict and severe weather in Asia Pacific
6 Mobility Coatings Demand Environment Light Vehicle ▪ Light Vehicle market recovery continues to be constrained by the semiconductor chip shortage – Light Vehicle volume declined 3.5% year-over-year but exceeded global auto production rates, which declined 4.5% to 19.7 million in Q1 2022 – On a sequential basis, Light Vehicle volume grew 6.7% vs. a global production decline of 6.8% – Axalta expects global LV builds of approximately 19 million and 80 million for Q2 and full-year 2022, respectively – The expected normalization of global auto production rates in 2022 has been impacted by the Russia-Ukraine conflict and China COVID-19 lockdowns with downward revisions of earlier-year estimates – Global auto inventory levels at historic lows; remain well-below pre- pandemic levels supporting multi-year demand recovery Commercial Vehicle ▪ North America and EMEA truck markets remain very healthy – Americas and Western Europe heavy-duty and medium-duty truck order backlog is 11-months and 8-months, respectively, reflecting historically strong demand in a challenging supply chain environment – Commercial Vehicle growth of 3.7% outperformed ex-China Global CV production, which increased 0.8% YOY in Q1; industry forecasts project 4.2% annual global growth in 2022, excluding China
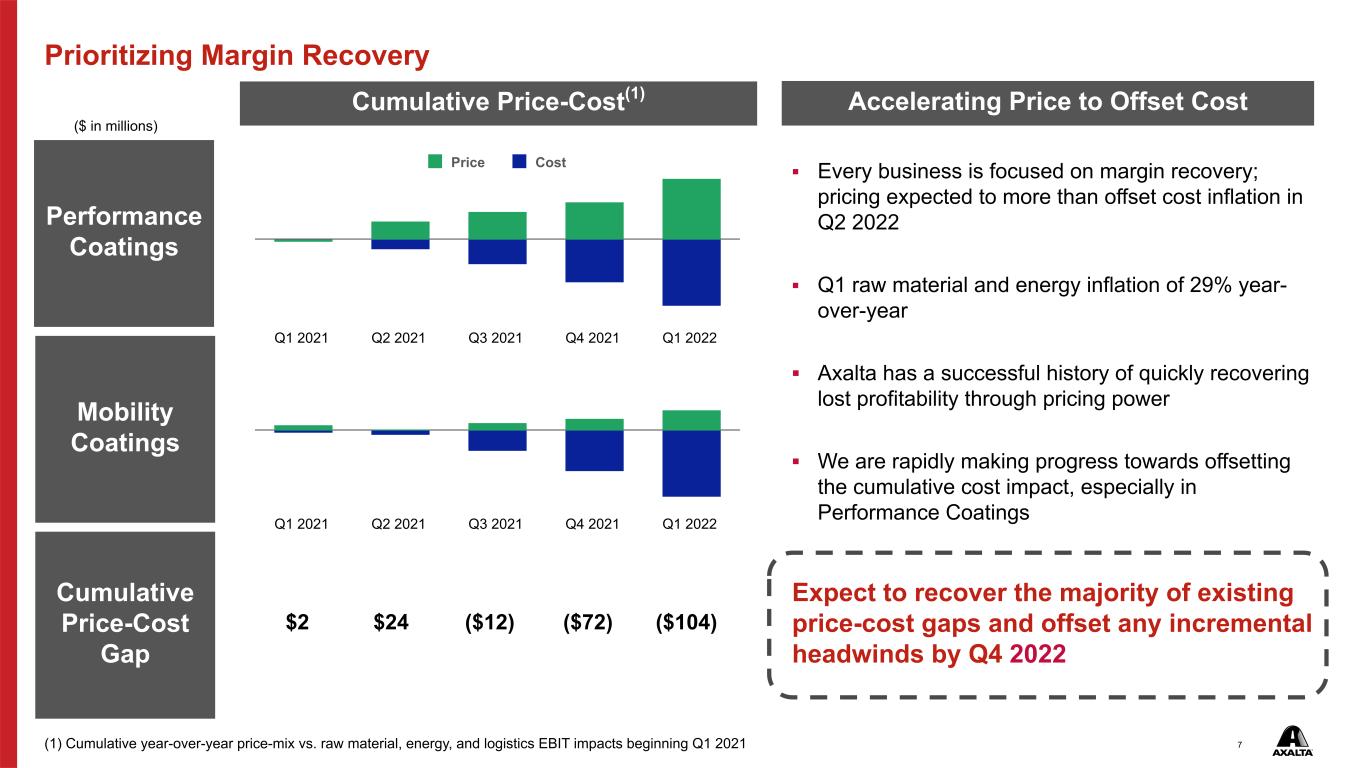
7 Price Cost Prioritizing Margin Recovery Cumulative Price-Cost(1) Performance Coatings Mobility Coatings Cumulative Price-Cost Gap ($ in millions) (1) Cumulative year-over-year price-mix vs. raw material, energy, and logistics EBIT impacts beginning Q1 2021 Accelerating Price to Offset Cost ▪ Every business is focused on margin recovery; pricing expected to more than offset cost inflation in Q2 2022 ▪ Q1 raw material and energy inflation of 29% year- over-year ▪ Axalta has a successful history of quickly recovering lost profitability through pricing power ▪ We are rapidly making progress towards offsetting the cumulative cost impact, especially in Performance Coatings Expect to recover the majority of existing price-cost gaps and offset any incremental headwinds by Q4 2022 $2 $24 ($12) ($72) ($104) Q1 2021 Q2 2021 Q3 2021 Q4 2021 Q1 2022 Q1 2021 Q2 2021 Q3 2021 Q4 2021 Q1 2022
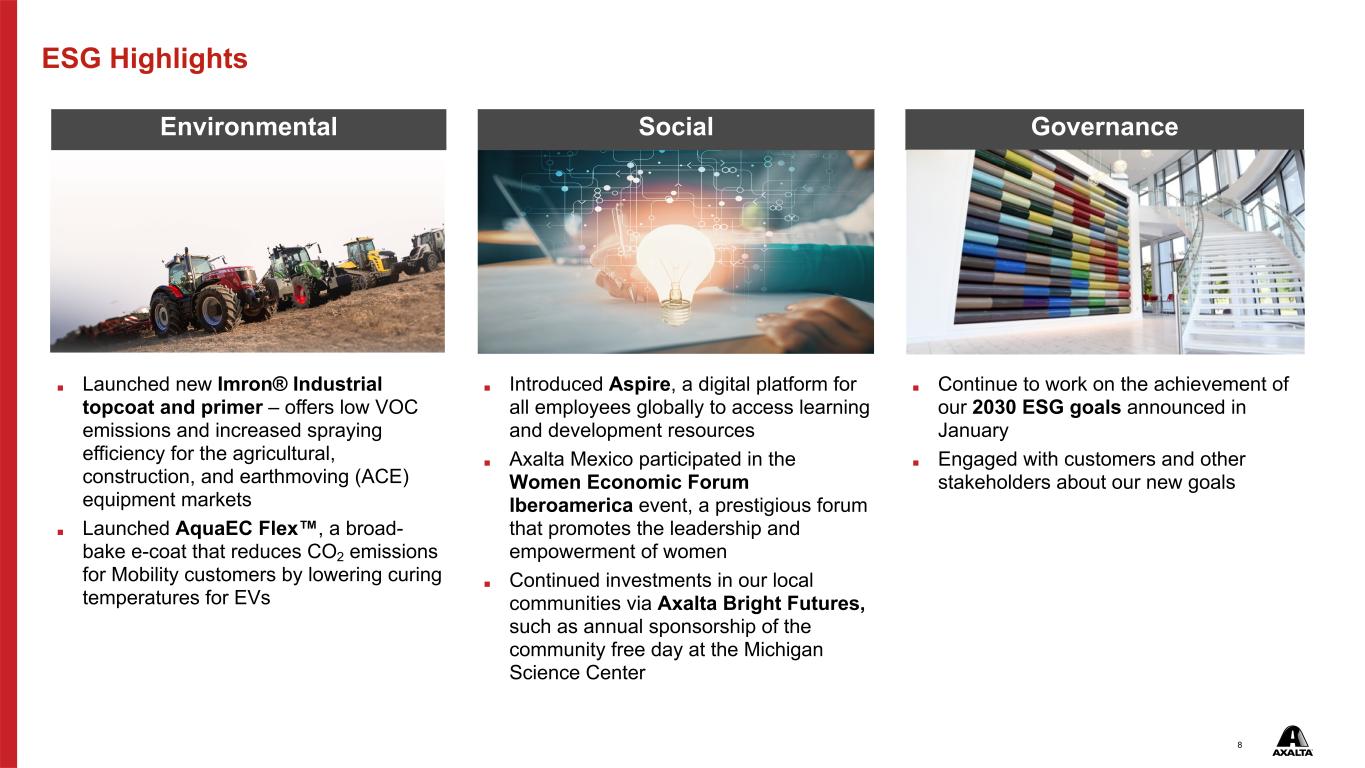
8 ESG Highlights ■ Launched new Imron® Industrial topcoat and primer – offers low VOC emissions and increased spraying efficiency for the agricultural, construction, and earthmoving (ACE) equipment markets ■ Launched AquaEC Flex™, a broad- bake e-coat that reduces CO2 emissions for Mobility customers by lowering curing temperatures for EVs ■ Introduced Aspire, a digital platform for all employees globally to access learning and development resources ■ Axalta Mexico participated in the Women Economic Forum Iberoamerica event, a prestigious forum that promotes the leadership and empowerment of women ■ Continued investments in our local communities via Axalta Bright Futures, such as annual sponsorship of the community free day at the Michigan Science Center ■ Continue to work on the achievement of our 2030 ESG goals announced in January ■ Engaged with customers and other stakeholders about our new goals Environmental Social Governance
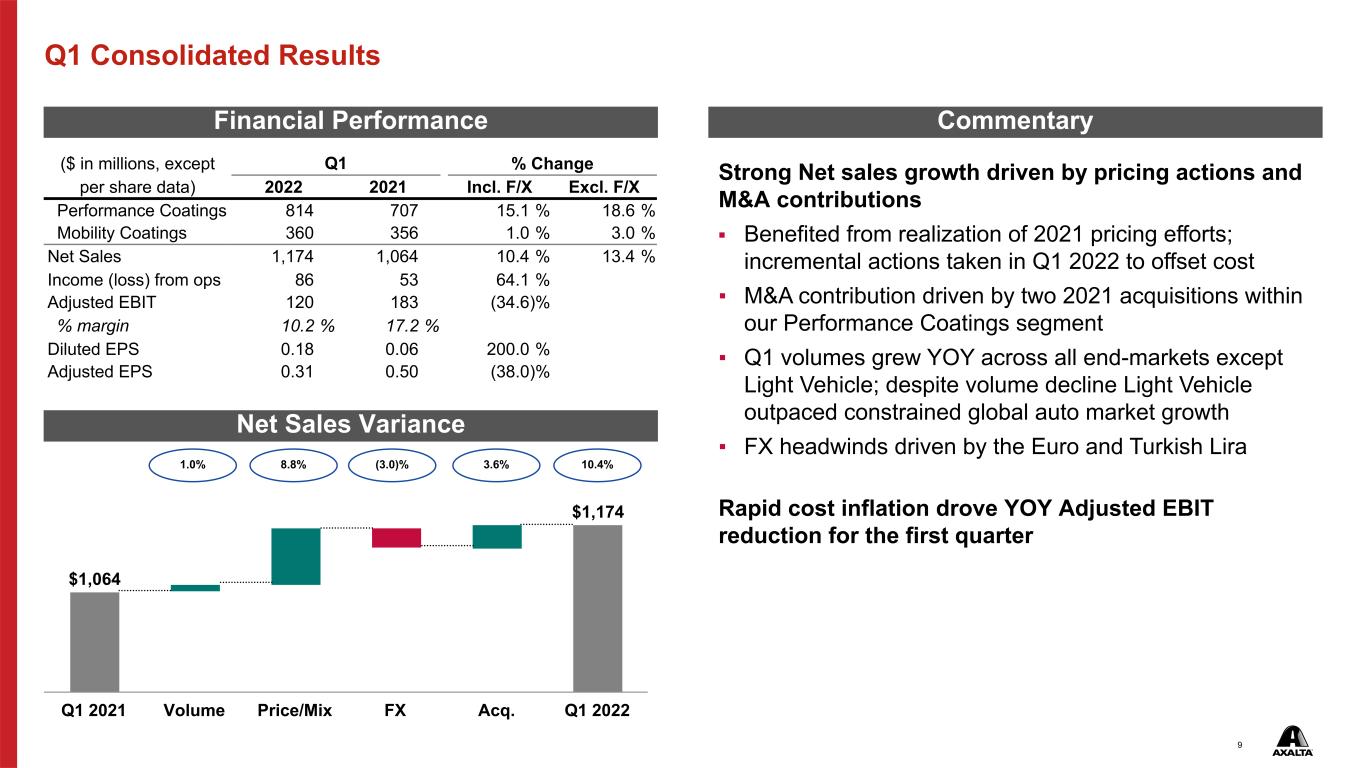
9 $1,064 $1,174 Q1 2021 Volume Price/Mix FX Acq. Q1 2022 Q1 Consolidated Results Financial Performance Commentary Net Sales Variance Strong Net sales growth driven by pricing actions and M&A contributions ▪ Benefited from realization of 2021 pricing efforts; incremental actions taken in Q1 2022 to offset cost ▪ M&A contribution driven by two 2021 acquisitions within our Performance Coatings segment ▪ Q1 volumes grew YOY across all end-markets except Light Vehicle; despite volume decline Light Vehicle outpaced constrained global auto market growth ▪ FX headwinds driven by the Euro and Turkish Lira Rapid cost inflation drove YOY Adjusted EBIT reduction for the first quarter ($ in millions, except Q1 % Change per share data) 2022 2021 Incl. F/X Excl. F/X Performance Coatings 814 707 15.1 % 18.6 % Mobility Coatings 360 356 1.0 % 3.0 % Net Sales 1,174 1,064 10.4 % 13.4 % Income (loss) from ops 86 53 64.1 % Adjusted EBIT 120 183 (34.6) % % margin 10.2 % 17.2 % Diluted EPS 0.18 0.06 200.0 % Adjusted EPS 0.31 0.50 (38.0) % 1.0% 8.8% (3.0)% 10.4% 3.6%
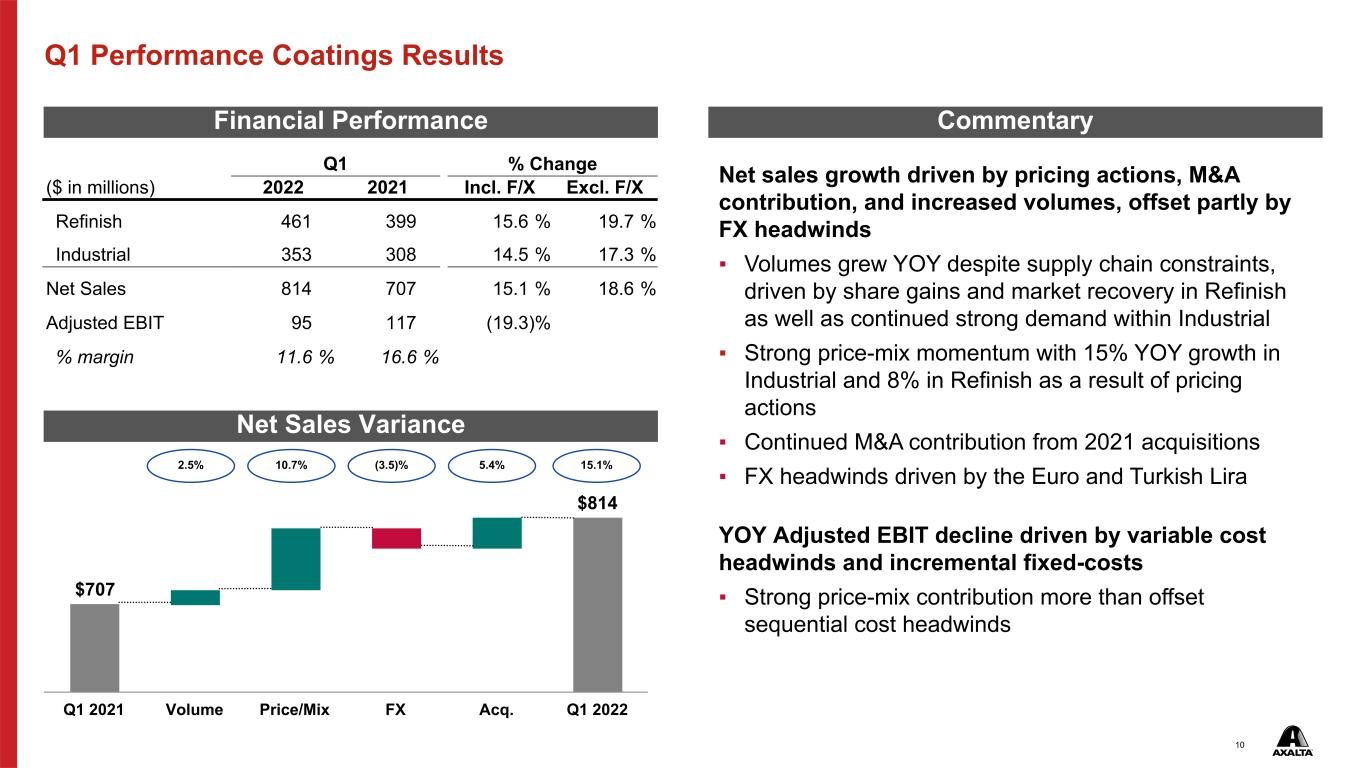
10 $707 $814 Q1 2021 Volume Price/Mix FX Acq. Q1 2022 Q1 Performance Coatings Results Q1 % Change ($ in millions) 2022 2021 Incl. F/X Excl. F/X Refinish 461 399 15.6 % 19.7 % Industrial 353 308 14.5 % 17.3 % Net Sales 814 707 15.1 % 18.6 % Adjusted EBIT 95 117 (19.3) % % margin 11.6 % 16.6 % 2.5% 10.7% (3.5)% 15.1% CommentaryFinancial Performance Net Sales Variance Net sales growth driven by pricing actions, M&A contribution, and increased volumes, offset partly by FX headwinds ▪ Volumes grew YOY despite supply chain constraints, driven by share gains and market recovery in Refinish as well as continued strong demand within Industrial ▪ Strong price-mix momentum with 15% YOY growth in Industrial and 8% in Refinish as a result of pricing actions ▪ Continued M&A contribution from 2021 acquisitions ▪ FX headwinds driven by the Euro and Turkish Lira YOY Adjusted EBIT decline driven by variable cost headwinds and incremental fixed-costs ▪ Strong price-mix contribution more than offset sequential cost headwinds 5.4%
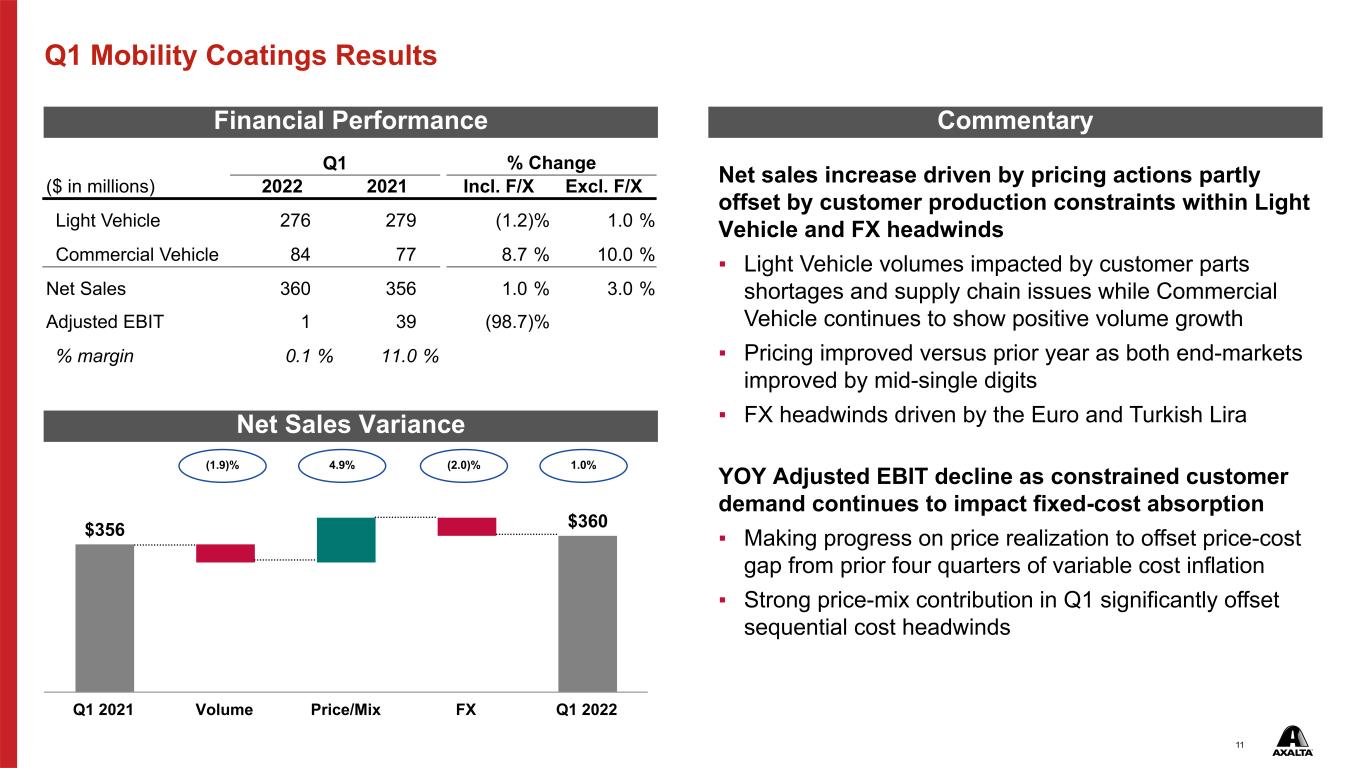
11 $356 $360 Q1 2021 Volume Price/Mix FX Q1 2022 Q1 Mobility Coatings Results Q1 % Change ($ in millions) 2022 2021 Incl. F/X Excl. F/X Light Vehicle 276 279 (1.2) % 1.0 % Commercial Vehicle 84 77 8.7 % 10.0 % Net Sales 360 356 1.0 % 3.0 % Adjusted EBIT 1 39 (98.7) % % margin 0.1 % 11.0 % (1.9)% 4.9% (2.0)% 1.0% Financial Performance Commentary Net Sales Variance Net sales increase driven by pricing actions partly offset by customer production constraints within Light Vehicle and FX headwinds ▪ Light Vehicle volumes impacted by customer parts shortages and supply chain issues while Commercial Vehicle continues to show positive volume growth ▪ Pricing improved versus prior year as both end-markets improved by mid-single digits ▪ FX headwinds driven by the Euro and Turkish Lira YOY Adjusted EBIT decline as constrained customer demand continues to impact fixed-cost absorption ▪ Making progress on price realization to offset price-cost gap from prior four quarters of variable cost inflation ▪ Strong price-mix contribution in Q1 significantly offset sequential cost headwinds
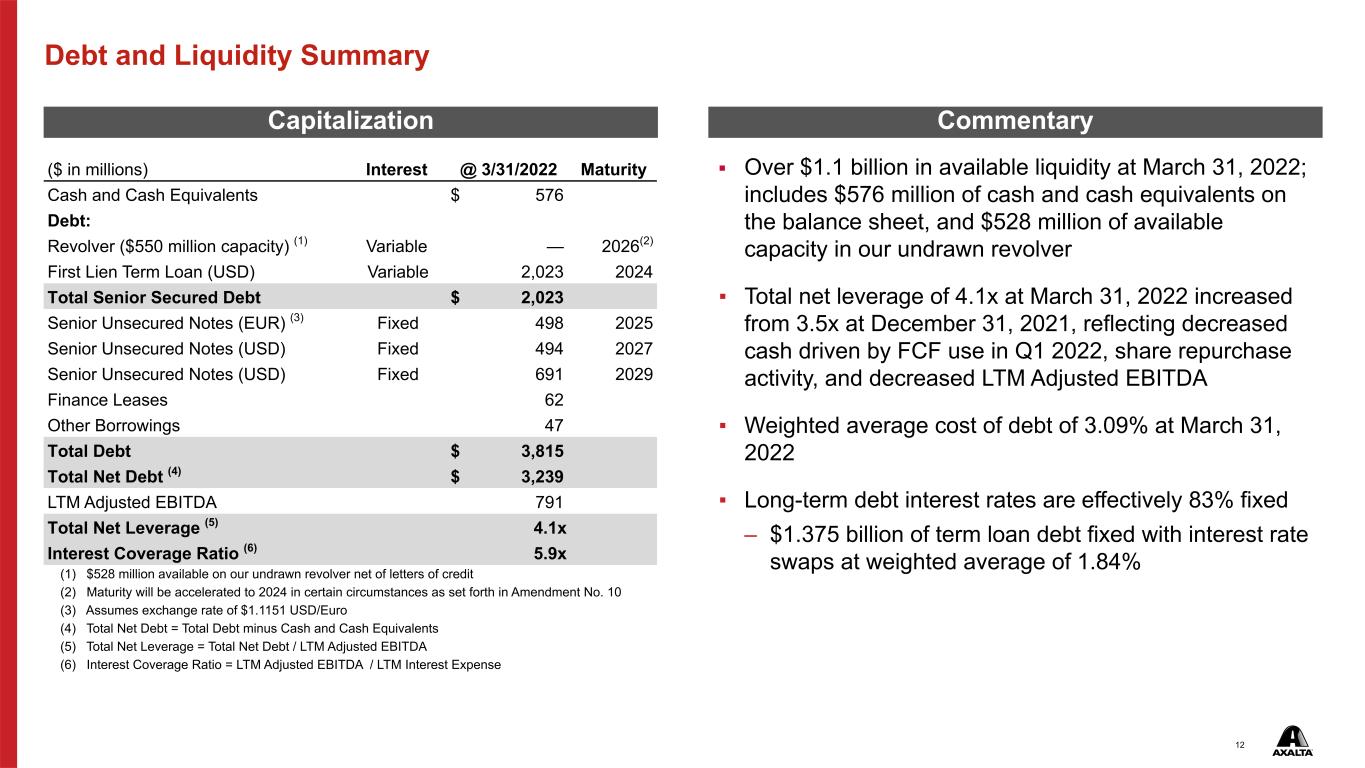
12 Debt and Liquidity Summary ($ in millions) Interest @ 3/31/2022 Maturity Cash and Cash Equivalents $ 576 Debt: Revolver ($550 million capacity) (1) Variable — 2026(2) First Lien Term Loan (USD) Variable 2,023 2024 Total Senior Secured Debt $ 2,023 Senior Unsecured Notes (EUR) (3) Fixed 498 2025 Senior Unsecured Notes (USD) Fixed 494 2027 Senior Unsecured Notes (USD) Fixed 691 2029 Finance Leases 62 Other Borrowings 47 Total Debt $ 3,815 Total Net Debt (4) $ 3,239 LTM Adjusted EBITDA 791 Total Net Leverage (5) 4.1x Interest Coverage Ratio (6) 5.9x (1) $528 million available on our undrawn revolver net of letters of credit (2) Maturity will be accelerated to 2024 in certain circumstances as set forth in Amendment No. 10 (3) Assumes exchange rate of $1.1151 USD/Euro (4) Total Net Debt = Total Debt minus Cash and Cash Equivalents (5) Total Net Leverage = Total Net Debt / LTM Adjusted EBITDA (6) Interest Coverage Ratio = LTM Adjusted EBITDA / LTM Interest Expense Capitalization Commentary ▪ Over $1.1 billion in available liquidity at March 31, 2022; includes $576 million of cash and cash equivalents on the balance sheet, and $528 million of available capacity in our undrawn revolver ▪ Total net leverage of 4.1x at March 31, 2022 increased from 3.5x at December 31, 2021, reflecting decreased cash driven by FCF use in Q1 2022, share repurchase activity, and decreased LTM Adjusted EBITDA ▪ Weighted average cost of debt of 3.09% at March 31, 2022 ▪ Long-term debt interest rates are effectively 83% fixed – $1.375 billion of term loan debt fixed with interest rate swaps at weighted average of 1.84%
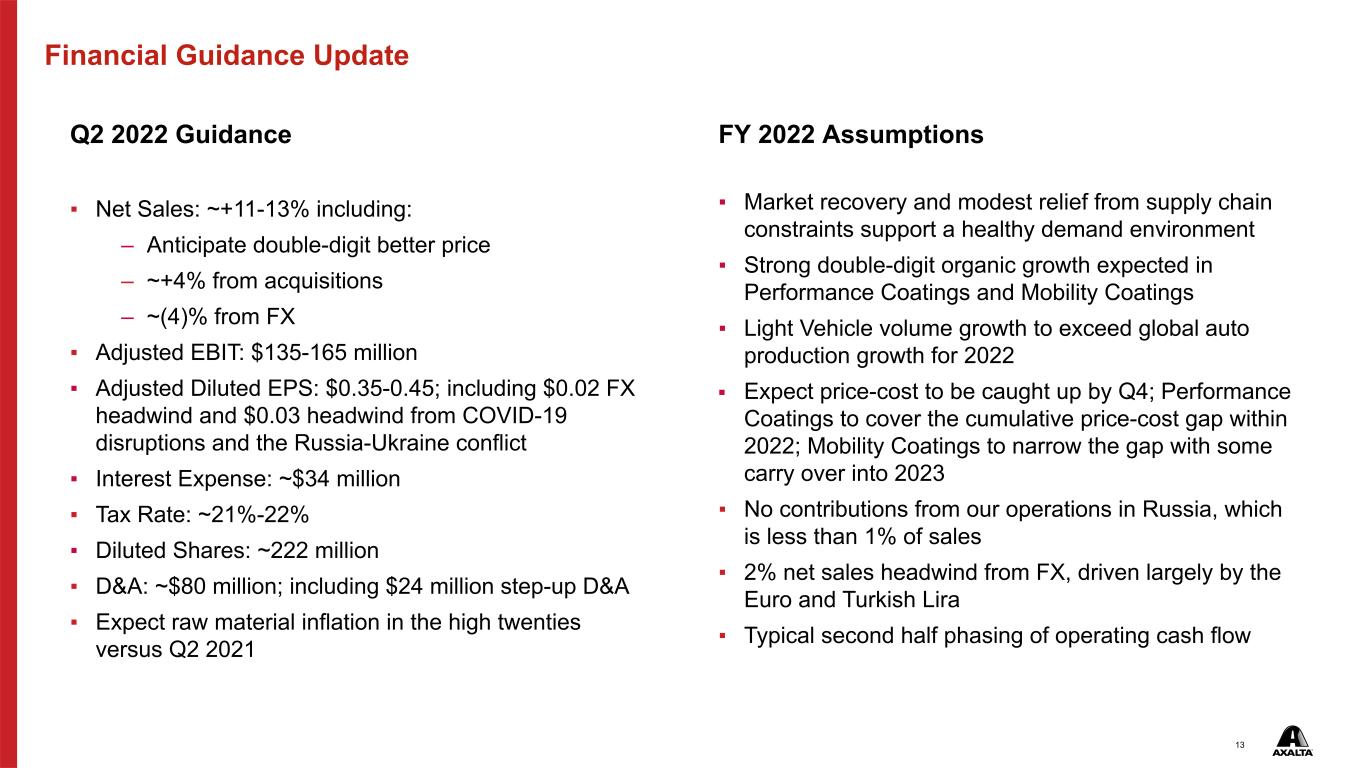
13 Financial Guidance Update Q2 2022 Guidance ▪ Net Sales: ~+11-13% including: – Anticipate double-digit better price – ~+4% from acquisitions – ~(4)% from FX ▪ Adjusted EBIT: $135-165 million ▪ Adjusted Diluted EPS: $0.35-0.45; including $0.02 FX headwind and $0.03 headwind from COVID-19 disruptions and the Russia-Ukraine conflict ▪ Interest Expense: ~$34 million ▪ Tax Rate: ~21%-22% ▪ Diluted Shares: ~222 million ▪ D&A: ~$80 million; including $24 million step-up D&A ▪ Expect raw material inflation in the high twenties versus Q2 2021 FY 2022 Assumptions ▪ Market recovery and modest relief from supply chain constraints support a healthy demand environment ▪ Strong double-digit organic growth expected in Performance Coatings and Mobility Coatings ▪ Light Vehicle volume growth to exceed global auto production growth for 2022 ▪ Expect price-cost to be caught up by Q4; Performance Coatings to cover the cumulative price-cost gap within 2022; Mobility Coatings to narrow the gap with some carry over into 2023 ▪ No contributions from our operations in Russia, which is less than 1% of sales ▪ 2% net sales headwind from FX, driven largely by the Euro and Turkish Lira ▪ Typical second half phasing of operating cash flow
14 Appendix
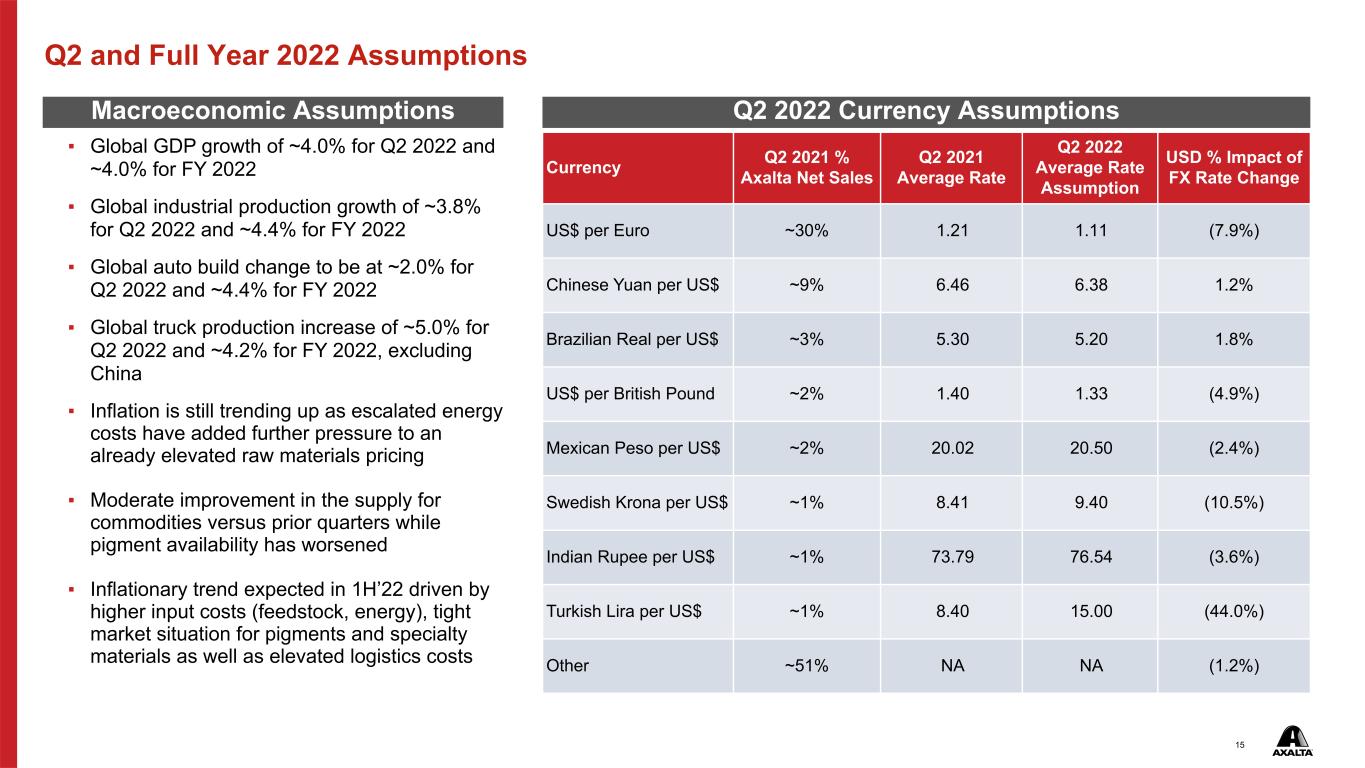
15 Q2 and Full Year 2022 Assumptions Q2 2022 Currency AssumptionsMacroeconomic Assumptions ▪ Global GDP growth of ~4.0% for Q2 2022 and ~4.0% for FY 2022 ▪ Global industrial production growth of ~3.8% for Q2 2022 and ~4.4% for FY 2022 ▪ Global auto build change to be at ~2.0% for Q2 2022 and ~4.4% for FY 2022 ▪ Global truck production increase of ~5.0% for Q2 2022 and ~4.2% for FY 2022, excluding China ▪ Inflation is still trending up as escalated energy costs have added further pressure to an already elevated raw materials pricing ▪ Moderate improvement in the supply for commodities versus prior quarters while pigment availability has worsened ▪ Inflationary trend expected in 1H’22 driven by higher input costs (feedstock, energy), tight market situation for pigments and specialty materials as well as elevated logistics costs Currency Q2 2021 % Axalta Net Sales Q2 2021 Average Rate Q2 2022 Average Rate Assumption USD % Impact of FX Rate Change US$ per Euro ~30% 1.21 1.11 (7.9%) Chinese Yuan per US$ ~9% 6.46 6.38 1.2% Brazilian Real per US$ ~3% 5.30 5.20 1.8% US$ per British Pound ~2% 1.40 1.33 (4.9%) Mexican Peso per US$ ~2% 20.02 20.50 (2.4%) Swedish Krona per US$ ~1% 8.41 9.40 (10.5%) Indian Rupee per US$ ~1% 73.79 76.54 (3.6%) Turkish Lira per US$ ~1% 8.40 15.00 (44.0%) Other ~51% NA NA (1.2%)
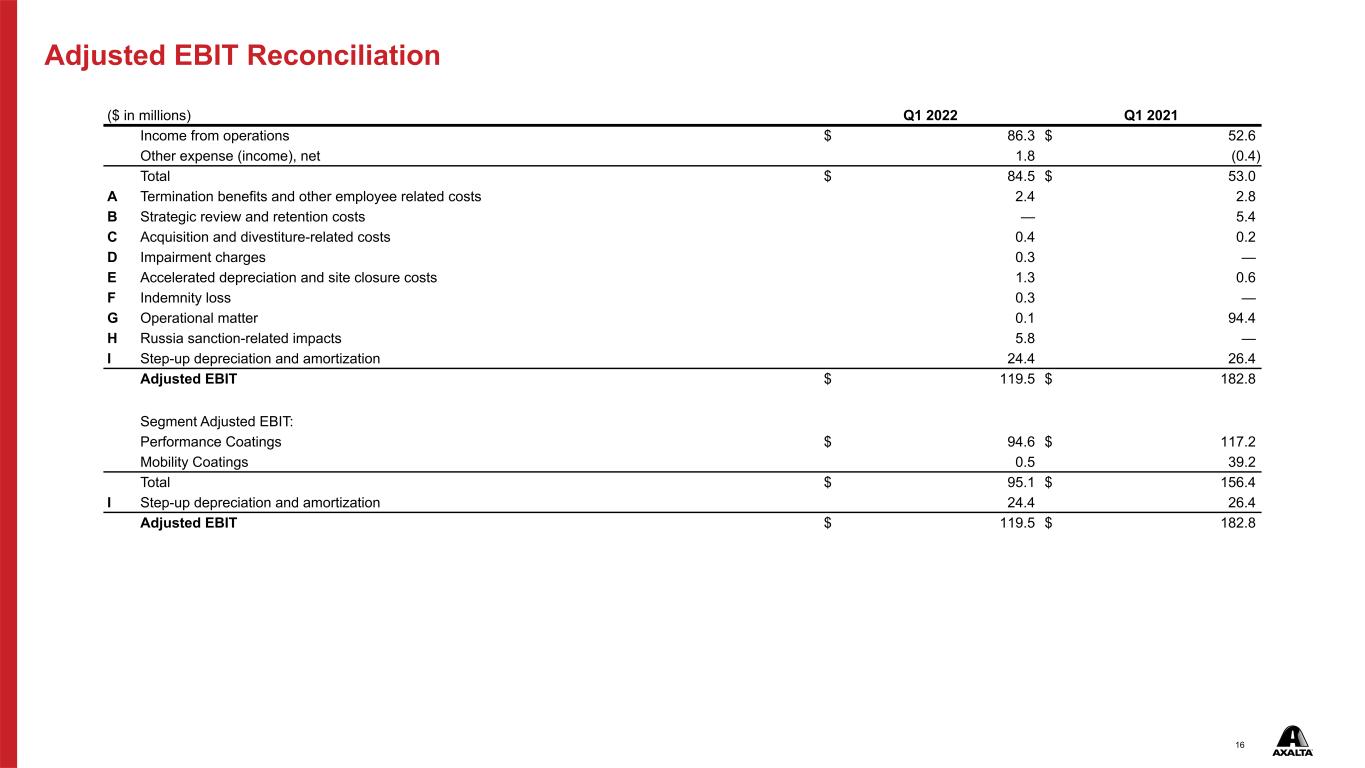
16 ($ in millions) Q1 2022 Q1 2021 Income from operations $ 86.3 $ 52.6 Other expense (income), net 1.8 (0.4) Total $ 84.5 $ 53.0 A Termination benefits and other employee related costs 2.4 2.8 B Strategic review and retention costs — 5.4 C Acquisition and divestiture-related costs 0.4 0.2 D Impairment charges 0.3 — E Accelerated depreciation and site closure costs 1.3 0.6 F Indemnity loss 0.3 — G Operational matter 0.1 94.4 H Russia sanction-related impacts 5.8 — I Step-up depreciation and amortization 24.4 26.4 Adjusted EBIT $ 119.5 $ 182.8 Segment Adjusted EBIT: Performance Coatings $ 94.6 $ 117.2 Mobility Coatings 0.5 39.2 Total $ 95.1 $ 156.4 I Step-up depreciation and amortization 24.4 26.4 Adjusted EBIT $ 119.5 $ 182.8 Adjusted EBIT Reconciliation
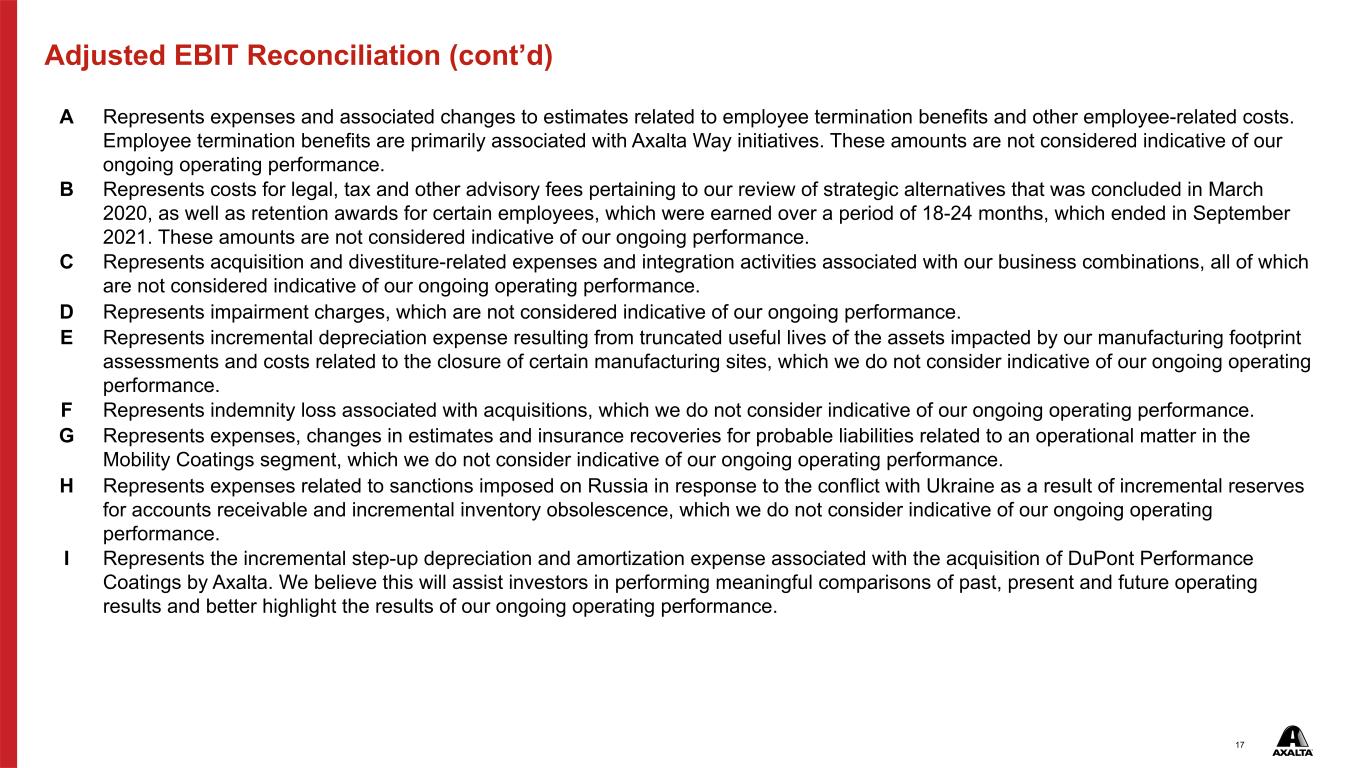
17 Adjusted EBIT Reconciliation (cont’d) A Represents expenses and associated changes to estimates related to employee termination benefits and other employee-related costs. Employee termination benefits are primarily associated with Axalta Way initiatives. These amounts are not considered indicative of our ongoing operating performance. B Represents costs for legal, tax and other advisory fees pertaining to our review of strategic alternatives that was concluded in March 2020, as well as retention awards for certain employees, which were earned over a period of 18-24 months, which ended in September 2021. These amounts are not considered indicative of our ongoing performance. C Represents acquisition and divestiture-related expenses and integration activities associated with our business combinations, all of which are not considered indicative of our ongoing operating performance. D Represents impairment charges, which are not considered indicative of our ongoing performance. E Represents incremental depreciation expense resulting from truncated useful lives of the assets impacted by our manufacturing footprint assessments and costs related to the closure of certain manufacturing sites, which we do not consider indicative of our ongoing operating performance. F Represents indemnity loss associated with acquisitions, which we do not consider indicative of our ongoing operating performance. G Represents expenses, changes in estimates and insurance recoveries for probable liabilities related to an operational matter in the Mobility Coatings segment, which we do not consider indicative of our ongoing operating performance. H Represents expenses related to sanctions imposed on Russia in response to the conflict with Ukraine as a result of incremental reserves for accounts receivable and incremental inventory obsolescence, which we do not consider indicative of our ongoing operating performance. I Represents the incremental step-up depreciation and amortization expense associated with the acquisition of DuPont Performance Coatings by Axalta. We believe this will assist investors in performing meaningful comparisons of past, present and future operating results and better highlight the results of our ongoing operating performance.
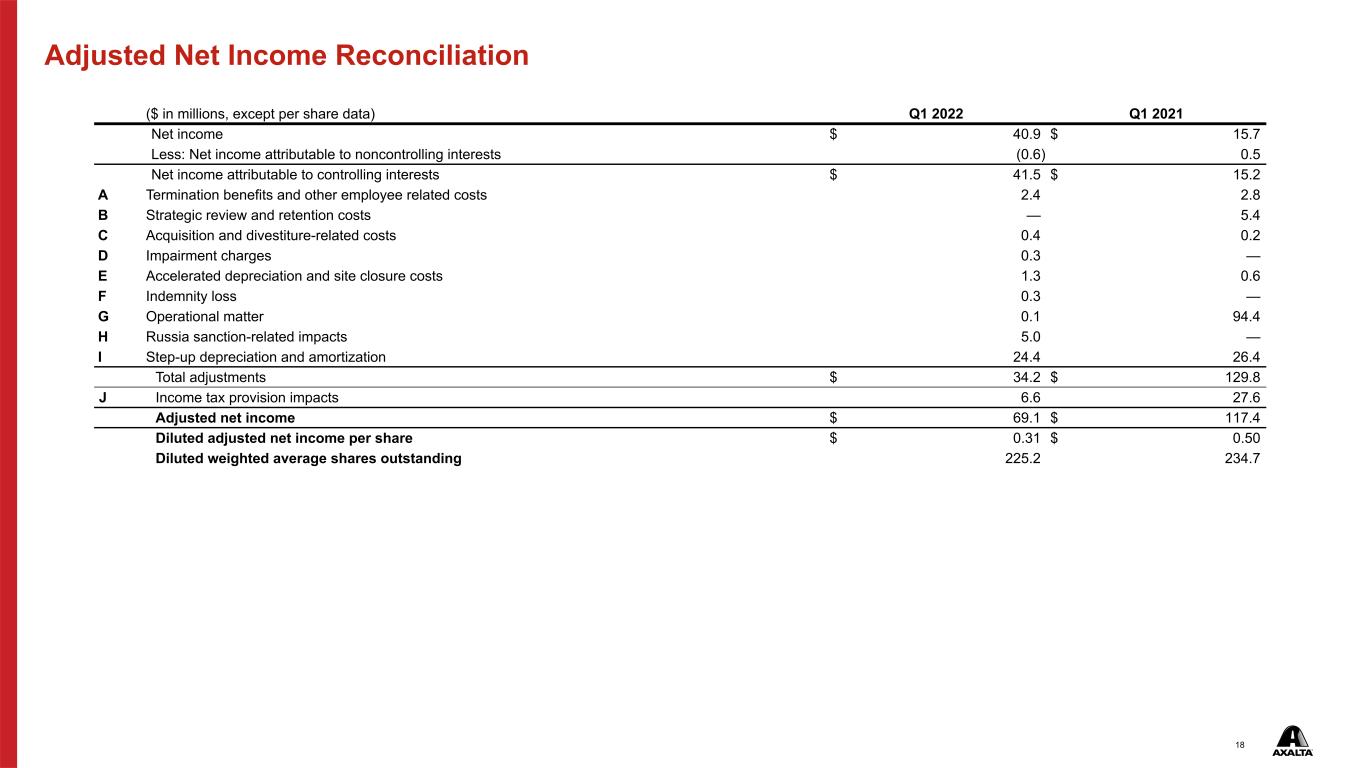
18 Adjusted Net Income Reconciliation ($ in millions, except per share data) Q1 2022 Q1 2021 Net income $ 40.9 $ 15.7 Less: Net income attributable to noncontrolling interests (0.6) 0.5 Net income attributable to controlling interests $ 41.5 $ 15.2 A Termination benefits and other employee related costs 2.4 2.8 B Strategic review and retention costs — 5.4 C Acquisition and divestiture-related costs 0.4 0.2 D Impairment charges 0.3 — E Accelerated depreciation and site closure costs 1.3 0.6 F Indemnity loss 0.3 — G Operational matter 0.1 94.4 H Russia sanction-related impacts 5.0 — I Step-up depreciation and amortization 24.4 26.4 Total adjustments $ 34.2 $ 129.8 J Income tax provision impacts 6.6 27.6 Adjusted net income $ 69.1 $ 117.4 Diluted adjusted net income per share $ 0.31 $ 0.50 Diluted weighted average shares outstanding 225.2 234.7
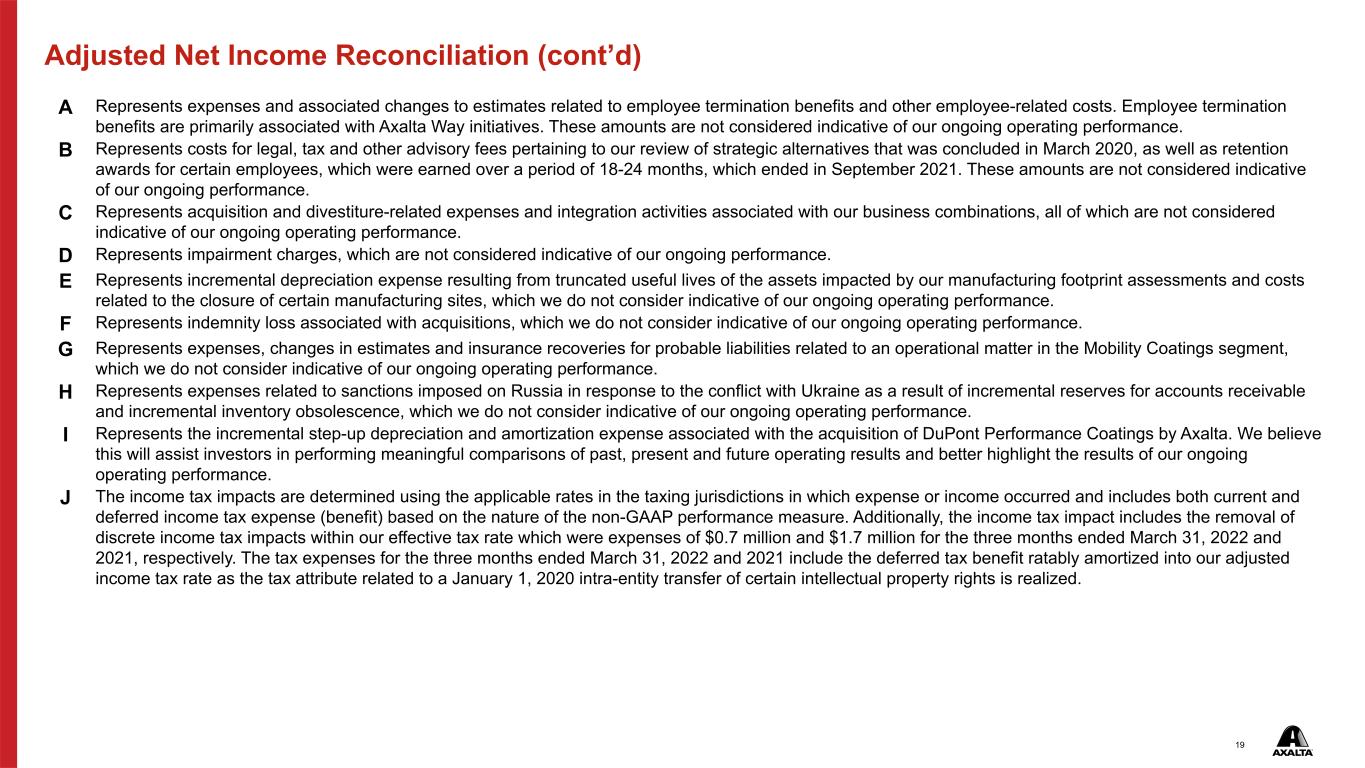
19 Adjusted Net Income Reconciliation (cont’d) A Represents expenses and associated changes to estimates related to employee termination benefits and other employee-related costs. Employee termination benefits are primarily associated with Axalta Way initiatives. These amounts are not considered indicative of our ongoing operating performance. B Represents costs for legal, tax and other advisory fees pertaining to our review of strategic alternatives that was concluded in March 2020, as well as retention awards for certain employees, which were earned over a period of 18-24 months, which ended in September 2021. These amounts are not considered indicative of our ongoing performance. C Represents acquisition and divestiture-related expenses and integration activities associated with our business combinations, all of which are not considered indicative of our ongoing operating performance. D Represents impairment charges, which are not considered indicative of our ongoing performance. E Represents incremental depreciation expense resulting from truncated useful lives of the assets impacted by our manufacturing footprint assessments and costs related to the closure of certain manufacturing sites, which we do not consider indicative of our ongoing operating performance. F Represents indemnity loss associated with acquisitions, which we do not consider indicative of our ongoing operating performance. G Represents expenses, changes in estimates and insurance recoveries for probable liabilities related to an operational matter in the Mobility Coatings segment, which we do not consider indicative of our ongoing operating performance. H Represents expenses related to sanctions imposed on Russia in response to the conflict with Ukraine as a result of incremental reserves for accounts receivable and incremental inventory obsolescence, which we do not consider indicative of our ongoing operating performance. I Represents the incremental step-up depreciation and amortization expense associated with the acquisition of DuPont Performance Coatings by Axalta. We believe this will assist investors in performing meaningful comparisons of past, present and future operating results and better highlight the results of our ongoing operating performance. J The income tax impacts are determined using the applicable rates in the taxing jurisdictions in which expense or income occurred and includes both current and deferred income tax expense (benefit) based on the nature of the non-GAAP performance measure. Additionally, the income tax impact includes the removal of discrete income tax impacts within our effective tax rate which were expenses of $0.7 million and $1.7 million for the three months ended March 31, 2022 and 2021, respectively. The tax expenses for the three months ended March 31, 2022 and 2021 include the deferred tax benefit ratably amortized into our adjusted income tax rate as the tax attribute related to a January 1, 2020 intra-entity transfer of certain intellectual property rights is realized.
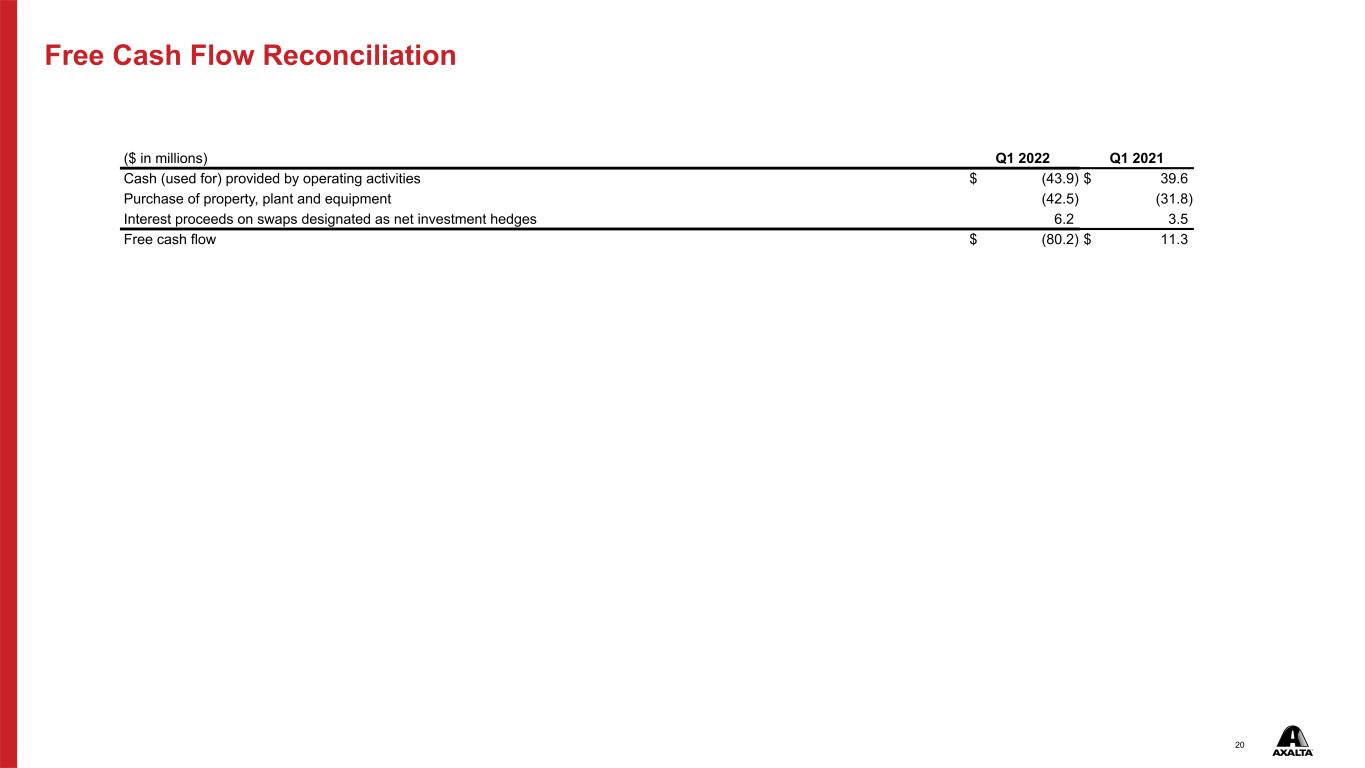
20 Free Cash Flow Reconciliation ($ in millions) Q1 2022 Q1 2021 Cash (used for) provided by operating activities $ (43.9) $ 39.6 Purchase of property, plant and equipment (42.5) (31.8) Interest proceeds on swaps designated as net investment hedges 6.2 3.5 Free cash flow $ (80.2) $ 11.3
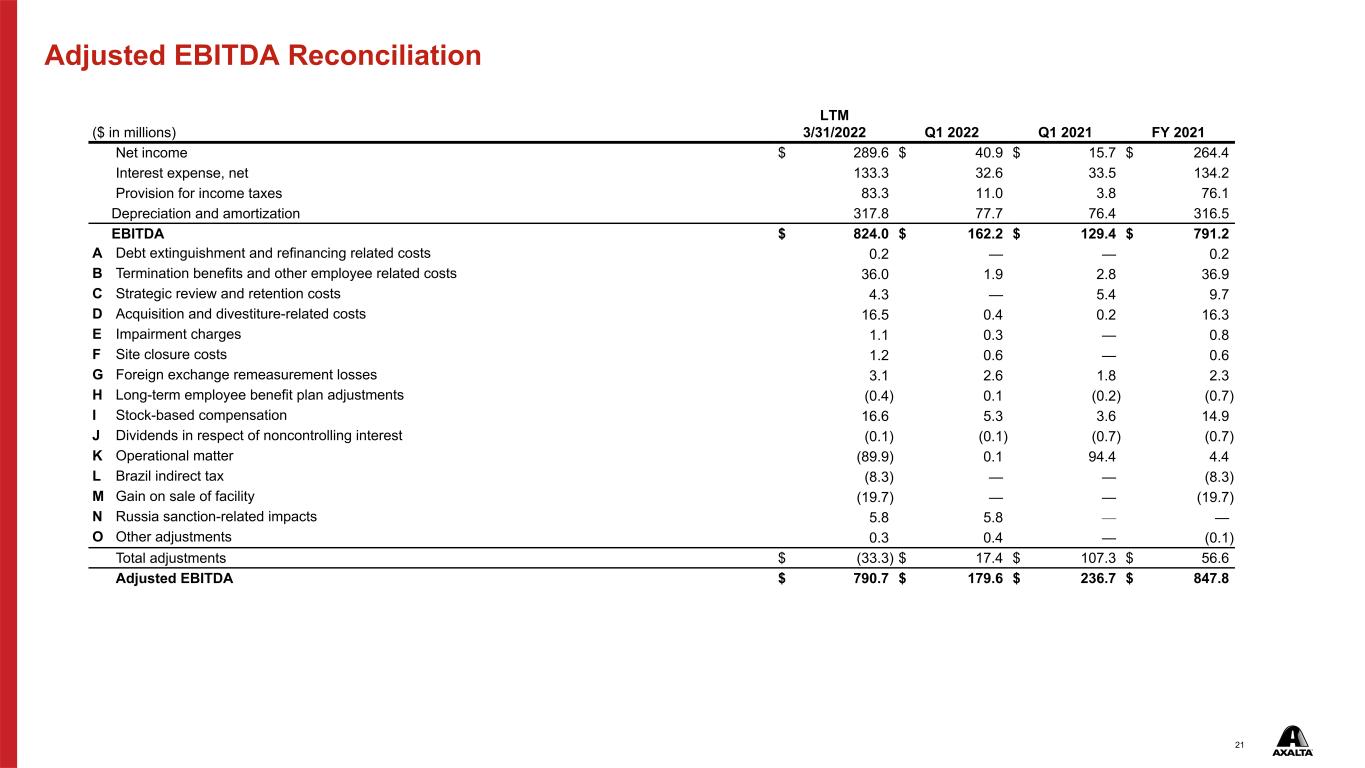
21 Adjusted EBITDA Reconciliation ($ in millions) LTM 3/31/2022 Q1 2022 Q1 2021 FY 2021 Net income $ 289.6 $ 40.9 $ 15.7 $ 264.4 Interest expense, net 133.3 32.6 33.5 134.2 Provision for income taxes 83.3 11.0 3.8 76.1 Depreciation and amortization 317.8 77.7 76.4 316.5 EBITDA $ 824.0 $ 162.2 $ 129.4 $ 791.2 A Debt extinguishment and refinancing related costs 0.2 — — 0.2 B Termination benefits and other employee related costs 36.0 1.9 2.8 36.9 C Strategic review and retention costs 4.3 — 5.4 9.7 D Acquisition and divestiture-related costs 16.5 0.4 0.2 16.3 E Impairment charges 1.1 0.3 — 0.8 F Site closure costs 1.2 0.6 — 0.6 G Foreign exchange remeasurement losses 3.1 2.6 1.8 2.3 H Long-term employee benefit plan adjustments (0.4) 0.1 (0.2) (0.7) I Stock-based compensation 16.6 5.3 3.6 14.9 J Dividends in respect of noncontrolling interest (0.1) (0.1) (0.7) (0.7) K Operational matter (89.9) 0.1 94.4 4.4 L Brazil indirect tax (8.3) — — (8.3) M Gain on sale of facility (19.7) — — (19.7) N Russia sanction-related impacts 5.8 5.8 — — O Other adjustments 0.3 0.4 — (0.1) Total adjustments $ (33.3) $ 17.4 $ 107.3 $ 56.6 Adjusted EBITDA $ 790.7 $ 179.6 $ 236.7 $ 847.8
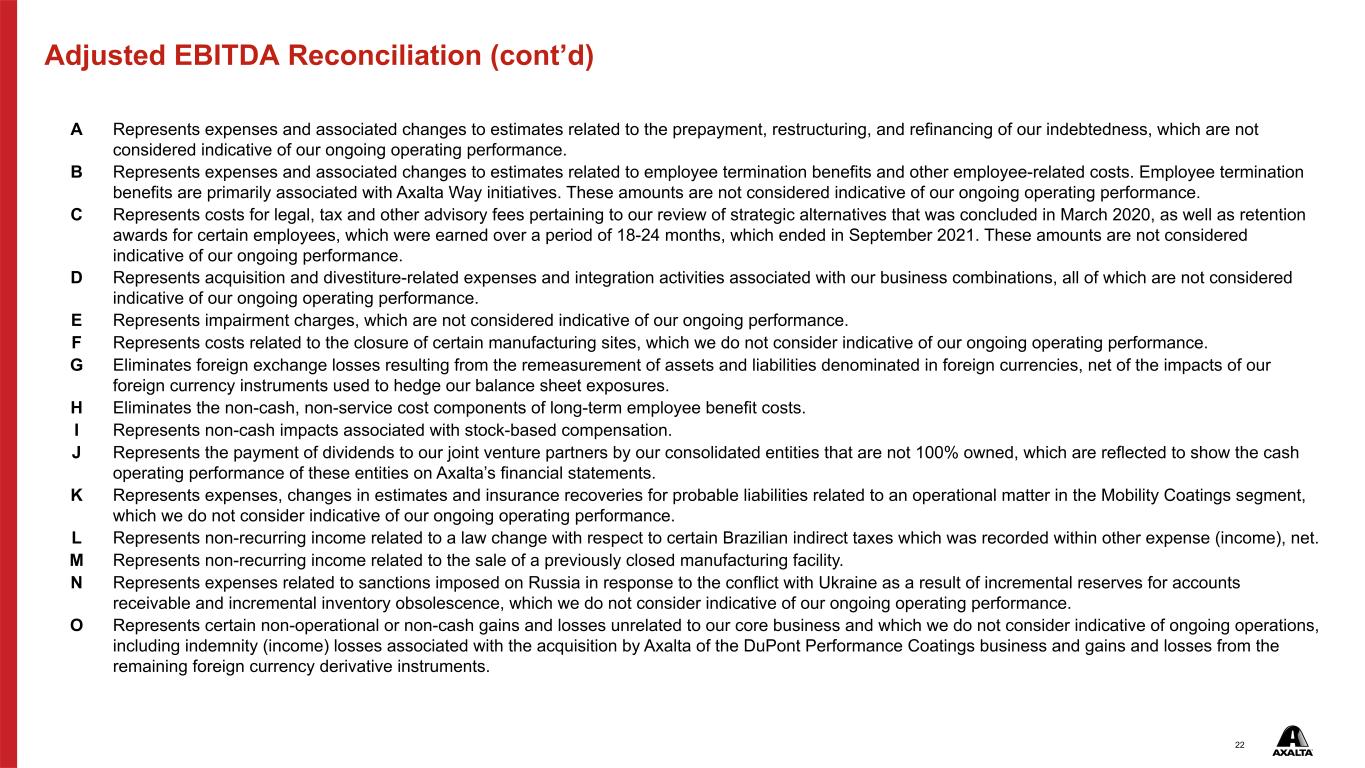
22 Adjusted EBITDA Reconciliation (cont’d) A Represents expenses and associated changes to estimates related to the prepayment, restructuring, and refinancing of our indebtedness, which are not considered indicative of our ongoing operating performance. B Represents expenses and associated changes to estimates related to employee termination benefits and other employee-related costs. Employee termination benefits are primarily associated with Axalta Way initiatives. These amounts are not considered indicative of our ongoing operating performance. C Represents costs for legal, tax and other advisory fees pertaining to our review of strategic alternatives that was concluded in March 2020, as well as retention awards for certain employees, which were earned over a period of 18-24 months, which ended in September 2021. These amounts are not considered indicative of our ongoing performance. D Represents acquisition and divestiture-related expenses and integration activities associated with our business combinations, all of which are not considered indicative of our ongoing operating performance. E Represents impairment charges, which are not considered indicative of our ongoing performance. F Represents costs related to the closure of certain manufacturing sites, which we do not consider indicative of our ongoing operating performance. G Eliminates foreign exchange losses resulting from the remeasurement of assets and liabilities denominated in foreign currencies, net of the impacts of our foreign currency instruments used to hedge our balance sheet exposures. H Eliminates the non-cash, non-service cost components of long-term employee benefit costs. I Represents non-cash impacts associated with stock-based compensation. J Represents the payment of dividends to our joint venture partners by our consolidated entities that are not 100% owned, which are reflected to show the cash operating performance of these entities on Axalta’s financial statements. K Represents expenses, changes in estimates and insurance recoveries for probable liabilities related to an operational matter in the Mobility Coatings segment, which we do not consider indicative of our ongoing operating performance. L Represents non-recurring income related to a law change with respect to certain Brazilian indirect taxes which was recorded within other expense (income), net. M Represents non-recurring income related to the sale of a previously closed manufacturing facility. N Represents expenses related to sanctions imposed on Russia in response to the conflict with Ukraine as a result of incremental reserves for accounts receivable and incremental inventory obsolescence, which we do not consider indicative of our ongoing operating performance. O Represents certain non-operational or non-cash gains and losses unrelated to our core business and which we do not consider indicative of ongoing operations, including indemnity (income) losses associated with the acquisition by Axalta of the DuPont Performance Coatings business and gains and losses from the remaining foreign currency derivative instruments.
23 Thank you Investor Relations Contact: Chris Evans Christopher.Evans@axalta.com 484-724-4099