EX-99.2
Published on July 26, 2022
1 Q2 2022 Financial Results July 26, 2022 Exhibit 99.2
2 Legal Notices Forward-Looking Statements This presentation and the oral remarks made in connection herewith may contain certain forward-looking statements within the meaning of the U.S. Private Securities Litigation Reform Act of 1995 regarding Axalta and its subsidiaries including our outlook and/ or guidance, which includes net sales growth, currency effects, acquisition or divestment impacts, Adjusted EBIT, Adjusted diluted EPS, interest expense, income tax rate, as adjusted, free cash flow, capital expenditures, depreciation and amortization, diluted shares outstanding, raw material inflation and various assumptions noted in the presentation, the effects of COVID-19 on Axalta’s business and financial results, our and our customers’ supply chain constraints and our ability to offset the impacts of such constraints, the timing or amount of any future share repurchases, contributions from our prior acquisitions and our ability to make future acquisitions. Axalta has identified some of these forward-looking statements with words “believe,” “expect,” “assume,” “likely,” “outlook,” “forecast,” “may,” “will,” “should,” “guidance,” “to be,” “could,” “anticipate,” “assumptions,” “assessment,” ”future,” ”estimate,” “projected,” “continues,” “to,” “opportunity,” “potential,” “upside,” “optimistic” and “we see” and the negative of these words or other comparable or similar terminology. All of these statements are based on management’s expectations as well as estimates and assumptions prepared by management that, although they believe to be reasonable, are inherently uncertain. These statements involve risks and uncertainties, including, but not limited to, economic, competitive, governmental and technological factors outside of Axalta’s control, including the effects of COVID-19, that may cause its business, industry, strategy, financing activities or actual results to differ materially. The impact and duration of COVID-19 on our business and operations is uncertain. Factors that will influence the impact on our business and operations include the duration and extent of COVID-19, the extent of imposed or recommended containment and mitigation measures, and the general economic consequences of COVID-19. More information on potential factors that could affect Axalta's financial results is available in “Forward-Looking Statements,” “Risk Factors” and “Management's Discussion and Analysis of Financial Condition and Results of Operations” within Axalta's most recent Annual Report on Form 10-K, and in other documents that we have filed with, or furnished to, the U.S. Securities and Exchange Commission. Axalta undertakes no obligation to update or revise any of the forward-looking statements contained herein, whether as a result of new information, future events or otherwise. Non-GAAP Financial Measures The historical financial information included in this presentation includes financial information that is not presented in accordance with generally accepted accounting principles in the United States (“GAAP”), including constant currency net sales growth, income tax rate, as adjusted, EBIT, Adjusted EBIT, EBITDA, Adjusted EBITDA, Adjusted diluted EPS, free cash flow, net debt, Adjusted net income, Adjusted EBITDA to interest expense coverage ratio, Adjusted EBIT margin and net leverage. Management uses these non-GAAP financial measures in the analysis of our financial and operating performance because they assist in the evaluation of underlying trends in our business. Adjusted EBITDA, Adjusted EBIT and Adjusted diluted EPS consist of EBITDA, EBIT and Diluted EPS, respectively, adjusted for (i) certain non-cash items included within net income, (ii) certain items Axalta does not believe are indicative of ongoing operating performance or (iii) certain nonrecurring, unusual or infrequent items that have not occurred within the last two years or we believe are not reasonably likely to recur within the next two years. We believe that making such adjustments provides investors meaningful information to understand our operating results and ability to analyze financial and business trends on a period-to-period basis. Adjusted net income shows the adjusted value of net income (loss) attributable to controlling interests after removing the items that are determined by management to be items that we do not consider indicative of our ongoing operating performance or unusual or nonrecurring in nature. Our use of the terms constant currency net sales growth, income tax rate, as adjusted, EBIT, Adjusted EBIT, EBITDA, Adjusted EBITDA, Adjusted diluted EPS, free cash flow, net debt, Adjusted net income, Adjusted EBITDA to interest expense coverage ratio, Adjusted EBIT margin and net leverage may differ from that of others in our industry. Constant currency net sales growth, income tax rate, as adjusted, EBIT, Adjusted EBIT, EBITDA, Adjusted EBITDA, Adjusted diluted EPS, free cash flow, net debt, Adjusted net income, Adjusted EBITDA to interest expense coverage ratio, Adjusted EBIT margin and net leverage should not be considered as alternatives to net sales, net income, income before operations or any other performance measures derived in accordance with GAAP as measures of operating performance or operating cash flows or as measures of liquidity. Constant currency net sales growth, income tax rate, as adjusted, EBIT, Adjusted EBIT, EBITDA, Adjusted EBITDA, Adjusted diluted EPS, free cash flow, net debt, Adjusted net income, Adjusted EBITDA to interest expense coverage ratio, Adjusted EBIT margin and net leverage have important limitations as analytical tools and should be considered in conjunction with, and not as substitutes for, our results as reported under GAAP. This presentation includes a reconciliation of certain non-GAAP financial measures with the most directly comparable financial measures calculated in accordance with GAAP. Axalta does not provide a reconciliation for non-GAAP estimates for constant currency net sales growth, Adjusted EBIT, Adjusted EBITDA, Adjusted diluted EPS, income tax rate, as adjusted, or free cash flow on a forward-looking basis because the information necessary to calculate a meaningful or accurate estimation of reconciling items is not available without unreasonable effort. For example, such reconciling items include the impact of foreign currency exchange gains or losses, gains or losses that are unusual or nonrecurring in nature, as well as discrete taxable events. We cannot estimate or project these items and they may have a substantial and unpredictable impact on our US GAAP results. Constant Currency Constant currency or ex-FX percentages are calculated by excluding the impact the change in average exchange rates between the current and comparable period by currency denomination exposure of the comparable period amount. Organic Growth Organic growth or ex-M&A percentages are calculated by excluding the impact of recent acquisitions and divestitures. Segment Financial Measures The primary measure of segment operating performance is Adjusted EBIT, which is a key metric that is used by management to evaluate business performance in comparison to budgets, forecasts and prior year financial results, providing a measure that management believes reflects Axalta’s core operating performance. As we do not measure segment operating performance based on net income, a reconciliation of this non-GAAP financial measure with the most directly comparable financial measure calculated in accordance with GAAP is not available. Defined Terms All capitalized terms contained within this presentation have been previously defined in our filings with the United States Securities and Exchange Commission. Rounding Due to rounding the tables presented may not foot.
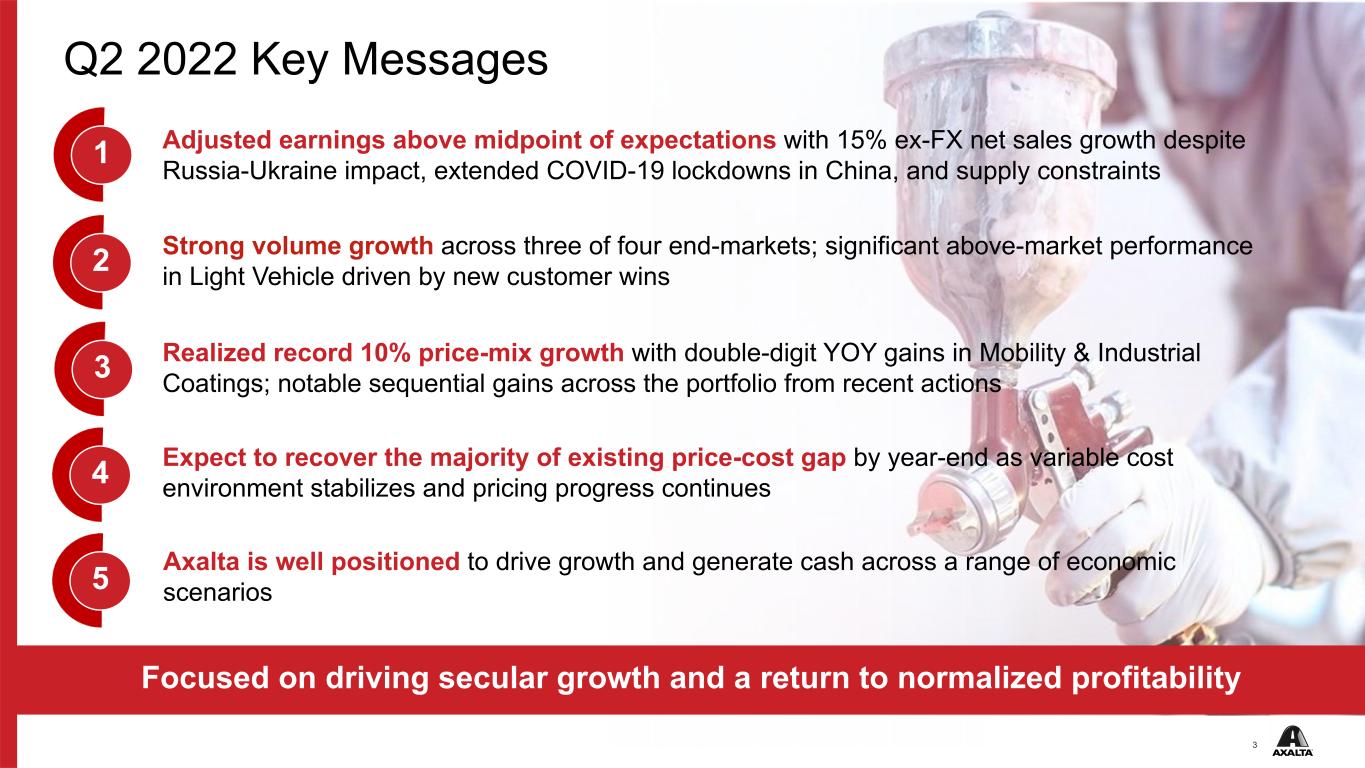
3 Q2 2022 Key Messages Focused on driving secular growth and a return to normalized profitability Realized record 10% price-mix growth with double-digit YOY gains in Mobility & Industrial Coatings; notable sequential gains across the portfolio from recent actions 1 2 3 4 Adjusted earnings above midpoint of expectations with 15% ex-FX net sales growth despite Russia-Ukraine impact, extended COVID-19 lockdowns in China, and supply constraints Expect to recover the majority of existing price-cost gap by year-end as variable cost environment stabilizes and pricing progress continues Strong volume growth across three of four end-markets; significant above-market performance in Light Vehicle driven by new customer wins 5 Axalta is well positioned to drive growth and generate cash across a range of economic scenarios
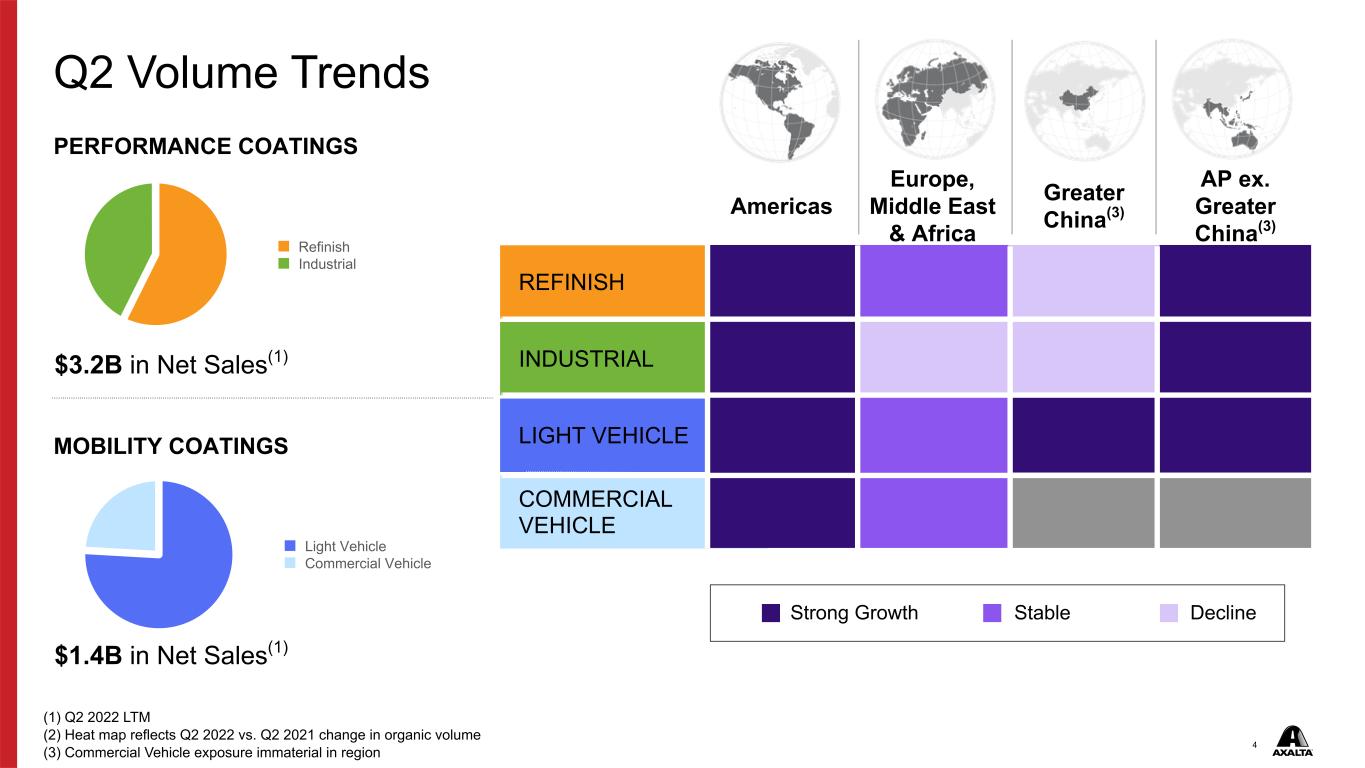
4 COMMERCIAL VEHICLE LIGHT VEHICLE INDUSTRIAL REFINISH Light Vehicle Commercial Vehicle Refinish Industrial Q2 Volume Trends PERFORMANCE COATINGS PROPRIETARY Strong Growth Stable Decline $3.2B in Net Sales(1) $1.4B in Net Sales(1) (1) Q2 2022 LTM (2) Heat map reflects Q2 2022 vs. Q2 2021 change in organic volume (3) Commercial Vehicle exposure immaterial in region Americas Europe, Middle East & Africa Greater China(3) AP ex. Greater China(3) 7.9% (1.5)% (9.8)% 9.1% 7.5% (10.7)% (35.9)% 10.3% 12.4% (0.4)% 15.5% 22.0% 16.0% 2.4% MOBILITY COATINGS
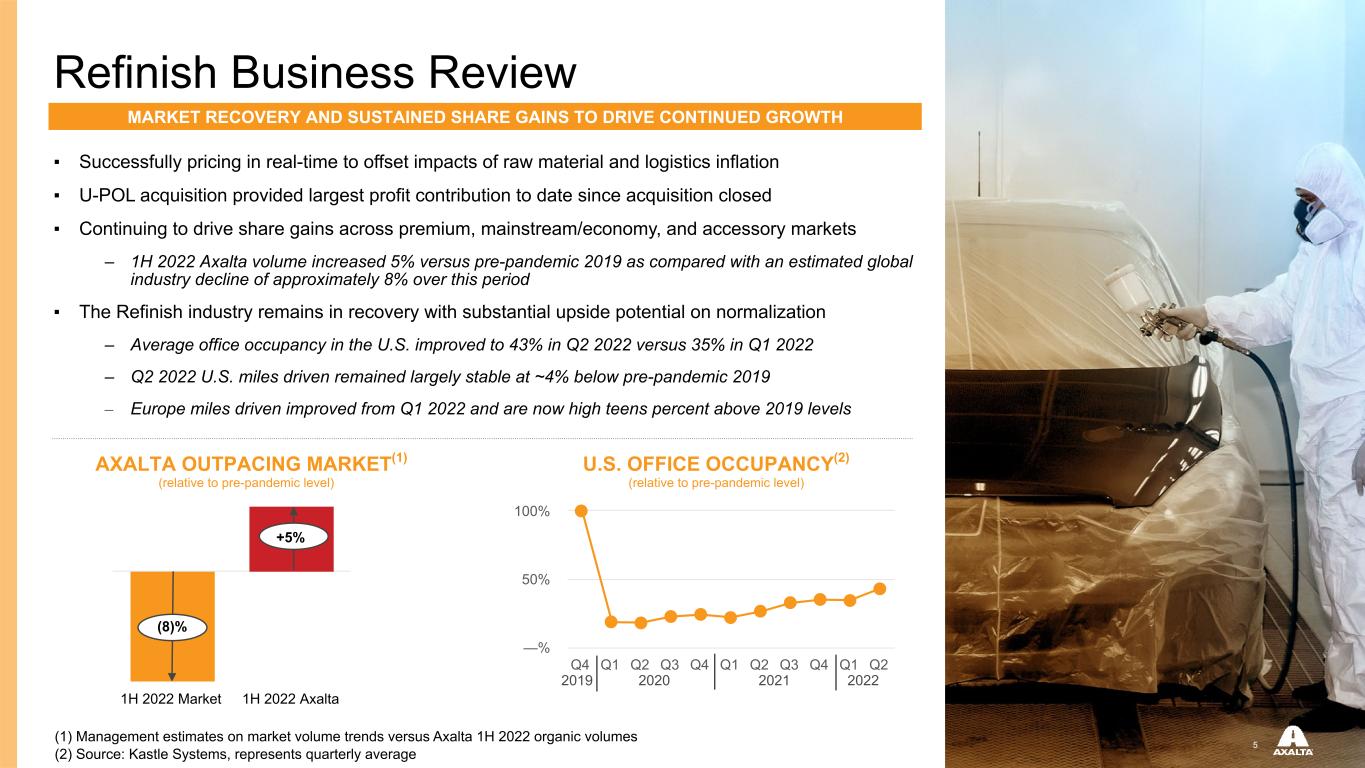
5 1H 2022 Market 1H 2022 Axalta Refinish Business Review Q4 Q1 Q2 Q3 Q4 Q1 Q2 Q3 Q4 Q1 Q2 —% 50% 100% U.S. OFFICE OCCUPANCY(2) (1) Management estimates on market volume trends versus Axalta 1H 2022 organic volumes (2) Source: Kastle Systems, represents quarterly average 2020 ▪ Successfully pricing in real-time to offset impacts of raw material and logistics inflation ▪ U-POL acquisition provided largest profit contribution to date since acquisition closed ▪ Continuing to drive share gains across premium, mainstream/economy, and accessory markets – 1H 2022 Axalta volume increased 5% versus pre-pandemic 2019 as compared with an estimated global industry decline of approximately 8% over this period ▪ The Refinish industry remains in recovery with substantial upside potential on normalization – Average office occupancy in the U.S. improved to 43% in Q2 2022 versus 35% in Q1 2022 – Q2 2022 U.S. miles driven remained largely stable at ~4% below pre-pandemic 2019 – Europe miles driven improved from Q1 2022 and are now high teens percent above 2019 levels 2021 2022 MARKET RECOVERY AND SUSTAINED SHARE GAINS TO DRIVE CONTINUED GROWTH (relative to pre-pandemic level) 2019 AXALTA OUTPACING MARKET(1) (relative to pre-pandemic level) +5% (8)%
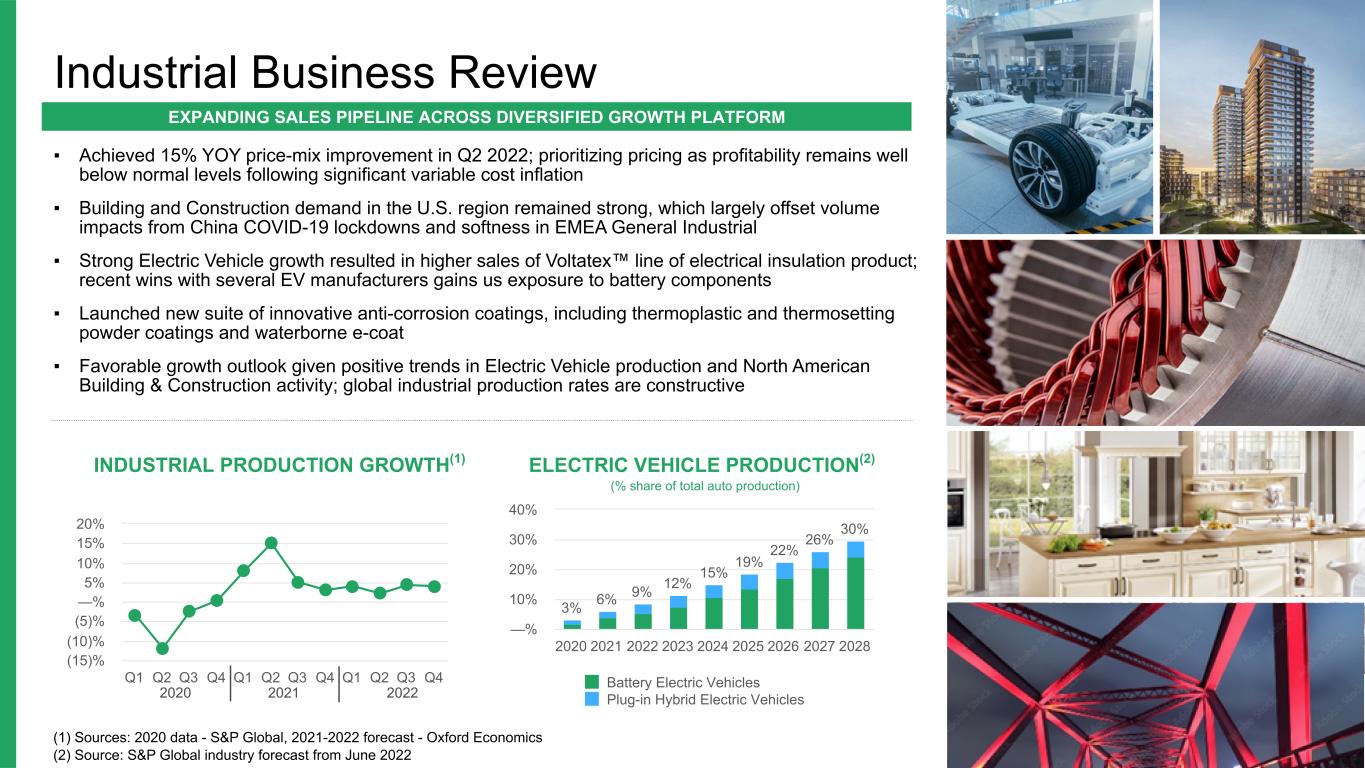
6 Industrial Business Review ▪ Achieved 15% YOY price-mix improvement in Q2 2022; prioritizing pricing as profitability remains well below normal levels following significant variable cost inflation ▪ Building and Construction demand in the U.S. region remained strong, which largely offset volume impacts from China COVID-19 lockdowns and softness in EMEA General Industrial ▪ Strong Electric Vehicle growth resulted in higher sales of Voltatex™ line of electrical insulation product; recent wins with several EV manufacturers gains us exposure to battery components ▪ Launched new suite of innovative anti-corrosion coatings, including thermoplastic and thermosetting powder coatings and waterborne e-coat ▪ Favorable growth outlook given positive trends in Electric Vehicle production and North American Building & Construction activity; global industrial production rates are constructive P M/E A Q1 Q2 Q3 Q4 Q1 Q2 Q3 Q4 Q1 Q2 Q3 Q4 (15)% (10)% (5)% —% 5% 10% 15% 20% INDUSTRIAL PRODUCTION GROWTH(1) ELECTRIC VEHICLE PRODUCTION(2) 2020 2021 2022 EXPANDING SALES PIPELINE ACROSS DIVERSIFIED GROWTH PLATFORM 3% 6% 9% 12% 15% 19% 22% 26% 30% Battery Electric Vehicles Plug-in Hybrid Electric Vehicles 2020 2021 2022 2023 2024 2025 2026 2027 2028 —% 10% 20% 30% 40% (% share of total auto production) (1) Sources: 2020 data - S&P Global, 2021-2022 forecast - Oxford Economics (2) Source: S&P Global industry forecast from June 2022
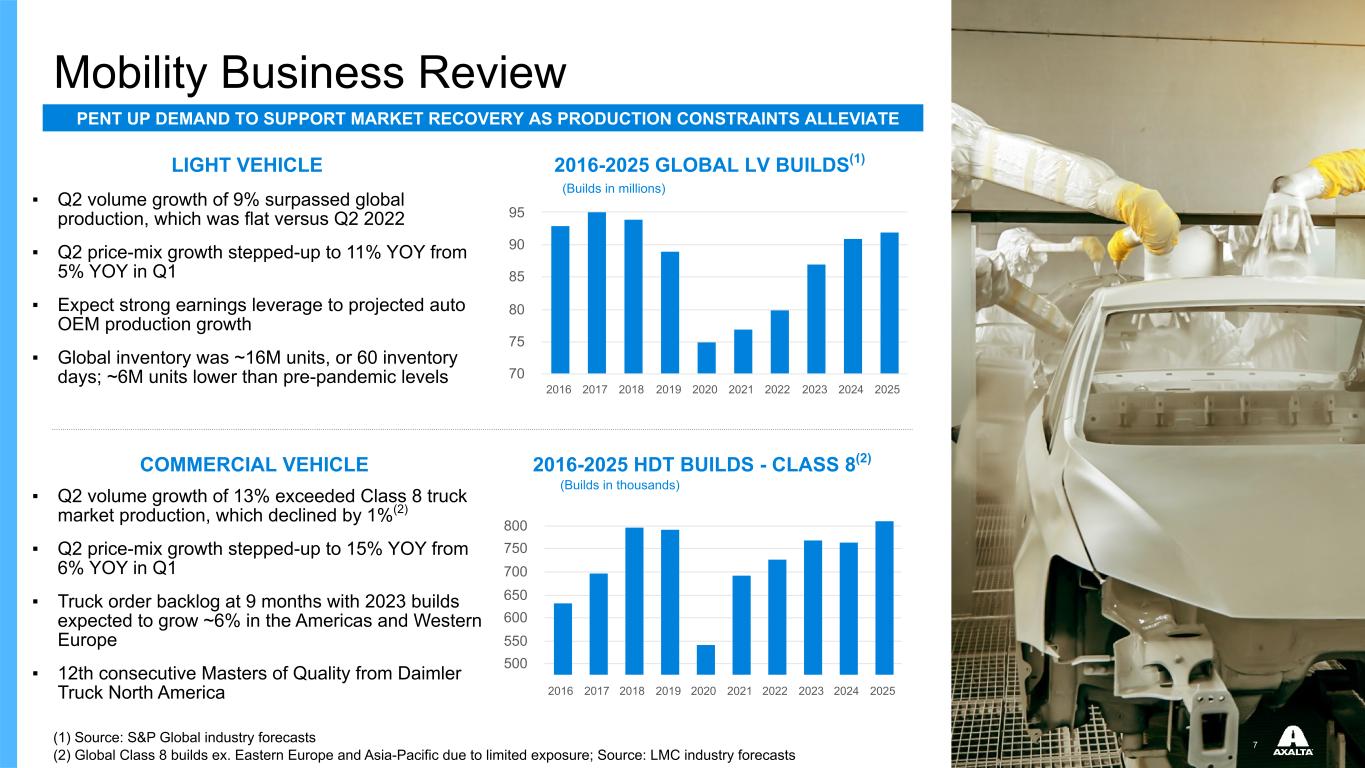
7 2016 2017 2018 2019 2020 2021 2022 2023 2024 2025 500 550 600 650 700 750 800 Mobility Business Review ▪ Q2 volume growth of 9% surpassed global production, which was flat versus Q2 2022 ▪ Q2 price-mix growth stepped-up to 11% YOY from 5% YOY in Q1 ▪ Expect strong earnings leverage to projected auto OEM production growth ▪ Global inventory was ~16M units, or 60 inventory days; ~6M units lower than pre-pandemic levels ▪ Q2 volume growth of 13% exceeded Class 8 truck market production, which declined by 1%(2) ▪ Q2 price-mix growth stepped-up to 15% YOY from 6% YOY in Q1 ▪ Truck order backlog at 9 months with 2023 builds expected to grow ~6% in the Americas and Western Europe ▪ 12th consecutive Masters of Quality from Daimler Truck North America 2016 2017 2018 2019 2020 2021 2022 2023 2024 2025 70 75 80 85 90 95 2016-2025 GLOBAL LV BUILDS(1) 2016-2025 HDT BUILDS - CLASS 8(2) PENT UP DEMAND TO SUPPORT MARKET RECOVERY AS PRODUCTION CONSTRAINTS ALLEVIATE (Builds in thousands) LIGHT VEHICLE COMMERCIAL VEHICLE (Builds in millions) (1) Source: S&P Global industry forecasts (2) Global Class 8 builds ex. Eastern Europe and Asia-Pacific due to limited exposure; Source: LMC industry forecasts
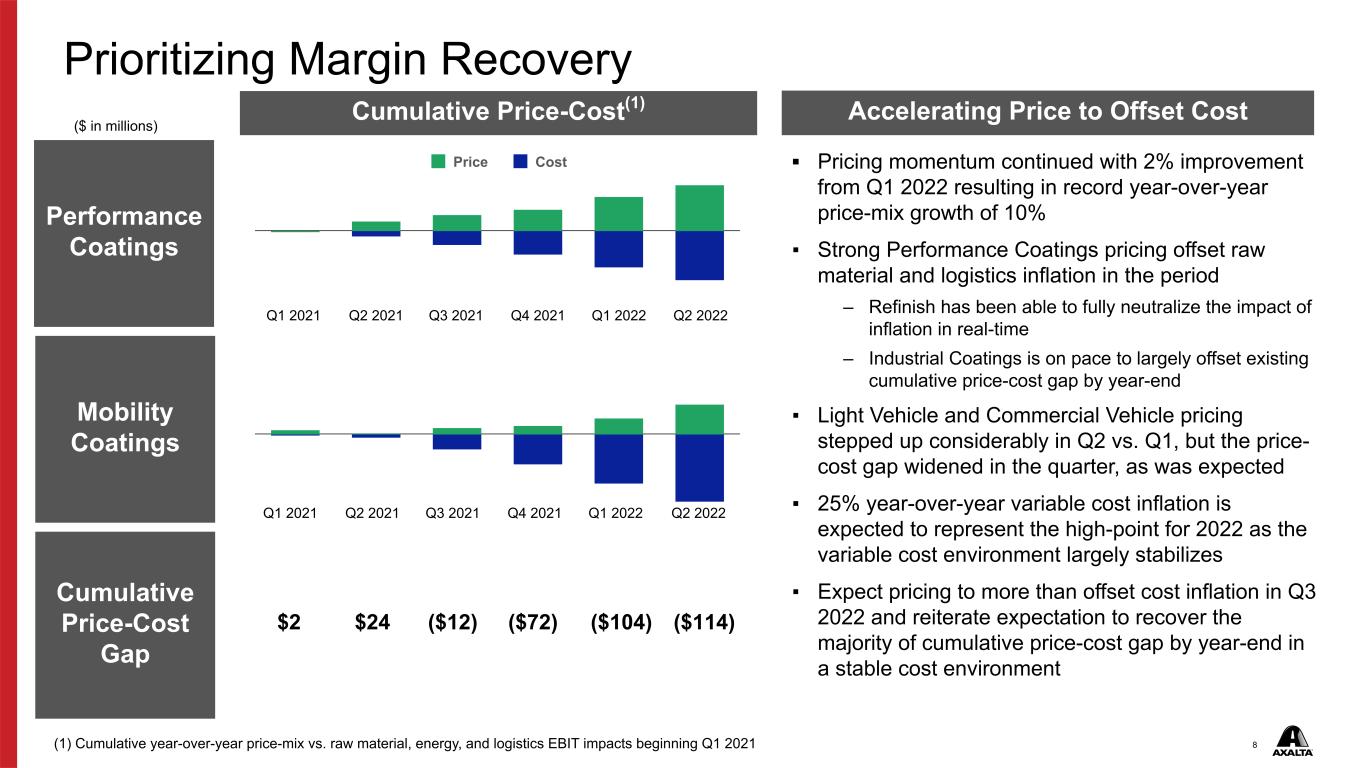
8 Price Cost Prioritizing Margin Recovery ($ in millions) (1) Cumulative year-over-year price-mix vs. raw material, energy, and logistics EBIT impacts beginning Q1 2021 ▪ Pricing momentum continued with 2% improvement from Q1 2022 resulting in record year-over-year price-mix growth of 10% ▪ Strong Performance Coatings pricing offset raw material and logistics inflation in the period – Refinish has been able to fully neutralize the impact of inflation in real-time – Industrial Coatings is on pace to largely offset existing cumulative price-cost gap by year-end ▪ Light Vehicle and Commercial Vehicle pricing stepped up considerably in Q2 vs. Q1, but the price- cost gap widened in the quarter, as was expected ▪ 25% year-over-year variable cost inflation is expected to represent the high-point for 2022 as the variable cost environment largely stabilizes ▪ Expect pricing to more than offset cost inflation in Q3 2022 and reiterate expectation to recover the majority of cumulative price-cost gap by year-end in a stable cost environment $2 $24 ($12) ($72) ($104) Q1 2021 Q2 2021 Q3 2021 Q4 2021 Q1 2022 Q2 2022 ($114) Cumulative Price-Cost(1) Performance Coatings Mobility Coatings Cumulative Price-Cost Gap Accelerating Price to Offset Cost Q1 2021 Q2 2021 Q3 2021 Q4 2021 Q1 2022 Q2 2022
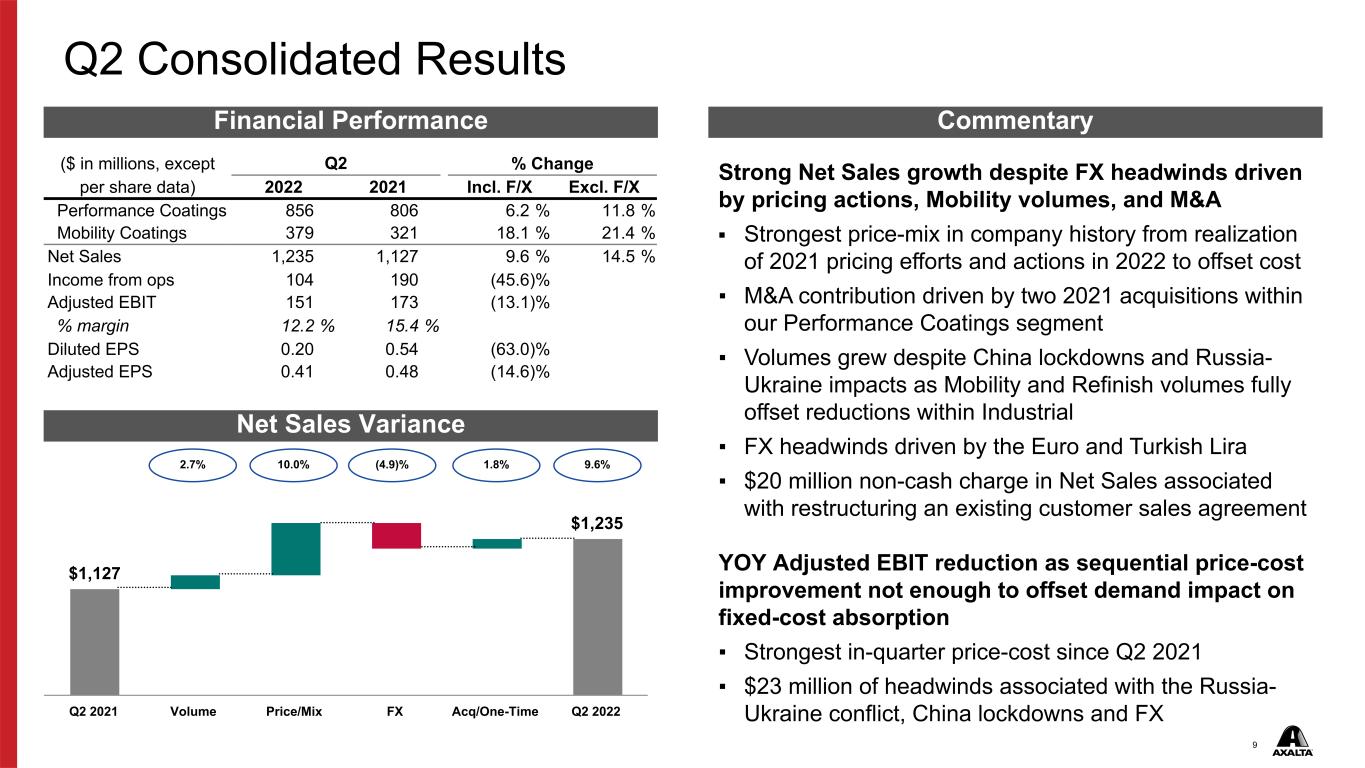
9 $1,127 $1,235 Q2 2021 Volume Price/Mix FX Acq/One-Time Q2 2022 Q2 Consolidated Results Strong Net Sales growth despite FX headwinds driven by pricing actions, Mobility volumes, and M&A ▪ Strongest price-mix in company history from realization of 2021 pricing efforts and actions in 2022 to offset cost ▪ M&A contribution driven by two 2021 acquisitions within our Performance Coatings segment ▪ Volumes grew despite China lockdowns and Russia- Ukraine impacts as Mobility and Refinish volumes fully offset reductions within Industrial ▪ FX headwinds driven by the Euro and Turkish Lira ▪ $20 million non-cash charge in Net Sales associated with restructuring an existing customer sales agreement YOY Adjusted EBIT reduction as sequential price-cost improvement not enough to offset demand impact on fixed-cost absorption ▪ Strongest in-quarter price-cost since Q2 2021 ▪ $23 million of headwinds associated with the Russia- Ukraine conflict, China lockdowns and FX ($ in millions, except Q2 % Change per share data) 2022 2021 Incl. F/X Excl. F/X Performance Coatings 856 806 6.2 % 11.8 % Mobility Coatings 379 321 18.1 % 21.4 % Net Sales 1,235 1,127 9.6 % 14.5 % Income from ops 104 190 (45.6) % Adjusted EBIT 151 173 (13.1) % % margin 12.2 % 15.4 % Diluted EPS 0.20 0.54 (63.0) % Adjusted EPS 0.41 0.48 (14.6) % 2.7% 10.0% (4.9)% 9.6% 1.8% Financial Performance Commentary Net Sales Variance
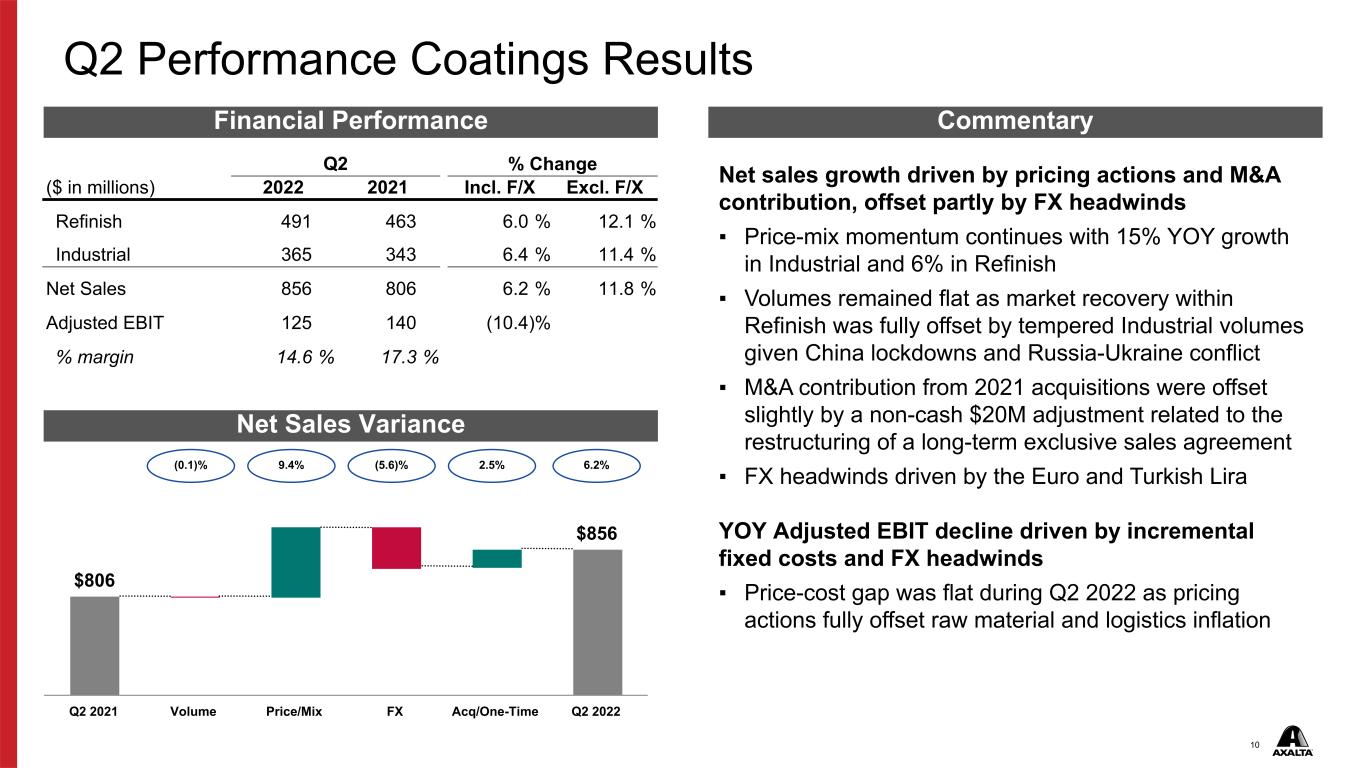
10 $806 $856 Q2 2021 Volume Price/Mix FX Acq/One-Time Q2 2022 Q2 Performance Coatings Results Q2 % Change ($ in millions) 2022 2021 Incl. F/X Excl. F/X Refinish 491 463 6.0 % 12.1 % Industrial 365 343 6.4 % 11.4 % Net Sales 856 806 6.2 % 11.8 % Adjusted EBIT 125 140 (10.4) % % margin 14.6 % 17.3 % (0.1)% 9.4% (5.6)% 6.2% Net sales growth driven by pricing actions and M&A contribution, offset partly by FX headwinds ▪ Price-mix momentum continues with 15% YOY growth in Industrial and 6% in Refinish ▪ Volumes remained flat as market recovery within Refinish was fully offset by tempered Industrial volumes given China lockdowns and Russia-Ukraine conflict ▪ M&A contribution from 2021 acquisitions were offset slightly by a non-cash $20M adjustment related to the restructuring of a long-term exclusive sales agreement ▪ FX headwinds driven by the Euro and Turkish Lira YOY Adjusted EBIT decline driven by incremental fixed costs and FX headwinds ▪ Price-cost gap was flat during Q2 2022 as pricing actions fully offset raw material and logistics inflation 2.5% Financial Performance Commentary Net Sales Variance
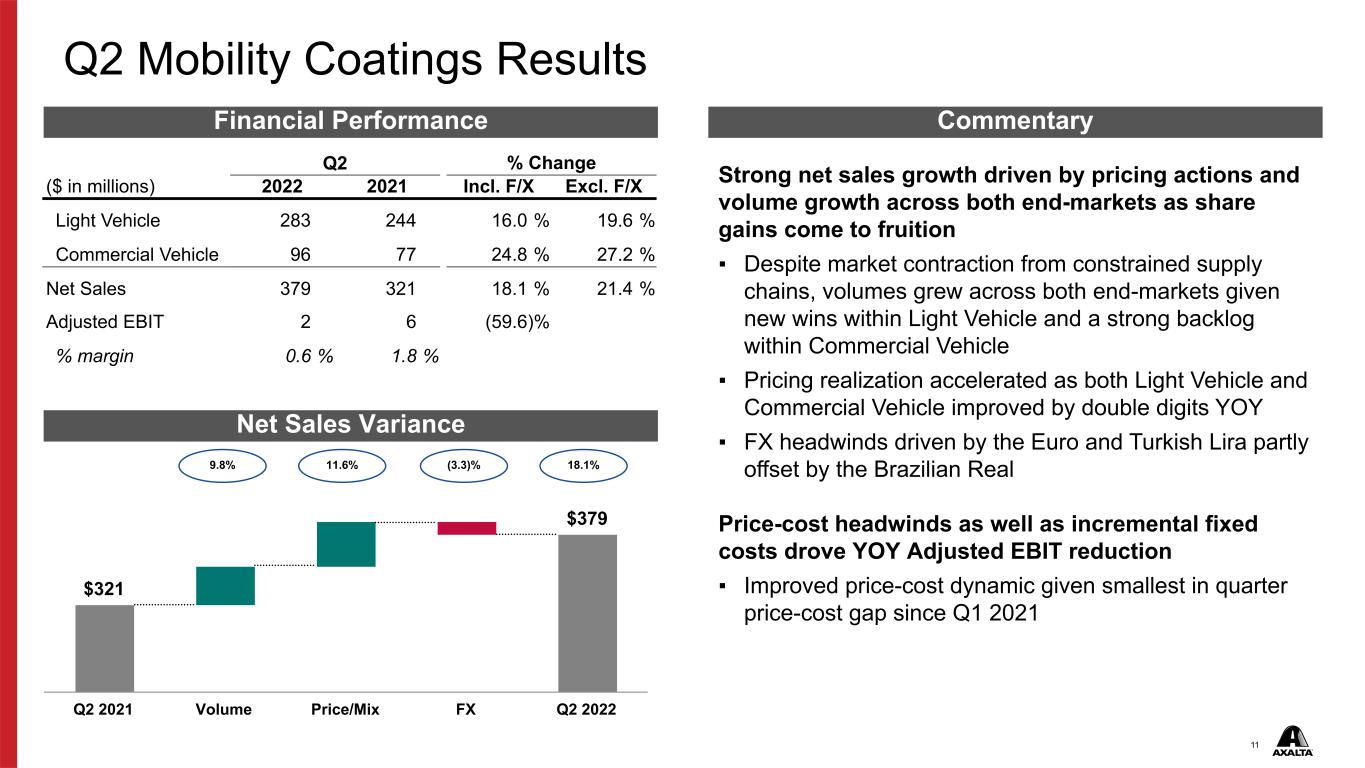
11 $321 $379 Q2 2021 Volume Price/Mix FX Q2 2022 Q2 Mobility Coatings Results Q2 % Change ($ in millions) 2022 2021 Incl. F/X Excl. F/X Light Vehicle 283 244 16.0 % 19.6 % Commercial Vehicle 96 77 24.8 % 27.2 % Net Sales 379 321 18.1 % 21.4 % Adjusted EBIT 2 6 (59.6) % % margin 0.6 % 1.8 % 9.8% 11.6% (3.3)% 18.1% Strong net sales growth driven by pricing actions and volume growth across both end-markets as share gains come to fruition ▪ Despite market contraction from constrained supply chains, volumes grew across both end-markets given new wins within Light Vehicle and a strong backlog within Commercial Vehicle ▪ Pricing realization accelerated as both Light Vehicle and Commercial Vehicle improved by double digits YOY ▪ FX headwinds driven by the Euro and Turkish Lira partly offset by the Brazilian Real Price-cost headwinds as well as incremental fixed costs drove YOY Adjusted EBIT reduction ▪ Improved price-cost dynamic given smallest in quarter price-cost gap since Q1 2021 Financial Performance Commentary Net Sales Variance
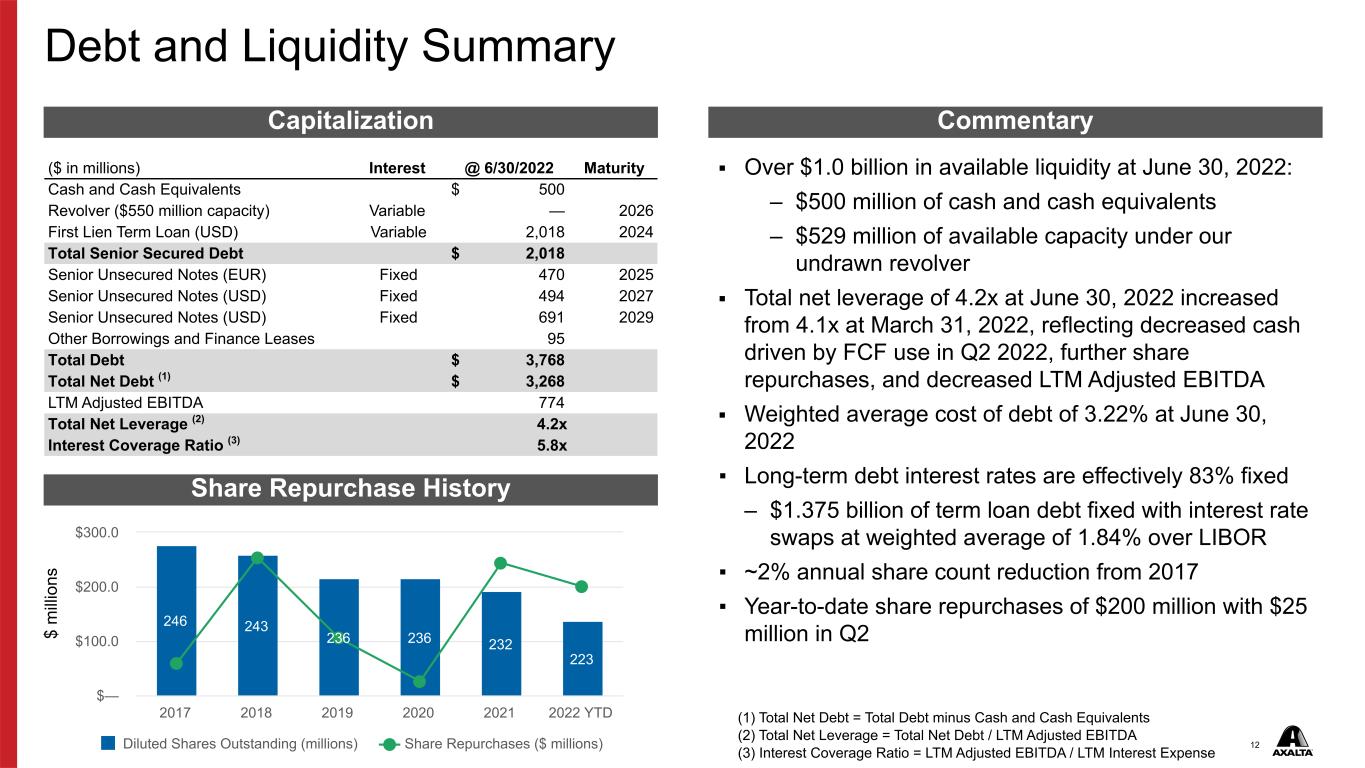
12 Debt and Liquidity Summary ($ in millions) Interest @ 6/30/2022 Maturity Cash and Cash Equivalents $ 500 Revolver ($550 million capacity) Variable — 2026 First Lien Term Loan (USD) Variable 2,018 2024 Total Senior Secured Debt $ 2,018 Senior Unsecured Notes (EUR) Fixed 470 2025 Senior Unsecured Notes (USD) Fixed 494 2027 Senior Unsecured Notes (USD) Fixed 691 2029 Other Borrowings and Finance Leases 95 Total Debt $ 3,768 Total Net Debt (1) $ 3,268 LTM Adjusted EBITDA 774 Total Net Leverage (2) 4.2x Interest Coverage Ratio (3) 5.8x Capitalization Commentary ▪ Over $1.0 billion in available liquidity at June 30, 2022: – $500 million of cash and cash equivalents – $529 million of available capacity under our undrawn revolver ▪ Total net leverage of 4.2x at June 30, 2022 increased from 4.1x at March 31, 2022, reflecting decreased cash driven by FCF use in Q2 2022, further share repurchases, and decreased LTM Adjusted EBITDA ▪ Weighted average cost of debt of 3.22% at June 30, 2022 ▪ Long-term debt interest rates are effectively 83% fixed – $1.375 billion of term loan debt fixed with interest rate swaps at weighted average of 1.84% over LIBOR ▪ ~2% annual share count reduction from 2017 ▪ Year-to-date share repurchases of $200 million with $25 million in Q2 246 243 236 236 232 223 Diluted Shares Outstanding (millions) Share Repurchases ($ millions) 2017 2018 2019 2020 2021 2022 YTD $— $100.0 $200.0 $300.0 (1) Total Net Debt = Total Debt minus Cash and Cash Equivalents (2) Total Net Leverage = Total Net Debt / LTM Adjusted EBITDA (3) Interest Coverage Ratio = LTM Adjusted EBITDA / LTM Interest Expense $ m ill io ns Share Repurchase History
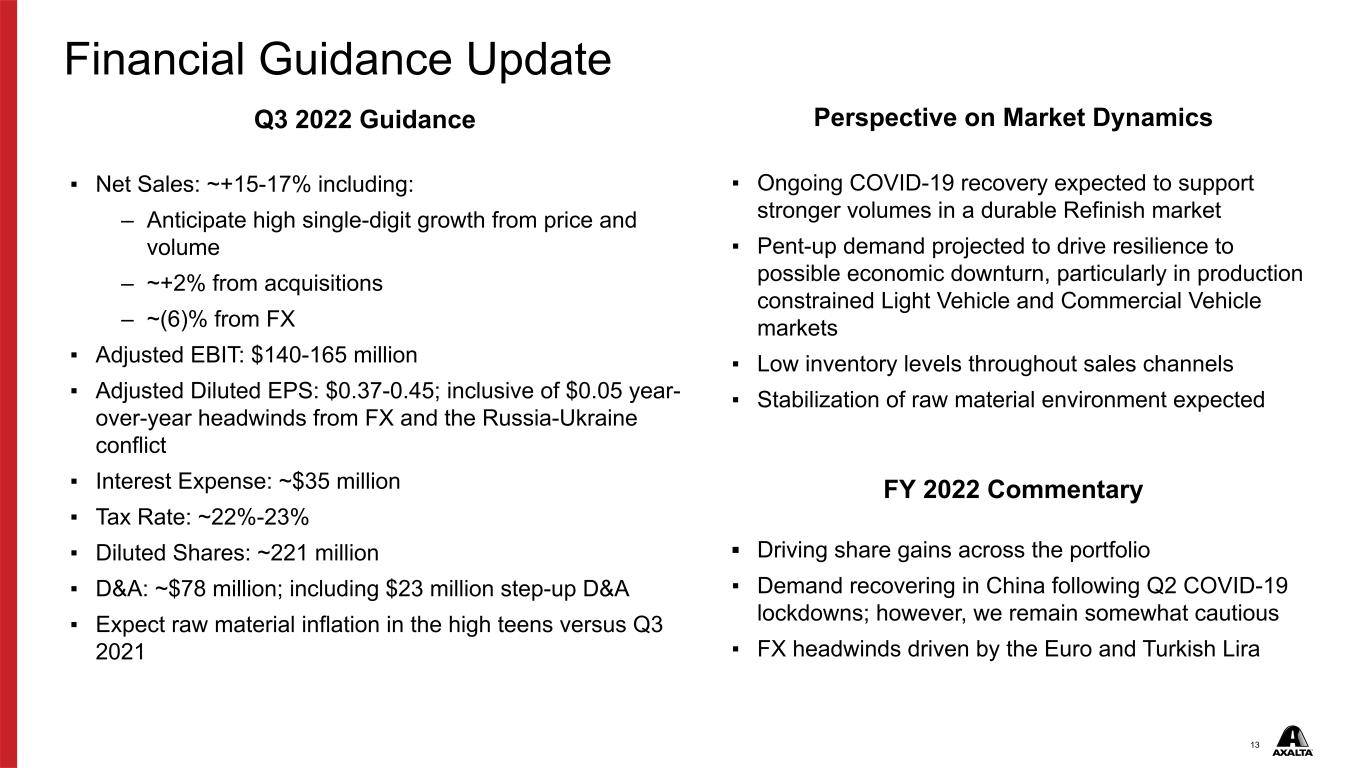
13 Financial Guidance Update Q3 2022 Guidance ▪ Net Sales: ~+15-17% including: – Anticipate high single-digit growth from price and volume – ~+2% from acquisitions – ~(6)% from FX ▪ Adjusted EBIT: $140-165 million ▪ Adjusted Diluted EPS: $0.37-0.45; inclusive of $0.05 year- over-year headwinds from FX and the Russia-Ukraine conflict ▪ Interest Expense: ~$35 million ▪ Tax Rate: ~22%-23% ▪ Diluted Shares: ~221 million ▪ D&A: ~$78 million; including $23 million step-up D&A ▪ Expect raw material inflation in the high teens versus Q3 2021 Perspective on Market Dynamics ▪ Ongoing COVID-19 recovery expected to support stronger volumes in a durable Refinish market ▪ Pent-up demand projected to drive resilience to possible economic downturn, particularly in production constrained Light Vehicle and Commercial Vehicle markets ▪ Low inventory levels throughout sales channels ▪ Stabilization of raw material environment expected FY 2022 Commentary ▪ Driving share gains across the portfolio ▪ Demand recovering in China following Q2 COVID-19 lockdowns; however, we remain somewhat cautious ▪ FX headwinds driven by the Euro and Turkish Lira
14 Appendix
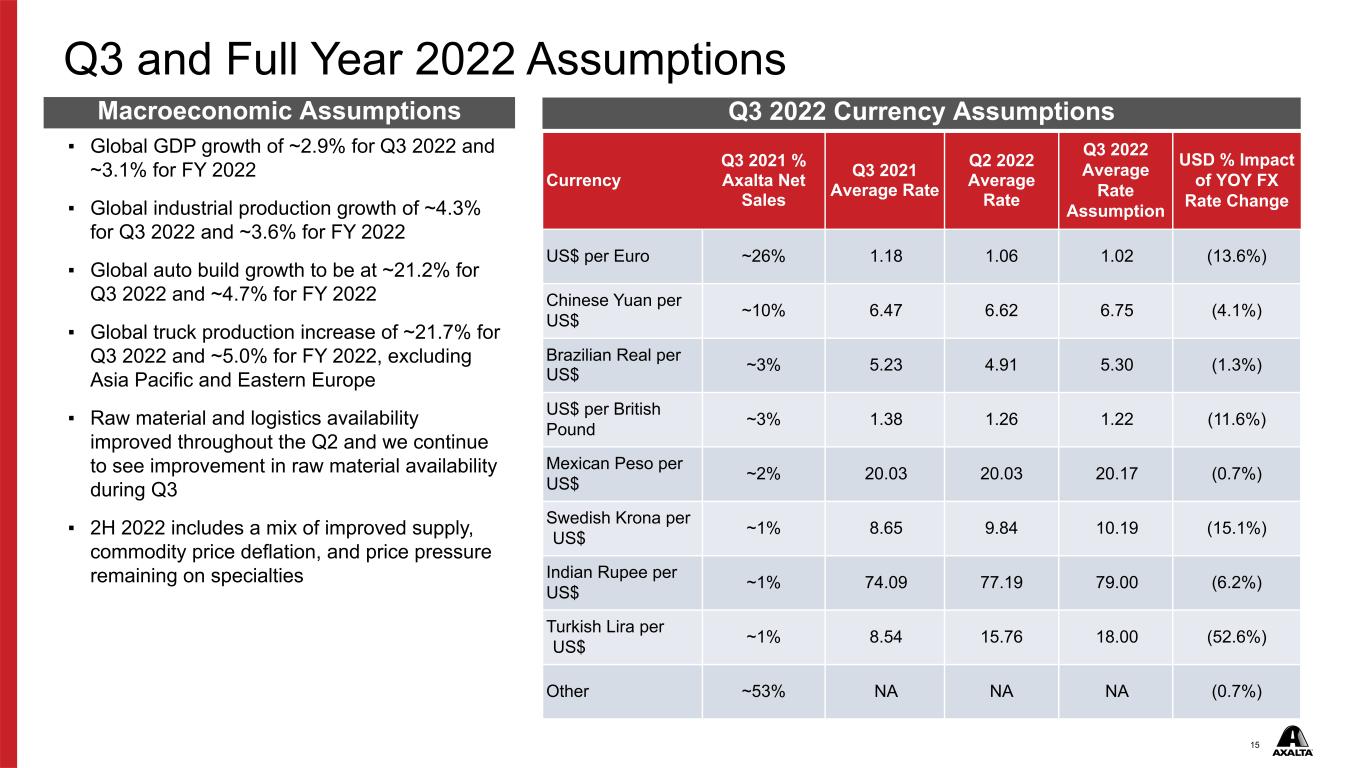
15 Q3 and Full Year 2022 Assumptions ▪ Global GDP growth of ~2.9% for Q3 2022 and ~3.1% for FY 2022 ▪ Global industrial production growth of ~4.3% for Q3 2022 and ~3.6% for FY 2022 ▪ Global auto build growth to be at ~21.2% for Q3 2022 and ~4.7% for FY 2022 ▪ Global truck production increase of ~21.7% for Q3 2022 and ~5.0% for FY 2022, excluding Asia Pacific and Eastern Europe ▪ Raw material and logistics availability improved throughout the Q2 and we continue to see improvement in raw material availability during Q3 ▪ 2H 2022 includes a mix of improved supply, commodity price deflation, and price pressure remaining on specialties Currency Q3 2021 % Axalta Net Sales Q3 2021 Average Rate Q2 2022 Average Rate Q3 2022 Average Rate Assumption USD % Impact of YOY FX Rate Change US$ per Euro ~26% 1.18 1.06 1.02 (13.6%) Chinese Yuan per US$ ~10% 6.47 6.62 6.75 (4.1%) Brazilian Real per US$ ~3% 5.23 4.91 5.30 (1.3%) US$ per British Pound ~3% 1.38 1.26 1.22 (11.6%) Mexican Peso per US$ ~2% 20.03 20.03 20.17 (0.7%) Swedish Krona per US$ ~1% 8.65 9.84 10.19 (15.1%) Indian Rupee per US$ ~1% 74.09 77.19 79.00 (6.2%) Turkish Lira per US$ ~1% 8.54 15.76 18.00 (52.6%) Other ~53% NA NA NA (0.7%) Macroeconomic Assumptions Q3 2022 Currency Assumptions
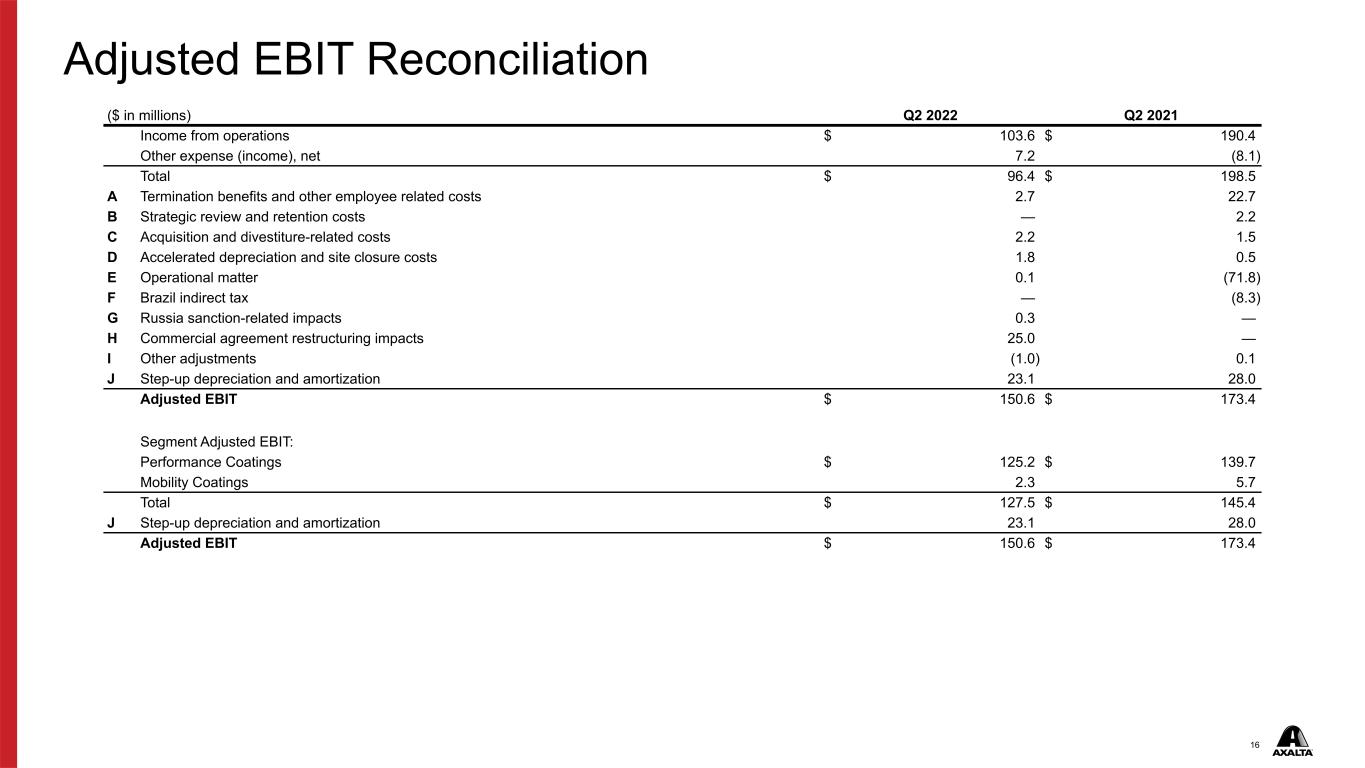
16 ($ in millions) Q2 2022 Q2 2021 Income from operations $ 103.6 $ 190.4 Other expense (income), net 7.2 (8.1) Total $ 96.4 $ 198.5 A Termination benefits and other employee related costs 2.7 22.7 B Strategic review and retention costs — 2.2 C Acquisition and divestiture-related costs 2.2 1.5 D Accelerated depreciation and site closure costs 1.8 0.5 E Operational matter 0.1 (71.8) F Brazil indirect tax — (8.3) G Russia sanction-related impacts 0.3 — H Commercial agreement restructuring impacts 25.0 — I Other adjustments (1.0) 0.1 J Step-up depreciation and amortization 23.1 28.0 Adjusted EBIT $ 150.6 $ 173.4 Segment Adjusted EBIT: Performance Coatings $ 125.2 $ 139.7 Mobility Coatings 2.3 5.7 Total $ 127.5 $ 145.4 J Step-up depreciation and amortization 23.1 28.0 Adjusted EBIT $ 150.6 $ 173.4 Adjusted EBIT Reconciliation
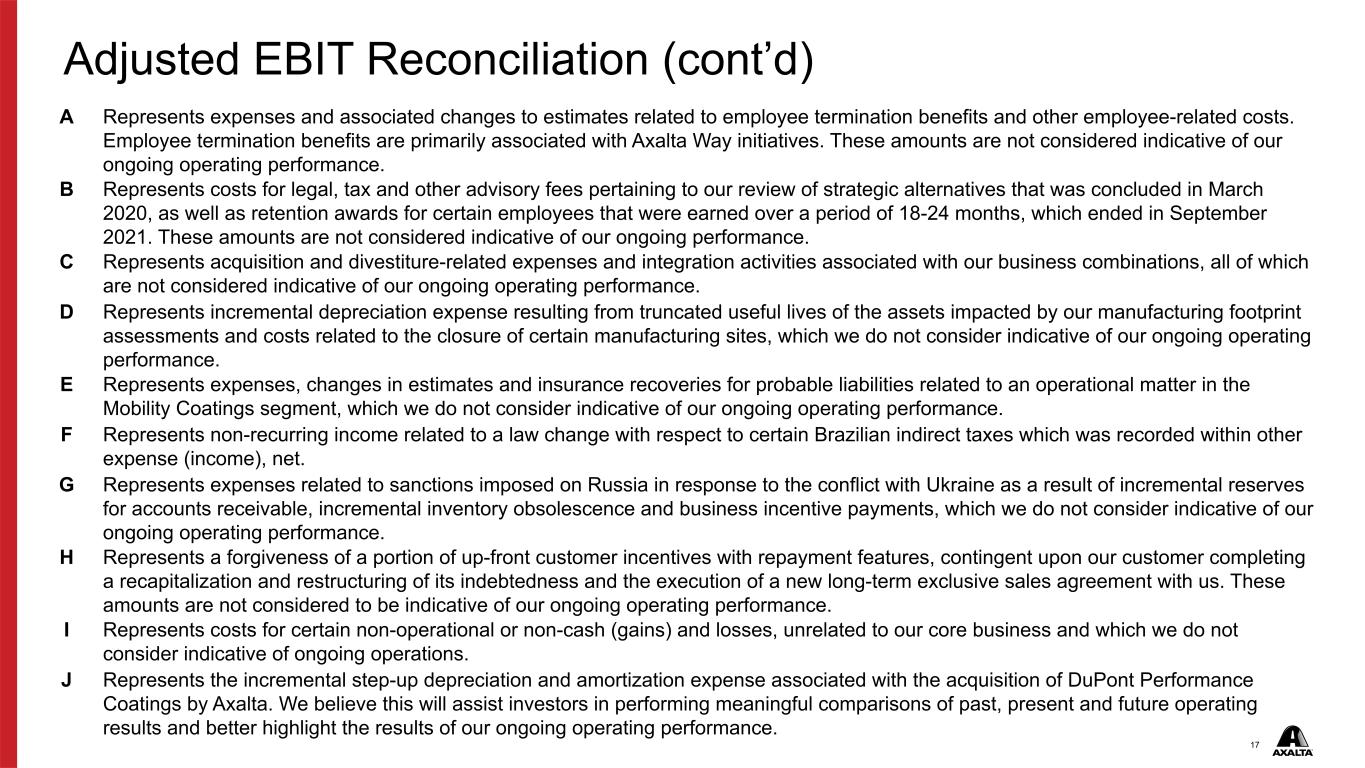
17 A Represents expenses and associated changes to estimates related to employee termination benefits and other employee-related costs. Employee termination benefits are primarily associated with Axalta Way initiatives. These amounts are not considered indicative of our ongoing operating performance. B Represents costs for legal, tax and other advisory fees pertaining to our review of strategic alternatives that was concluded in March 2020, as well as retention awards for certain employees that were earned over a period of 18-24 months, which ended in September 2021. These amounts are not considered indicative of our ongoing performance. C Represents acquisition and divestiture-related expenses and integration activities associated with our business combinations, all of which are not considered indicative of our ongoing operating performance. D Represents incremental depreciation expense resulting from truncated useful lives of the assets impacted by our manufacturing footprint assessments and costs related to the closure of certain manufacturing sites, which we do not consider indicative of our ongoing operating performance. E Represents expenses, changes in estimates and insurance recoveries for probable liabilities related to an operational matter in the Mobility Coatings segment, which we do not consider indicative of our ongoing operating performance. F Represents non-recurring income related to a law change with respect to certain Brazilian indirect taxes which was recorded within other expense (income), net. G Represents expenses related to sanctions imposed on Russia in response to the conflict with Ukraine as a result of incremental reserves for accounts receivable, incremental inventory obsolescence and business incentive payments, which we do not consider indicative of our ongoing operating performance. H Represents a forgiveness of a portion of up-front customer incentives with repayment features, contingent upon our customer completing a recapitalization and restructuring of its indebtedness and the execution of a new long-term exclusive sales agreement with us. These amounts are not considered to be indicative of our ongoing operating performance. I Represents costs for certain non-operational or non-cash (gains) and losses, unrelated to our core business and which we do not consider indicative of ongoing operations. J Represents the incremental step-up depreciation and amortization expense associated with the acquisition of DuPont Performance Coatings by Axalta. We believe this will assist investors in performing meaningful comparisons of past, present and future operating results and better highlight the results of our ongoing operating performance. Adjusted EBIT Reconciliation (cont’d)
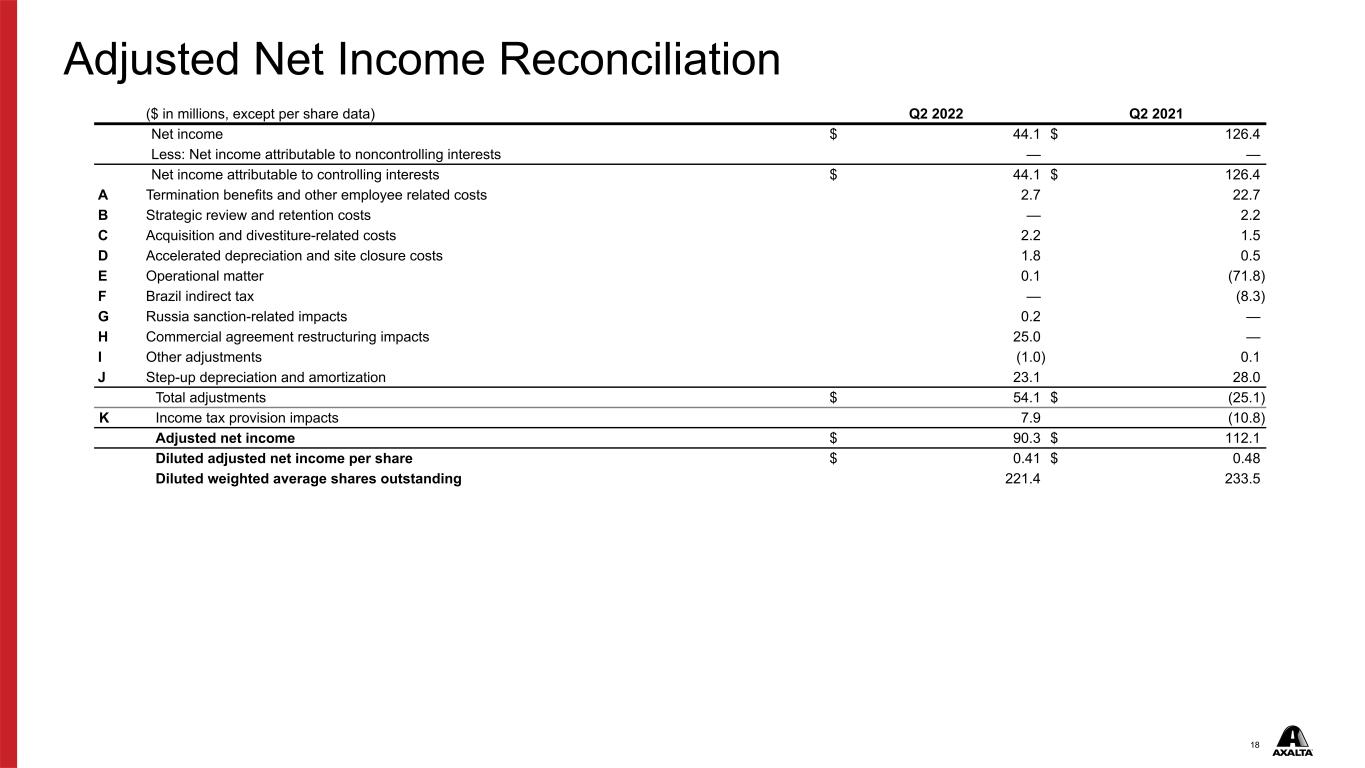
18 ($ in millions, except per share data) Q2 2022 Q2 2021 Net income $ 44.1 $ 126.4 Less: Net income attributable to noncontrolling interests — — Net income attributable to controlling interests $ 44.1 $ 126.4 A Termination benefits and other employee related costs 2.7 22.7 B Strategic review and retention costs — 2.2 C Acquisition and divestiture-related costs 2.2 1.5 D Accelerated depreciation and site closure costs 1.8 0.5 E Operational matter 0.1 (71.8) F Brazil indirect tax — (8.3) G Russia sanction-related impacts 0.2 — H Commercial agreement restructuring impacts 25.0 — I Other adjustments (1.0) 0.1 J Step-up depreciation and amortization 23.1 28.0 Total adjustments $ 54.1 $ (25.1) K Income tax provision impacts 7.9 (10.8) Adjusted net income $ 90.3 $ 112.1 Diluted adjusted net income per share $ 0.41 $ 0.48 Diluted weighted average shares outstanding 221.4 233.5 Adjusted Net Income Reconciliation
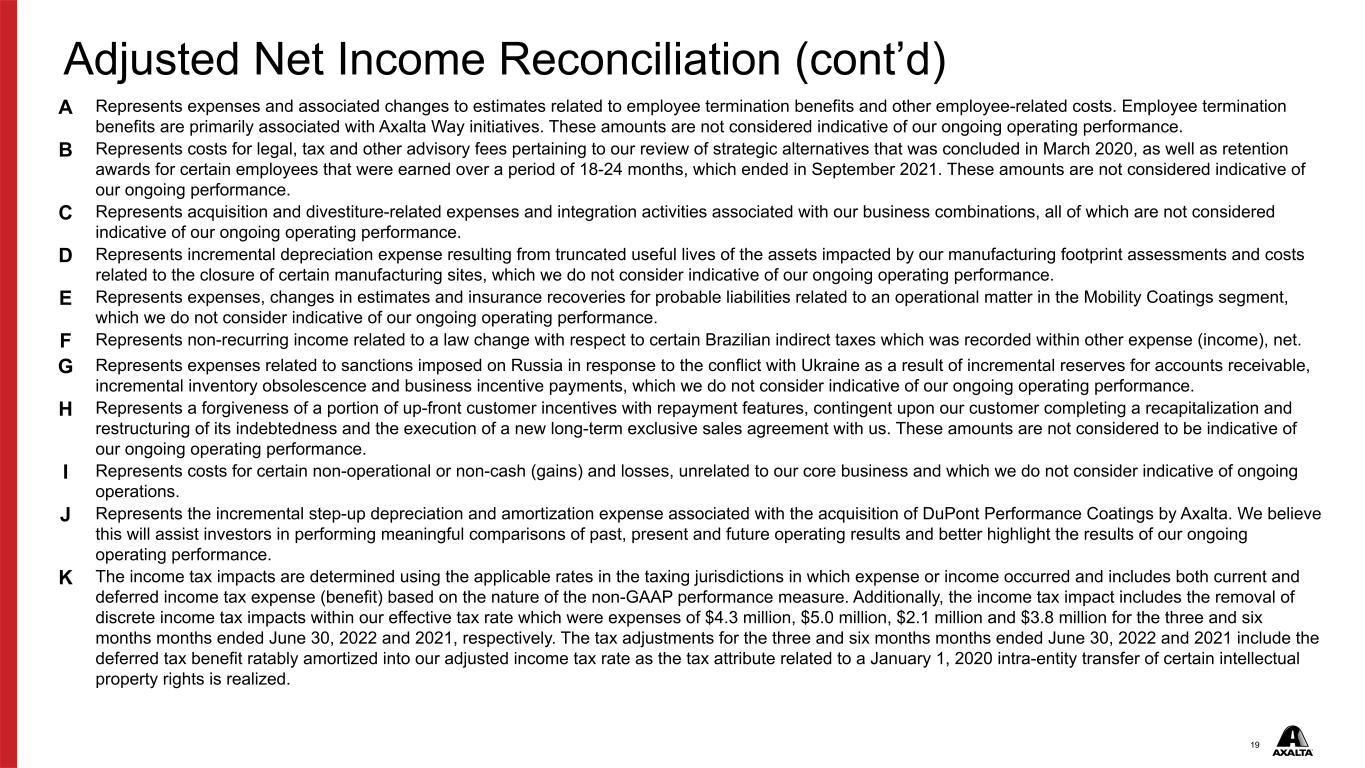
19 A Represents expenses and associated changes to estimates related to employee termination benefits and other employee-related costs. Employee termination benefits are primarily associated with Axalta Way initiatives. These amounts are not considered indicative of our ongoing operating performance. B Represents costs for legal, tax and other advisory fees pertaining to our review of strategic alternatives that was concluded in March 2020, as well as retention awards for certain employees that were earned over a period of 18-24 months, which ended in September 2021. These amounts are not considered indicative of our ongoing performance. C Represents acquisition and divestiture-related expenses and integration activities associated with our business combinations, all of which are not considered indicative of our ongoing operating performance. D Represents incremental depreciation expense resulting from truncated useful lives of the assets impacted by our manufacturing footprint assessments and costs related to the closure of certain manufacturing sites, which we do not consider indicative of our ongoing operating performance. E Represents expenses, changes in estimates and insurance recoveries for probable liabilities related to an operational matter in the Mobility Coatings segment, which we do not consider indicative of our ongoing operating performance. F Represents non-recurring income related to a law change with respect to certain Brazilian indirect taxes which was recorded within other expense (income), net. G Represents expenses related to sanctions imposed on Russia in response to the conflict with Ukraine as a result of incremental reserves for accounts receivable, incremental inventory obsolescence and business incentive payments, which we do not consider indicative of our ongoing operating performance. H Represents a forgiveness of a portion of up-front customer incentives with repayment features, contingent upon our customer completing a recapitalization and restructuring of its indebtedness and the execution of a new long-term exclusive sales agreement with us. These amounts are not considered to be indicative of our ongoing operating performance. I Represents costs for certain non-operational or non-cash (gains) and losses, unrelated to our core business and which we do not consider indicative of ongoing operations. J Represents the incremental step-up depreciation and amortization expense associated with the acquisition of DuPont Performance Coatings by Axalta. We believe this will assist investors in performing meaningful comparisons of past, present and future operating results and better highlight the results of our ongoing operating performance. K The income tax impacts are determined using the applicable rates in the taxing jurisdictions in which expense or income occurred and includes both current and deferred income tax expense (benefit) based on the nature of the non-GAAP performance measure. Additionally, the income tax impact includes the removal of discrete income tax impacts within our effective tax rate which were expenses of $4.3 million, $5.0 million, $2.1 million and $3.8 million for the three and six months months ended June 30, 2022 and 2021, respectively. The tax adjustments for the three and six months months ended June 30, 2022 and 2021 include the deferred tax benefit ratably amortized into our adjusted income tax rate as the tax attribute related to a January 1, 2020 intra-entity transfer of certain intellectual property rights is realized. Adjusted Net Income Reconciliation (cont’d)
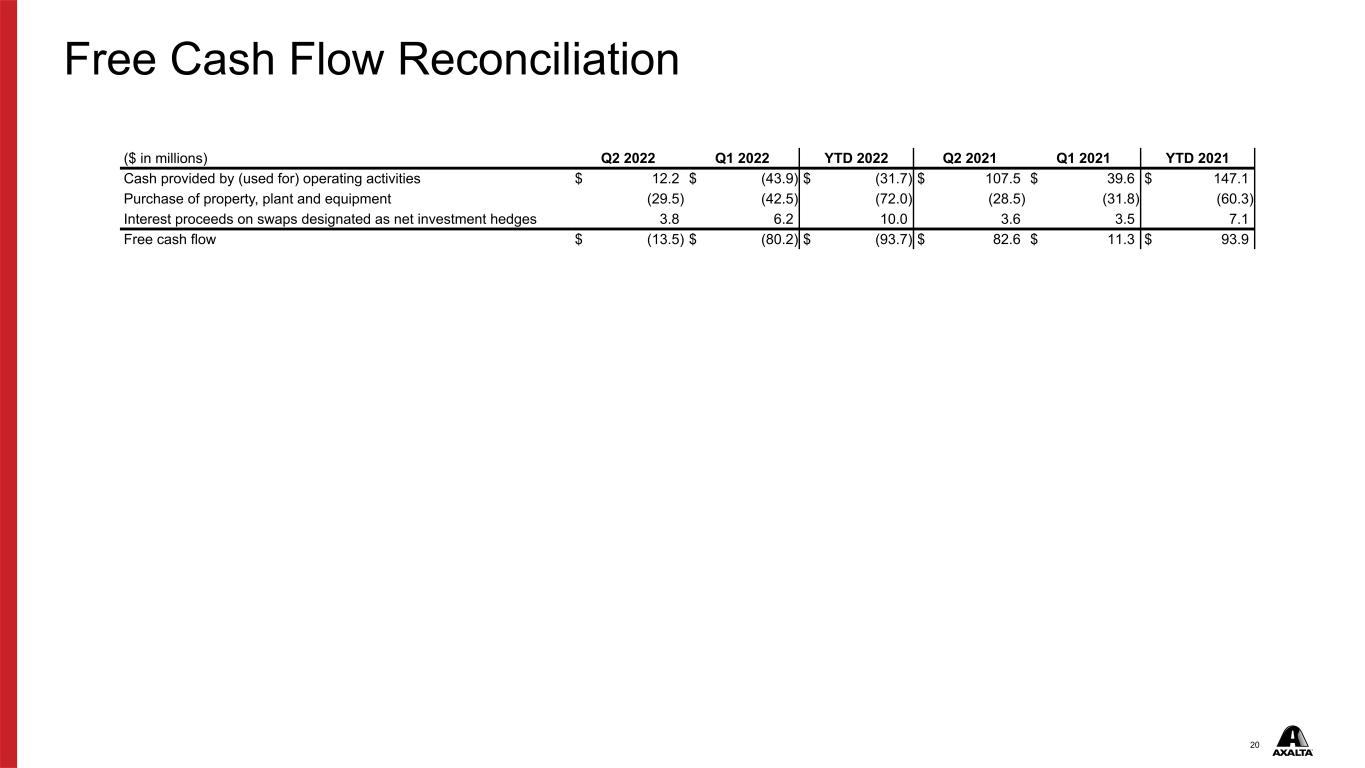
20 ($ in millions) Q2 2022 Q1 2022 YTD 2022 Q2 2021 Q1 2021 YTD 2021 Cash provided by (used for) operating activities $ 12.2 $ (43.9) $ (31.7) $ 107.5 $ 39.6 $ 147.1 Purchase of property, plant and equipment (29.5) (42.5) (72.0) (28.5) (31.8) (60.3) Interest proceeds on swaps designated as net investment hedges 3.8 6.2 10.0 3.6 3.5 7.1 Free cash flow $ (13.5) $ (80.2) $ (93.7) $ 82.6 $ 11.3 $ 93.9 Free Cash Flow Reconciliation
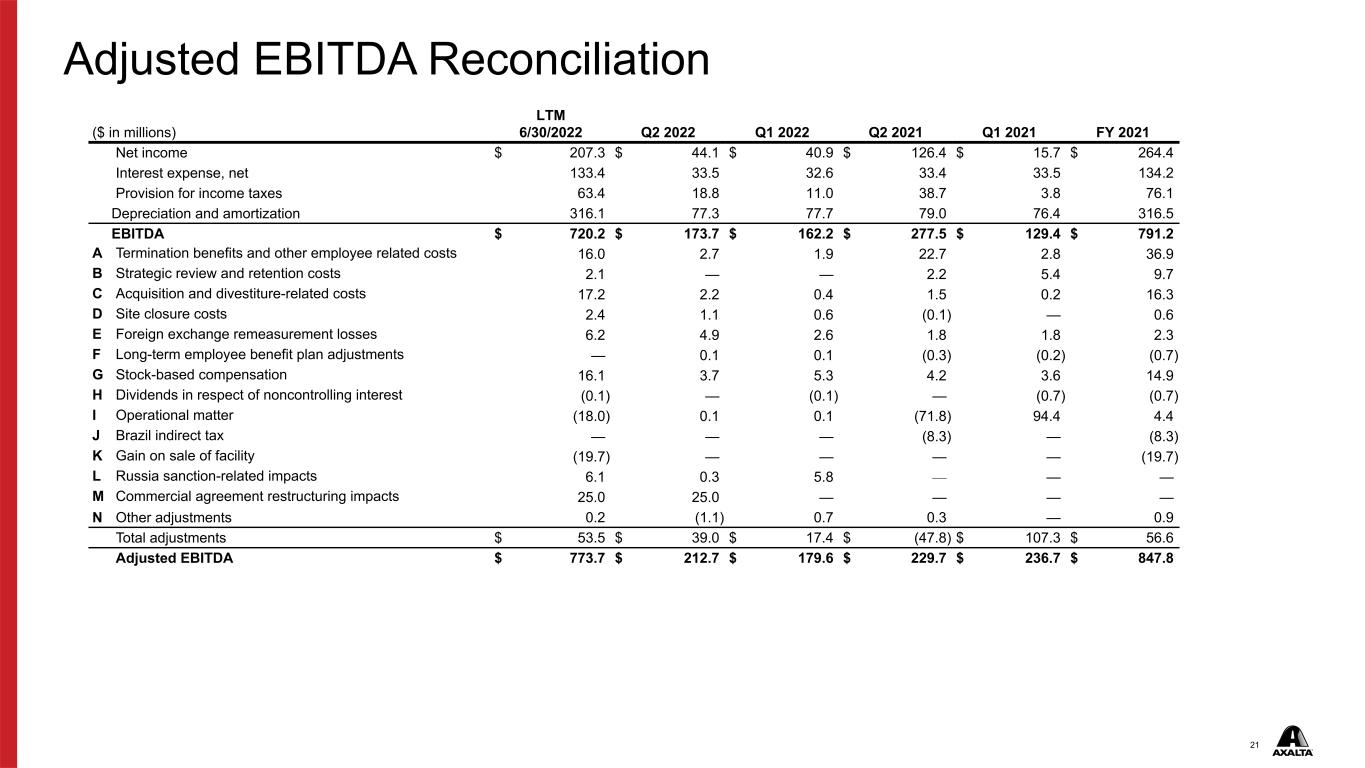
21 ($ in millions) LTM 6/30/2022 Q2 2022 Q1 2022 Q2 2021 Q1 2021 FY 2021 Net income $ 207.3 $ 44.1 $ 40.9 $ 126.4 $ 15.7 $ 264.4 Interest expense, net 133.4 33.5 32.6 33.4 33.5 134.2 Provision for income taxes 63.4 18.8 11.0 38.7 3.8 76.1 Depreciation and amortization 316.1 77.3 77.7 79.0 76.4 316.5 EBITDA $ 720.2 $ 173.7 $ 162.2 $ 277.5 $ 129.4 $ 791.2 A Termination benefits and other employee related costs 16.0 2.7 1.9 22.7 2.8 36.9 B Strategic review and retention costs 2.1 — — 2.2 5.4 9.7 C Acquisition and divestiture-related costs 17.2 2.2 0.4 1.5 0.2 16.3 D Site closure costs 2.4 1.1 0.6 (0.1) — 0.6 E Foreign exchange remeasurement losses 6.2 4.9 2.6 1.8 1.8 2.3 F Long-term employee benefit plan adjustments — 0.1 0.1 (0.3) (0.2) (0.7) G Stock-based compensation 16.1 3.7 5.3 4.2 3.6 14.9 H Dividends in respect of noncontrolling interest (0.1) — (0.1) — (0.7) (0.7) I Operational matter (18.0) 0.1 0.1 (71.8) 94.4 4.4 J Brazil indirect tax — — — (8.3) — (8.3) K Gain on sale of facility (19.7) — — — — (19.7) L Russia sanction-related impacts 6.1 0.3 5.8 — — — M Commercial agreement restructuring impacts 25.0 25.0 — — — — N Other adjustments 0.2 (1.1) 0.7 0.3 — 0.9 Total adjustments $ 53.5 $ 39.0 $ 17.4 $ (47.8) $ 107.3 $ 56.6 Adjusted EBITDA $ 773.7 $ 212.7 $ 179.6 $ 229.7 $ 236.7 $ 847.8 Adjusted EBITDA Reconciliation
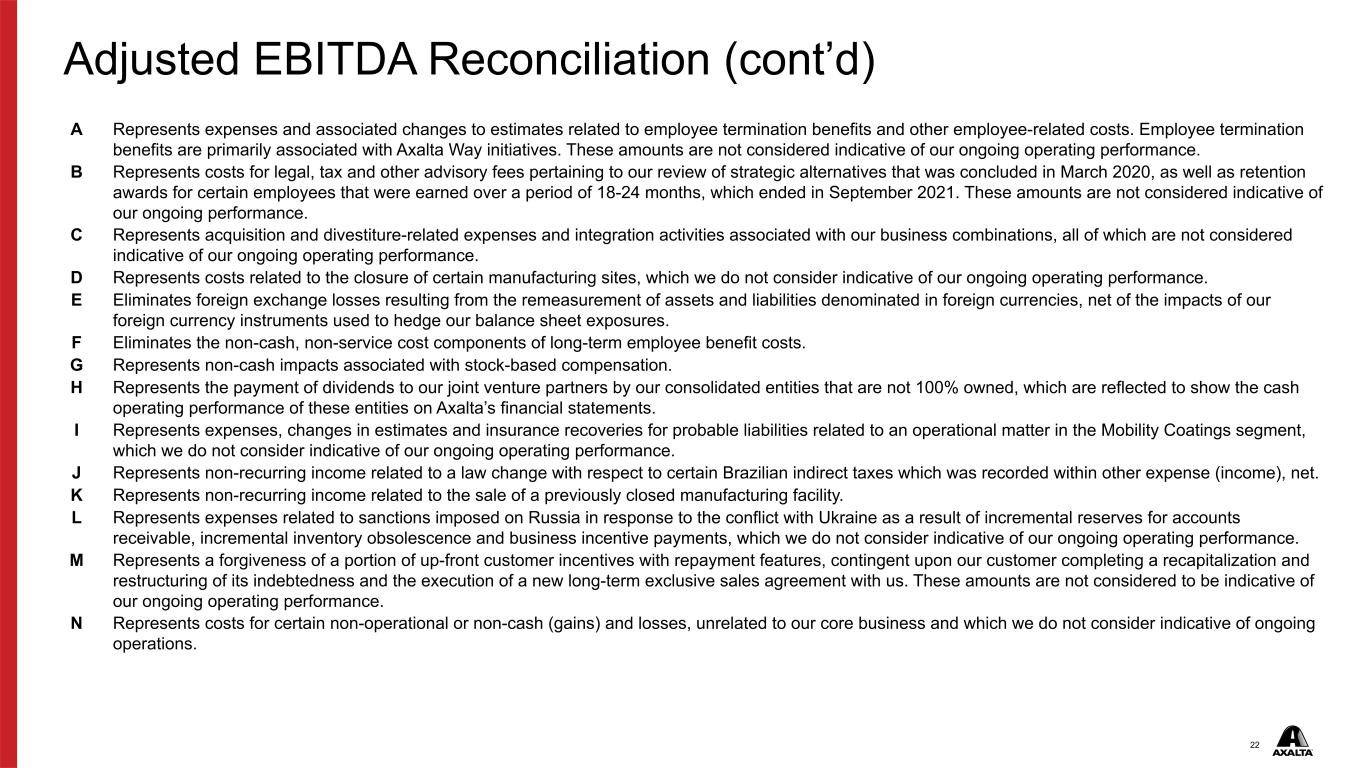
22 A Represents expenses and associated changes to estimates related to employee termination benefits and other employee-related costs. Employee termination benefits are primarily associated with Axalta Way initiatives. These amounts are not considered indicative of our ongoing operating performance. B Represents costs for legal, tax and other advisory fees pertaining to our review of strategic alternatives that was concluded in March 2020, as well as retention awards for certain employees that were earned over a period of 18-24 months, which ended in September 2021. These amounts are not considered indicative of our ongoing performance. C Represents acquisition and divestiture-related expenses and integration activities associated with our business combinations, all of which are not considered indicative of our ongoing operating performance. D Represents costs related to the closure of certain manufacturing sites, which we do not consider indicative of our ongoing operating performance. E Eliminates foreign exchange losses resulting from the remeasurement of assets and liabilities denominated in foreign currencies, net of the impacts of our foreign currency instruments used to hedge our balance sheet exposures. F Eliminates the non-cash, non-service cost components of long-term employee benefit costs. G Represents non-cash impacts associated with stock-based compensation. H Represents the payment of dividends to our joint venture partners by our consolidated entities that are not 100% owned, which are reflected to show the cash operating performance of these entities on Axalta’s financial statements. I Represents expenses, changes in estimates and insurance recoveries for probable liabilities related to an operational matter in the Mobility Coatings segment, which we do not consider indicative of our ongoing operating performance. J Represents non-recurring income related to a law change with respect to certain Brazilian indirect taxes which was recorded within other expense (income), net. K Represents non-recurring income related to the sale of a previously closed manufacturing facility. L Represents expenses related to sanctions imposed on Russia in response to the conflict with Ukraine as a result of incremental reserves for accounts receivable, incremental inventory obsolescence and business incentive payments, which we do not consider indicative of our ongoing operating performance. M Represents a forgiveness of a portion of up-front customer incentives with repayment features, contingent upon our customer completing a recapitalization and restructuring of its indebtedness and the execution of a new long-term exclusive sales agreement with us. These amounts are not considered to be indicative of our ongoing operating performance. N Represents costs for certain non-operational or non-cash (gains) and losses, unrelated to our core business and which we do not consider indicative of ongoing operations. Adjusted EBITDA Reconciliation (cont’d)
23 Thank you Investor Relations Contact: Chris Evans Christopher.Evans@axalta.com 484-724-4099