EXHIBIT 99.2
Published on October 25, 2018
Exhibit 99.2 Q3 2018 Financial Results October 25, 2018
Legal Notices Forward-Looking Statements This presentation and the oral remarks made in connection herewith may contain “forward-looking statements” within the meaning of the U.S. Private Securities Litigation Reform Act of 1995, including those relating to our 2018 financial projections, which include net sales, net sales excluding FX, Adjusted EBITDA, interest expense, tax rate, as adjusted, free cash flow, capital expenditures, depreciation and amortization, diluted shares outstanding, contributions from acquisitions, and related assumptions. Any forward-looking statements involve risks, uncertainties and assumptions. These statements often include words such as “believe,” “expect,” “anticipate,” “intend,” “plan,” “estimate,” “target,” “project,” “forecast,” “seek,” “will,” “may,” “should,” “could,” “would,” or similar expressions. These statements are based on certain assumptions that we have made in light of our experience in the industry and our perceptions of historical trends, current conditions, expected future developments and other factors we believe are appropriate under the circumstances as of the date hereof. Although we believe that the assumptions and analysis underlying these statements are reasonable as of the date hereof, investors are cautioned not to place undue reliance on these statements. We do not have any obligation to and do not intend to update any forward-looking statements included herein, which speak only as of the date hereof. You should understand that these statements are not guarantees of future performance or results. Actual results could differ materially from those described in any forward-looking statements contained herein or the oral remarks made in connection herewith as a result of a variety of factors, including known and unknown risks and uncertainties, many of which are beyond our control including, but not limited to, the risks and uncertainties described in "Non-GAAP Financial Measures," and "Forward-Looking Statements" as well as "Risk Factors" in our Annual Report on Form 10-K for the year ended December 31, 2017 and our Quarterly Reports on Form 10-Q for the quarters ended March 31, 2018 and June 30, 2018. Non-GAAP Financial Measures The historical financial information included in this presentation includes financial information that is not presented in accordance with generally accepted accounting principles in the United States (“GAAP”), including net sales excluding FX, Adjusted Net Income, EBITDA, Adjusted EBITDA, Free Cash Flow, tax rate, as adjusted, and Net Debt. Management uses these non- GAAP financial measures in the analysis of our financial and operating performance because they assist in the evaluation of underlying trends in our business. Adjusted EBITDA consists of EBITDA adjusted for (i) non-cash items included within net income, (ii) items Axalta does not believe are indicative of ongoing operating performance or (iii) nonrecurring, unusual or infrequent items that have not occurred within the last two years or Axalta believes are not reasonably likely to recur within the next two years. We believe that making such adjustments provides investors meaningful information to understand our operating results and ability to analyze financial and business trends on a period-to-period basis. Adjusted net income shows the adjusted value of net income attributable to controlling interests after removing the items that are determined by management to be items that we do not consider indicative of our ongoing operating performance unusual or nonrecurring in nature. Our use of the terms net sales excluding FX, Adjusted Net Income, EBITDA, Adjusted EBITDA, Free Cash Flow, tax rate, as adjusted, and Net Debt may differ from that of others in our industry. Net sales excluding FX, Adjusted Net Income, EBITDA, Adjusted EBITDA and Free Cash Flow should not be considered as alternatives to net sales, net income, operating income or any other performance measures derived in accordance with GAAP as measures of operating performance or operating cash flows or as measures of liquidity. Net sales excluding FX, Adjusted Net Income, EBITDA, Adjusted EBITDA, Free Cash Flow, tax rate, as adjusted, and Net Debt have important limitations as analytical tools and should be considered in conjunction with, and not as substitutes for, our results as reported under GAAP. This presentation includes a reconciliation of certain non-GAAP financial measures with the most directly comparable financial measures calculated in accordance with GAAP. Axalta does not provide a reconciliation for non-GAAP estimates for net sales excluding FX, Adjusted Net Income, EBITDA, Adjusted EBITDA, Free Cash Flow or tax rate, as adjusted, on a forward-looking basis because the information necessary to calculate a meaningful or accurate estimation of reconciling items is not available without unreasonable effort. For example, such reconciling items include the impact of foreign currency exchange gains or losses, gains or losses that are unusual or nonrecurring in nature, as well as discrete taxable events. We cannot estimate or project those items and they may have a substantial and unpredictable impact on our GAAP results. Segment Financial Measures The primary measure of segment operating performance is Adjusted EBITDA, which is a key metric that is used by management to evaluate business performance in comparison to budgets, forecasts and prior year financial results, providing a measure that management believes reflects Axalta’s core operating performance. As we do not measure segment operating performance based on Net Income, a reconciliation of this non-GAAP financial measure with the most directly comparable financial measure calculated in accordance with GAAP is not available. Defined Terms All capitalized terms contained within this presentation have been previously defined in our filings with the United States Securities and Exchange Commission. Rounding Due to rounding the tables presented may not foot. PROPRIETARY 2
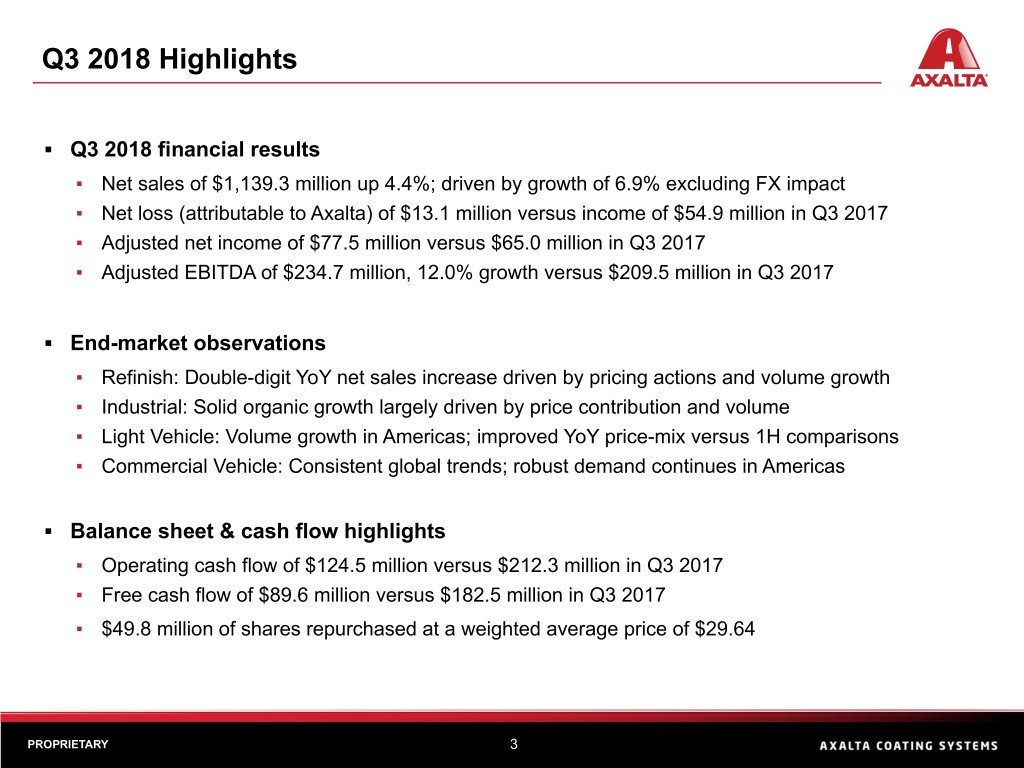
Q3 2018 Highlights ▪ Q3 2018 financial results ▪ Net sales of $1,139.3 million up 4.4%; driven by growth of 6.9% excluding FX impact ▪ Net loss (attributable to Axalta) of $13.1 million versus income of $54.9 million in Q3 2017 ▪ Adjusted net income of $77.5 million versus $65.0 million in Q3 2017 ▪ Adjusted EBITDA of $234.7 million, 12.0% growth versus $209.5 million in Q3 2017 ▪ End-market observations ▪ Refinish: Double-digit YoY net sales increase driven by pricing actions and volume growth ▪ Industrial: Solid organic growth largely driven by price contribution and volume ▪ Light Vehicle: Volume growth in Americas; improved YoY price-mix versus 1H comparisons ▪ Commercial Vehicle: Consistent global trends; robust demand continues in Americas ▪ Balance sheet & cash flow highlights ▪ Operating cash flow of $124.5 million versus $212.3 million in Q3 2017 ▪ Free cash flow of $89.6 million versus $182.5 million in Q3 2017 ▪ $49.8 million of shares repurchased at a weighted average price of $29.64 PROPRIETARY 3
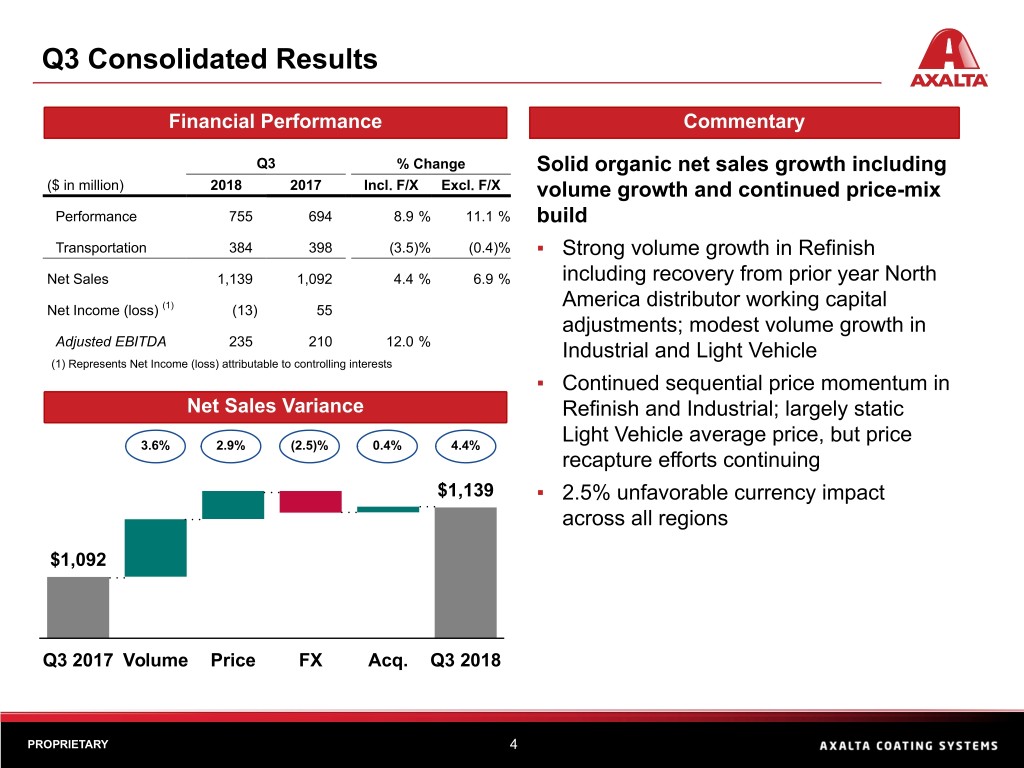
Q3 Consolidated Results Financial Performance Commentary Q3 % Change Solid organic net sales growth including ($ in million) 2018 2017 Incl. F/X Excl. F/X volume growth and continued price-mix Performance 755 694 8.9 % 11.1 % build Transportation 384 398 (3.5)% (0.4)% ▪ Strong volume growth in Refinish Net Sales 1,139 1,092 4.4 % 6.9 % including recovery from prior year North (1) America distributor working capital Net Income (loss) (13) 55 adjustments; modest volume growth in Adjusted EBITDA 235 210 12.0 % Industrial and Light Vehicle (1) Represents Net Income (loss) attributable to controlling interests ▪ Continued sequential price momentum in Net Sales Variance Refinish and Industrial; largely static Light Vehicle average price, but price 3.6% 2.9% (2.5)% 0.4% 4.4% recapture efforts continuing $1,139 ▪ 2.5% unfavorable currency impact across all regions $1,092 Q3 2017 Volume Price FX Acq. Q3 2018 PROPRIETARY 4
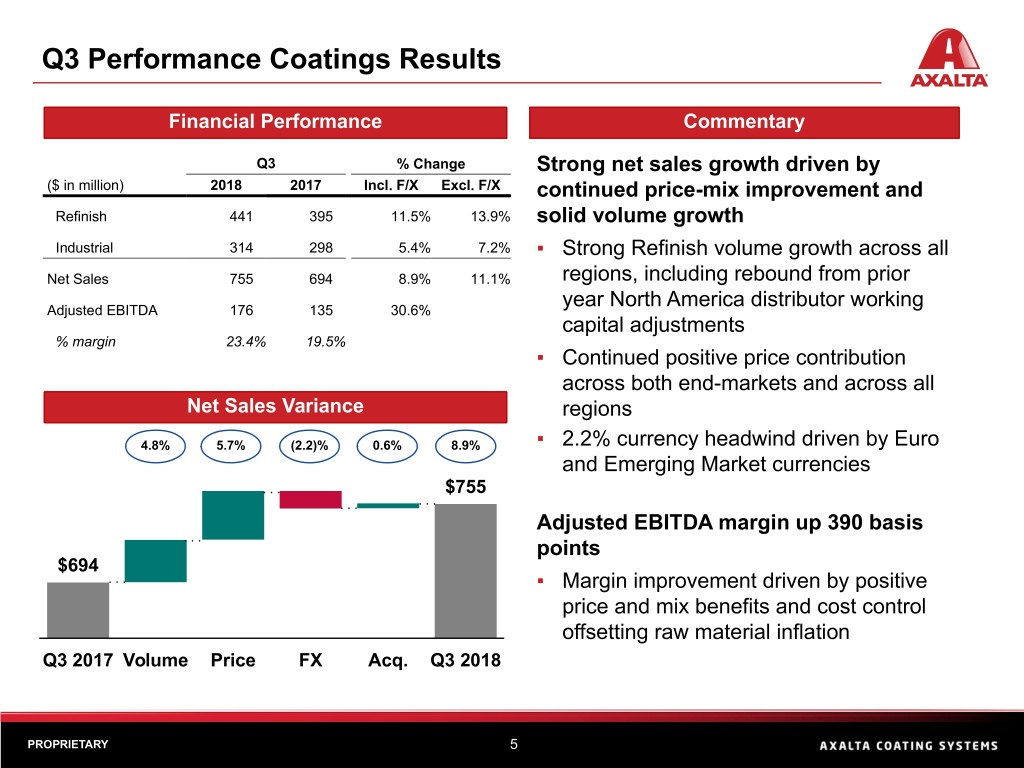
Q3 Performance Coatings Results Financial Performance Commentary Q3 % Change Strong net sales growth driven by ($ in million) 2018 2017 Incl. F/X Excl. F/X continued price-mix improvement and Refinish 441 395 11.5% 13.9% solid volume growth Industrial 314 298 5.4% 7.2% ▪ Strong Refinish volume growth across all Net Sales 755 694 8.9% 11.1% regions, including rebound from prior year North America distributor working Adjusted EBITDA 176 135 30.6% capital adjustments % margin 23.4% 19.5% ▪ Continued positive price contribution across both end-markets and across all Net Sales Variance regions 4.8% 5.7% (2.2)% 0.6% 8.9% ▪ 2.2% currency headwind driven by Euro and Emerging Market currencies $755 Adjusted EBITDA margin up 390 basis points $694 ▪ Margin improvement driven by positive price and mix benefits and cost control offsetting raw material inflation Q3 2017 Volume Price FX Acq. Q3 2018 PROPRIETARY 5
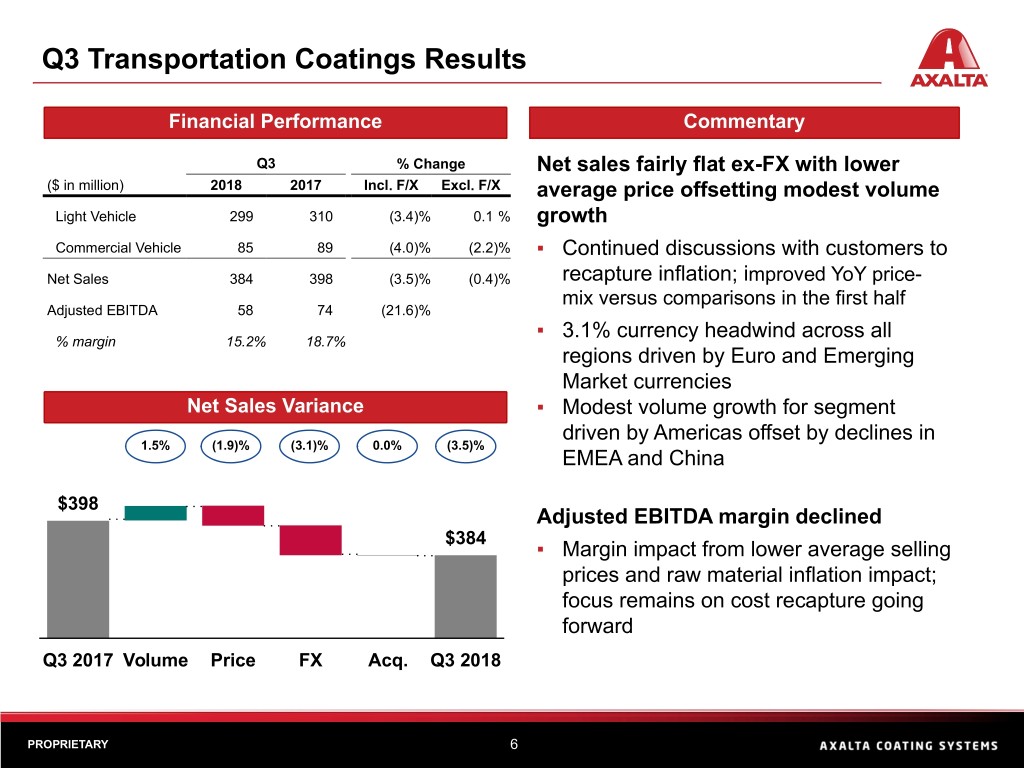
Q3 Transportation Coatings Results Financial Performance Commentary Q3 % Change Net sales fairly flat ex-FX with lower ($ in million) 2018 2017 Incl. F/X Excl. F/X average price offsetting modest volume Light Vehicle 299 310 (3.4)% 0.1 % growth Commercial Vehicle 85 89 (4.0)% (2.2)% ▪ Continued discussions with customers to Net Sales 384 398 (3.5)% (0.4)% recapture inflation; improved YoY price- mix versus comparisons in the first half Adjusted EBITDA 58 74 (21.6)% ▪ 3.1% currency headwind across all % margin 15.2% 18.7% regions driven by Euro and Emerging Market currencies Net Sales Variance ▪ Modest volume growth for segment driven by Americas offset by declines in 1.5% (1.9)% (3.1)% 0.0% (3.5)% EMEA and China $398 Adjusted EBITDA margin declined $384 ▪ Margin impact from lower average selling prices and raw material inflation impact; focus remains on cost recapture going forward Q3 2017 Volume Price FX Acq. Q3 2018 PROPRIETARY 6
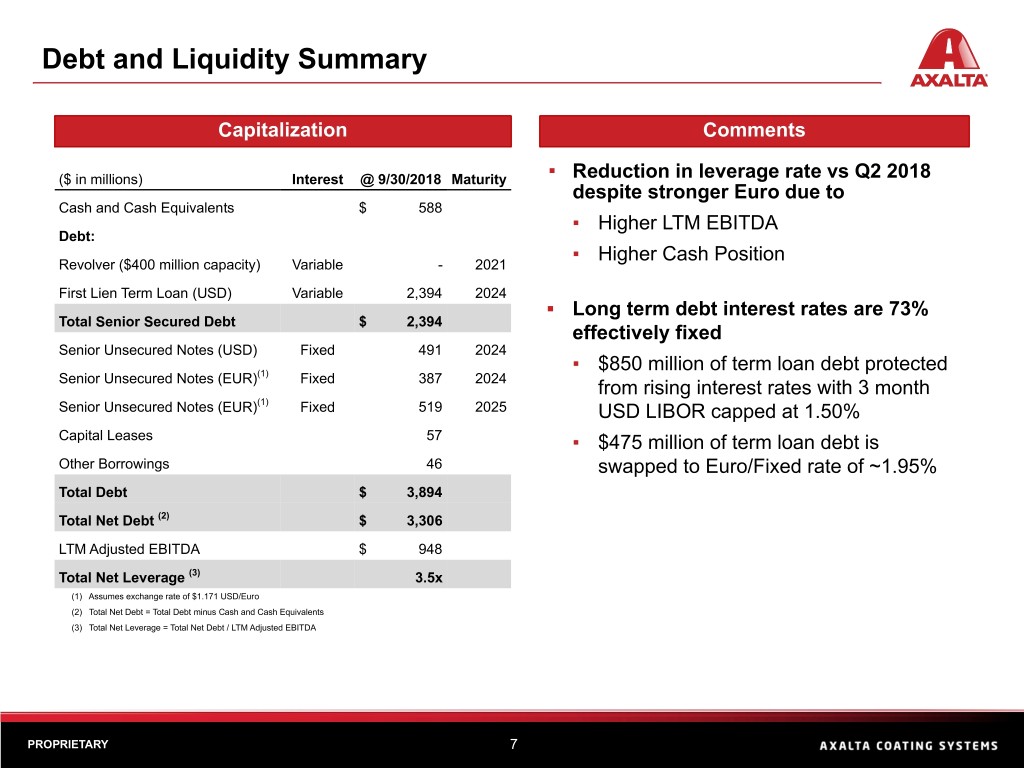
Debt and Liquidity Summary Capitalization Comments ($ in millions) Interest @ 9/30/2018 Maturity ▪ Reduction in leverage rate vs Q2 2018 despite stronger Euro due to Cash and Cash Equivalents $ 588 ▪ Higher LTM EBITDA Debt: ▪ Higher Cash Position Revolver ($400 million capacity) Variable - 2021 First Lien Term Loan (USD) Variable 2,394 2024 ▪ Long term debt interest rates are 73% Total Senior Secured Debt $ 2,394 effectively fixed Senior Unsecured Notes (USD) Fixed 491 2024 (1) ▪ $850 million of term loan debt protected Senior Unsecured Notes (EUR) Fixed 387 2024 from rising interest rates with 3 month (1) Senior Unsecured Notes (EUR) Fixed 519 2025 USD LIBOR capped at 1.50% Capital Leases 57 ▪ $475 million of term loan debt is Other Borrowings 46 swapped to Euro/Fixed rate of ~1.95% Total Debt $ 3,894 Total Net Debt (2) $ 3,306 LTM Adjusted EBITDA $ 948 Total Net Leverage (3) 3.5x (1) Assumes exchange rate of $1.171 USD/Euro (2) Total Net Debt = Total Debt minus Cash and Cash Equivalents (3) Total Net Leverage = Total Net Debt / LTM Adjusted EBITDA PROPRIETARY 7
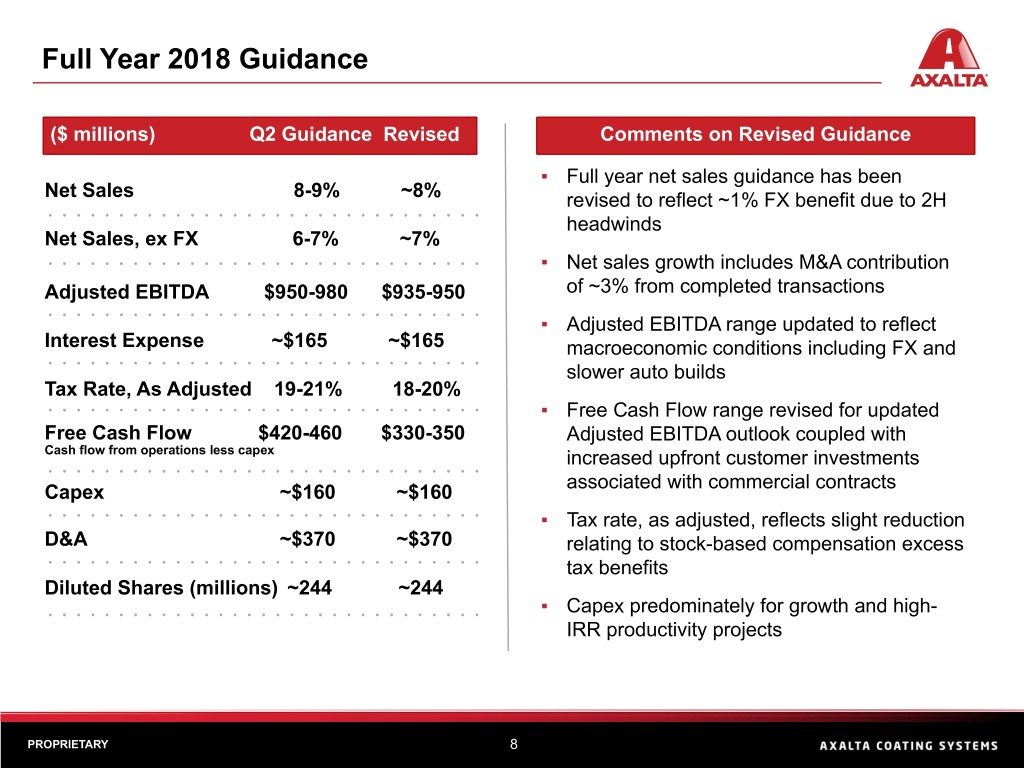
Full Year 2018 Guidance ($ millions) Q2 Guidance Revised Comments on Revised Guidance ▪ Full year net sales guidance has been Net Sales 8-9% ~8% revised to reflect ~1% FX benefit due to 2H headwinds Net Sales, ex FX 6-7% ~7% ▪ Net sales growth includes M&A contribution Adjusted EBITDA $950-980 $935-950 of ~3% from completed transactions ▪ Adjusted EBITDA range updated to reflect Interest Expense ~$165 ~$165 macroeconomic conditions including FX and slower auto builds Tax Rate, As Adjusted 19-21% 18-20% ▪ Free Cash Flow range revised for updated Free Cash Flow $420-460 $330-350 Adjusted EBITDA outlook coupled with Cash flow from operations less capex increased upfront customer investments associated with commercial contracts Capex ~$160 ~$160 ▪ Tax rate, as adjusted, reflects slight reduction D&A ~$370 ~$370 relating to stock-based compensation excess tax benefits Diluted Shares (millions) ~244 ~244 ▪ Capex predominately for growth and high- IRR productivity projects PROPRIETARY 8
Appendix
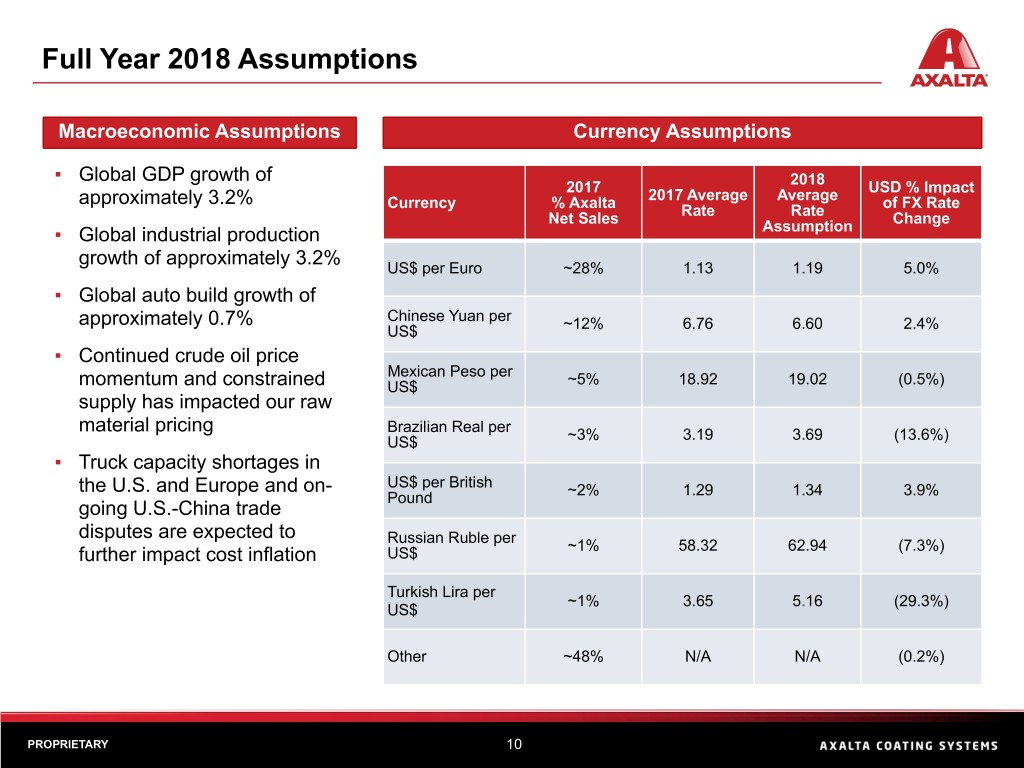
Full Year 2018 Assumptions Macroeconomic Assumptions Currency Assumptions ▪ Global GDP growth of 2017 2018 USD % Impact approximately 3.2% Currency % Axalta 2017 Average Average of FX Rate Net Sales Rate Rate Change ▪ Global industrial production Assumption growth of approximately 3.2% US$ per Euro ~28% 1.13 1.19 5.0% ▪ Global auto build growth of approximately 0.7% Chinese Yuan per US$ ~12% 6.76 6.60 2.4% ▪ Continued crude oil price Mexican Peso per momentum and constrained US$ ~5% 18.92 19.02 (0.5%) supply has impacted our raw material pricing Brazilian Real per US$ ~3% 3.19 3.69 (13.6%) ▪ Truck capacity shortages in the U.S. and Europe and on- US$ per British Pound ~2% 1.29 1.34 3.9% going U.S.-China trade disputes are expected to Russian Ruble per further impact cost inflation US$ ~1% 58.32 62.94 (7.3%) Turkish Lira per ~1% 3.65 5.16 (29.3%) US$ Other ~48% N/A N/A (0.2%) PROPRIETARY 10
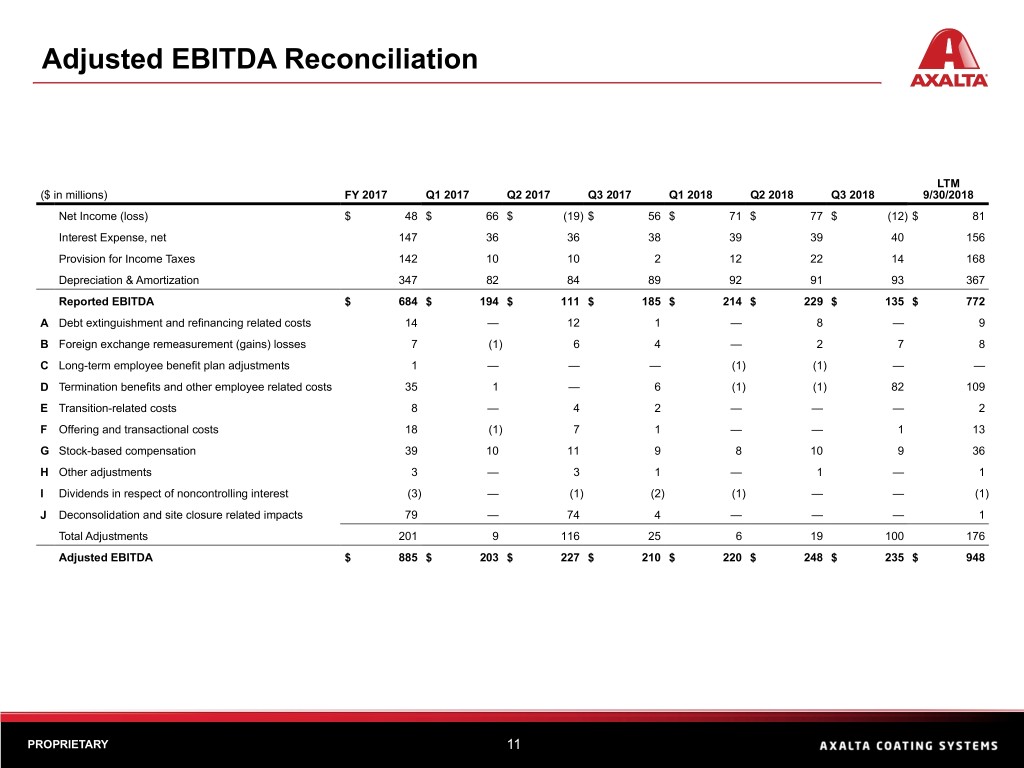
Adjusted EBITDA Reconciliation LTM ($ in millions) FY 2017 Q1 2017 Q2 2017 Q3 2017 Q1 2018 Q2 2018 Q3 2018 9/30/2018 Net Income (loss) $ 48 $ 66 $ (19) $ 56 $ 71 $ 77 $ (12) $ 81 Interest Expense, net 147 36 36 38 39 39 40 156 Provision for Income Taxes 142 10 10 2 12 22 14 168 Depreciation & Amortization 347 82 84 89 92 91 93 367 Reported EBITDA $ 684 $ 194 $ 111 $ 185 $ 214 $ 229 $ 135 $ 772 A Debt extinguishment and refinancing related costs 14 — 12 1 — 8 — 9 B Foreign exchange remeasurement (gains) losses 7 (1) 6 4 — 2 7 8 C Long-term employee benefit plan adjustments 1 — — — (1) (1) — — D Termination benefits and other employee related costs 35 1 — 6 (1) (1) 82 109 E Transition-related costs 8 — 4 2 — — — 2 F Offering and transactional costs 18 (1) 7 1 — — 1 13 G Stock-based compensation 39 10 11 9 8 10 9 36 H Other adjustments 3 — 3 1 — 1 — 1 I Dividends in respect of noncontrolling interest (3) — (1) (2) (1) — — (1) J Deconsolidation and site closure related impacts 79 — 74 4 — — — 1 Total Adjustments 201 9 116 25 6 19 100 176 Adjusted EBITDA $ 885 $ 203 $ 227 $ 210 $ 220 $ 248 $ 235 $ 948 PROPRIETARY 11
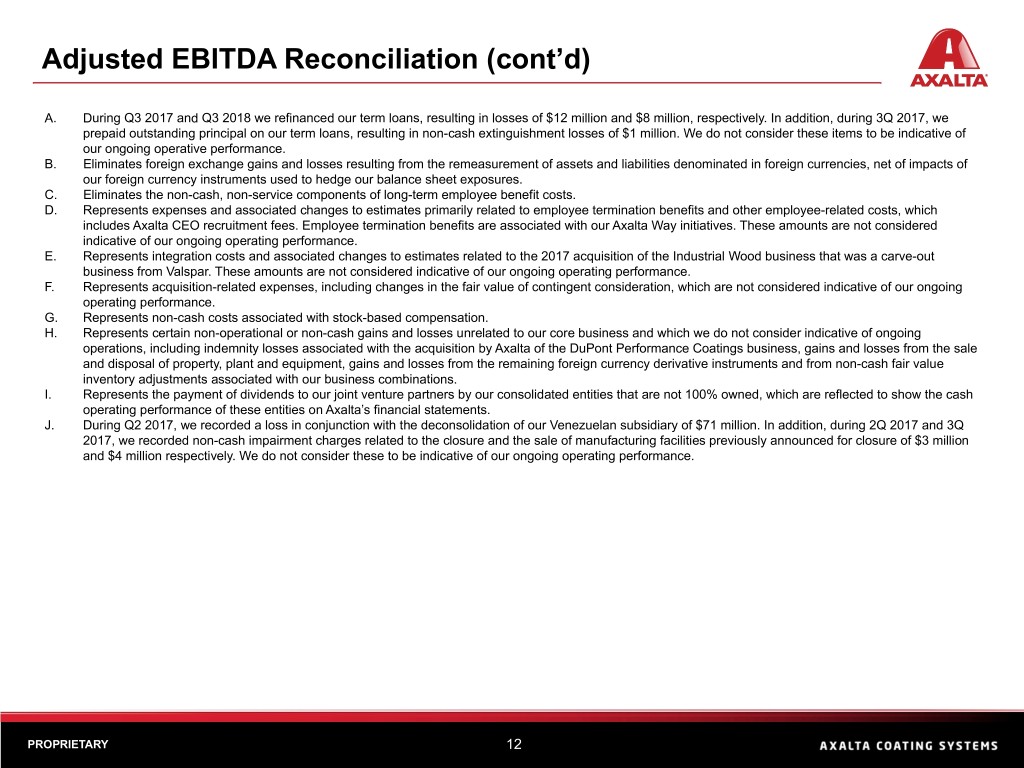
Adjusted EBITDA Reconciliation (cont’d) A. During Q3 2017 and Q3 2018 we refinanced our term loans, resulting in losses of $12 million and $8 million, respectively. In addition, during 3Q 2017, we prepaid outstanding principal on our term loans, resulting in non-cash extinguishment losses of $1 million. We do not consider these items to be indicative of our ongoing operative performance. B. Eliminates foreign exchange gains and losses resulting from the remeasurement of assets and liabilities denominated in foreign currencies, net of impacts of our foreign currency instruments used to hedge our balance sheet exposures. C. Eliminates the non-cash, non-service components of long-term employee benefit costs. D. Represents expenses and associated changes to estimates primarily related to employee termination benefits and other employee-related costs, which includes Axalta CEO recruitment fees. Employee termination benefits are associated with our Axalta Way initiatives. These amounts are not considered indicative of our ongoing operating performance. E. Represents integration costs and associated changes to estimates related to the 2017 acquisition of the Industrial Wood business that was a carve-out business from Valspar. These amounts are not considered indicative of our ongoing operating performance. F. Represents acquisition-related expenses, including changes in the fair value of contingent consideration, which are not considered indicative of our ongoing operating performance. G. Represents non-cash costs associated with stock-based compensation. H. Represents certain non-operational or non-cash gains and losses unrelated to our core business and which we do not consider indicative of ongoing operations, including indemnity losses associated with the acquisition by Axalta of the DuPont Performance Coatings business, gains and losses from the sale and disposal of property, plant and equipment, gains and losses from the remaining foreign currency derivative instruments and from non-cash fair value inventory adjustments associated with our business combinations. I. Represents the payment of dividends to our joint venture partners by our consolidated entities that are not 100% owned, which are reflected to show the cash operating performance of these entities on Axalta’s financial statements. J. During Q2 2017, we recorded a loss in conjunction with the deconsolidation of our Venezuelan subsidiary of $71 million. In addition, during 2Q 2017 and 3Q 2017, we recorded non-cash impairment charges related to the closure and the sale of manufacturing facilities previously announced for closure of $3 million and $4 million respectively. We do not consider these to be indicative of our ongoing operating performance. PROPRIETARY 12
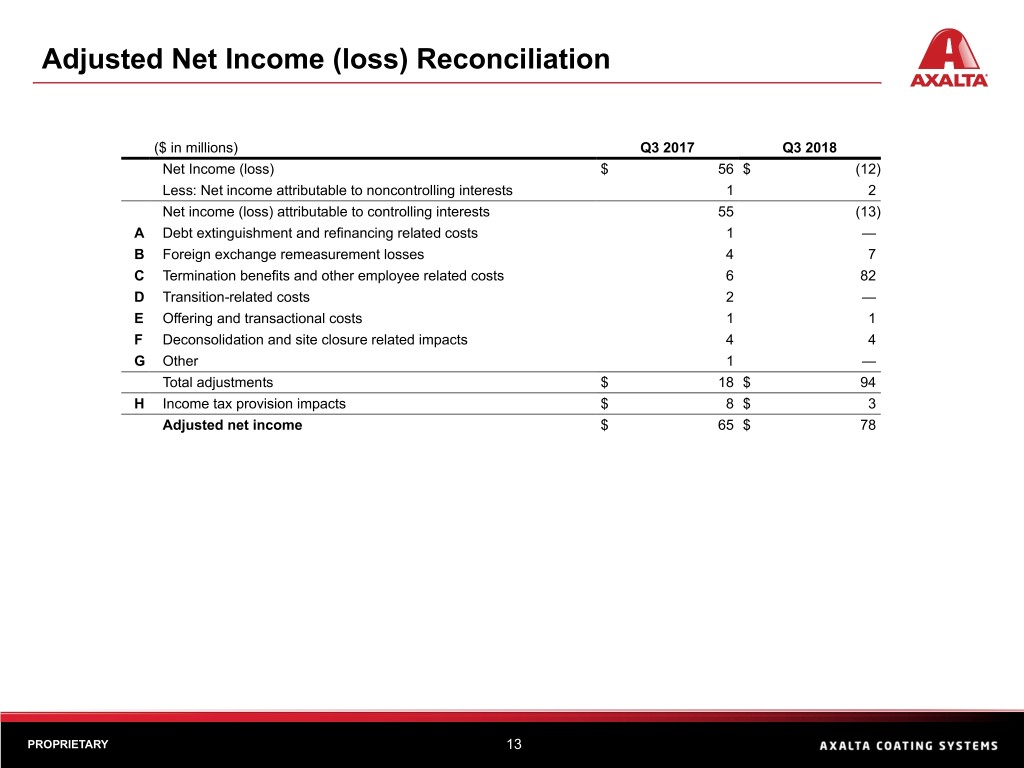
Adjusted Net Income (loss) Reconciliation ($ in millions) Q3 2017 Q3 2018 Net Income (loss) $ 56 $ (12) Less: Net income attributable to noncontrolling interests 1 2 Net income (loss) attributable to controlling interests 55 (13) A Debt extinguishment and refinancing related costs 1 — B Foreign exchange remeasurement losses 4 7 C Termination benefits and other employee related costs 6 82 D Transition-related costs 2 — E Offering and transactional costs 1 1 F Deconsolidation and site closure related impacts 4 4 G Other 1 — Total adjustments $ 18 $ 94 H Income tax provision impacts $ 8 $ 3 Adjusted net income $ 65 $ 78 PROPRIETARY 13
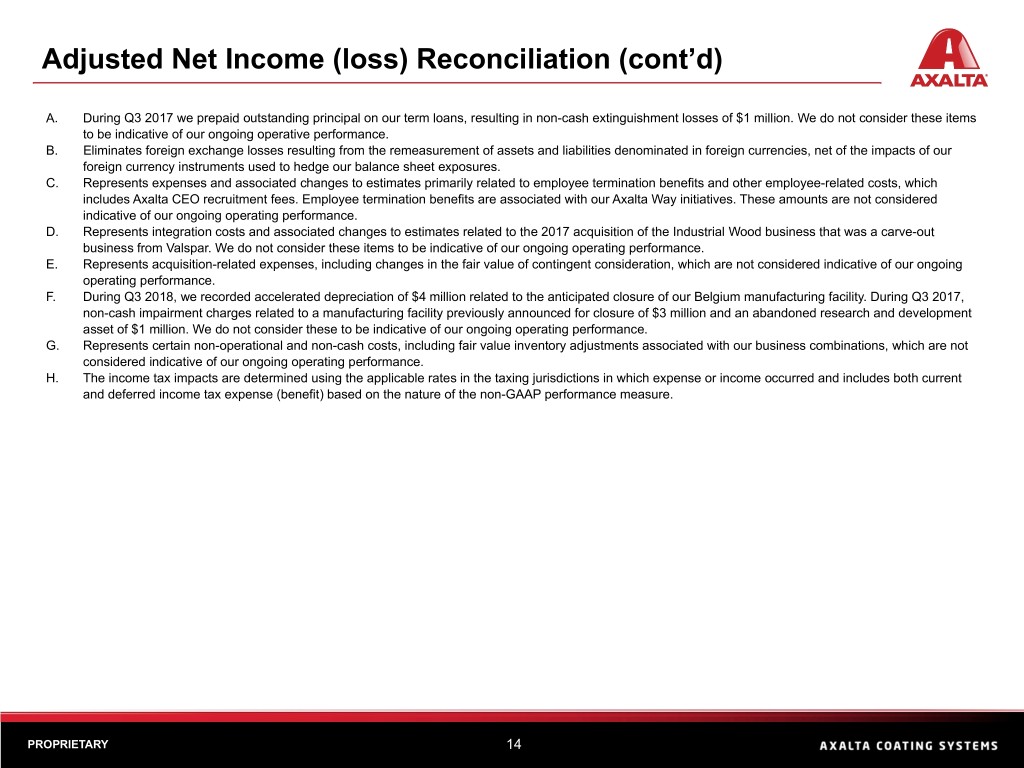
Adjusted Net Income (loss) Reconciliation (cont’d) A. During Q3 2017 we prepaid outstanding principal on our term loans, resulting in non-cash extinguishment losses of $1 million. We do not consider these items to be indicative of our ongoing operative performance. B. Eliminates foreign exchange losses resulting from the remeasurement of assets and liabilities denominated in foreign currencies, net of the impacts of our foreign currency instruments used to hedge our balance sheet exposures. C. Represents expenses and associated changes to estimates primarily related to employee termination benefits and other employee-related costs, which includes Axalta CEO recruitment fees. Employee termination benefits are associated with our Axalta Way initiatives. These amounts are not considered indicative of our ongoing operating performance. D. Represents integration costs and associated changes to estimates related to the 2017 acquisition of the Industrial Wood business that was a carve-out business from Valspar. We do not consider these items to be indicative of our ongoing operating performance. E. Represents acquisition-related expenses, including changes in the fair value of contingent consideration, which are not considered indicative of our ongoing operating performance. F. During Q3 2018, we recorded accelerated depreciation of $4 million related to the anticipated closure of our Belgium manufacturing facility. During Q3 2017, non-cash impairment charges related to a manufacturing facility previously announced for closure of $3 million and an abandoned research and development asset of $1 million. We do not consider these to be indicative of our ongoing operating performance. G. Represents certain non-operational and non-cash costs, including fair value inventory adjustments associated with our business combinations, which are not considered indicative of our ongoing operating performance. H. The income tax impacts are determined using the applicable rates in the taxing jurisdictions in which expense or income occurred and includes both current and deferred income tax expense (benefit) based on the nature of the non-GAAP performance measure. PROPRIETARY 14

Thank you Investor Relations Contact: Chris Mecray Christopher.Mecray@axalta.com 215-255-7970